
|
|
Chapter 14
|

With a BlackBerry full of information about hitters on hand, he searches for clues, patterns, anything that will help him through the next inning, all the while beseeching pitchers who wander by to share any tidbit they have picked up.
Jorge L. Ortiz, USA TODAY, 10/12/2005 writing about Roger Clemens
After studying this chapter you will be able to:
• Understand major data mining terms
• Use data mining best practices
• Avoid data mining traps.
In Chapter 13, you gained an understanding of Statistics. You learned about the branches of statistics, including descriptive and predictive statistics. The use of controls and sampling carry over to data mining.
In this chapter, you will advance your knowledge in the area of data mining and analytics. Data mining is a set of techniques for analyzing large volumes of data. It is useful for uncovering previously unknown patterns or knowledge. This differs from BI, which seeks to provide 100% correct answers based on known data.
The term Data Mining is sometimes mistakenly used to refer to all data querying – this is not true. Data querying without analytics is not data mining. In addition, data mining is much more open-ended than data querying and BI, yet builds on many of the same disciplines, including statistics, database technology, algorithms, and machine learning. Figure 14-01 illustrates the dependency of data mining on related disciplines and concepts.
Figure 14-01: Data Mining and Related Concepts

The two approaches to selecting the scope of data are directed and undirected. Directed data mining is often predictive in nature, while undirected data mining is descriptive in nature. Table 14-01 defines data mining terms.
Table 14-01: Data Mining and Analytics Terms
|
Term |
Definition |
|
Data Mining |
Data mining is the application of analytical methods to huge volumes of data to find new and useful patterns or knowledge. |
|
Optimization Analytics |
The use of analytic methods such as data mining and statistics to make decisions (“next best action”) with the best outcomes. For example, optimization analytics may recommend the most profitable price to offer to an auto insurance customer. |
|
Predictive Analytics |
The use of analytic methods such as data mining and statistics to anticipate future outcomes. For example, predictive analytics may provide insights into future demand for a product or the buying habits of a customer. |
Directed Data Mining is very specific. It aims to provide an understanding of a particular data topic, like response to a marketing offer or credit worthiness. It is Predictive Data Mining that forecasts the direction and properties of targeted data using a large volume of data as input.
In contrast to directed data mining, Undirected Data Mining seeks to provide an understanding of patterns in data without the goal of learning about a specific target field. It is Descriptive Data Mining that aims to understand a set of data which, in turn, represents real world entities such as customers or investments. Data that depicts the subject area is presented in understandable and useful forms.
Predictive Data Mining
Predicting the future and recommending courses of action are critical decision support functions achieved through data mining. Activities of data mining that are predictive in nature include:
• Classification – dividing entities into predefined classes such as good credit risks and poor credit risks.
• Estimation – surmising unknown current values such as net worth based on known values.
• Prediction – anticipating future values such as customer lifetime value based on a set of known values.
• Recommendation – proposing the actions that will result in the best predicted result.
Use of predictive models is a hallmark of predictive data modeling. A predictive model is a depiction of how something functions. It can translate input data into a prediction that applies to reality such as those described in Table 14-02.
Table 14-02: Input Data and Predicted Attributes
|
Input Data |
Predicted Attribute |
|
Customer Profile Information such as payment history |
Offer credit – Yes or No Or Credit Score |
|
Student Profile Information such as grades, honors, and activities |
Offer college admittance – Yes or No Or college admittance ranking |
|
Baseball player profiles such as batting average, birth date, weight, health history |
Recruiting priority score |
|
Bridge characteristics – age, materials, construction technique, and inspection results |
Bridge repair / replacement score |
The predictive model is developed using multiple sets of input data:
• Training Set – a set of data that contains attributes along with the predicted attribute. Data mining analysis builds models that can determine the predicted attribute using the training attributes.
• Validation Set – a set of data that tests the predictive models, enabling the selection of the most effective model.
• Test Set – a set of data that tests the performance of the model.
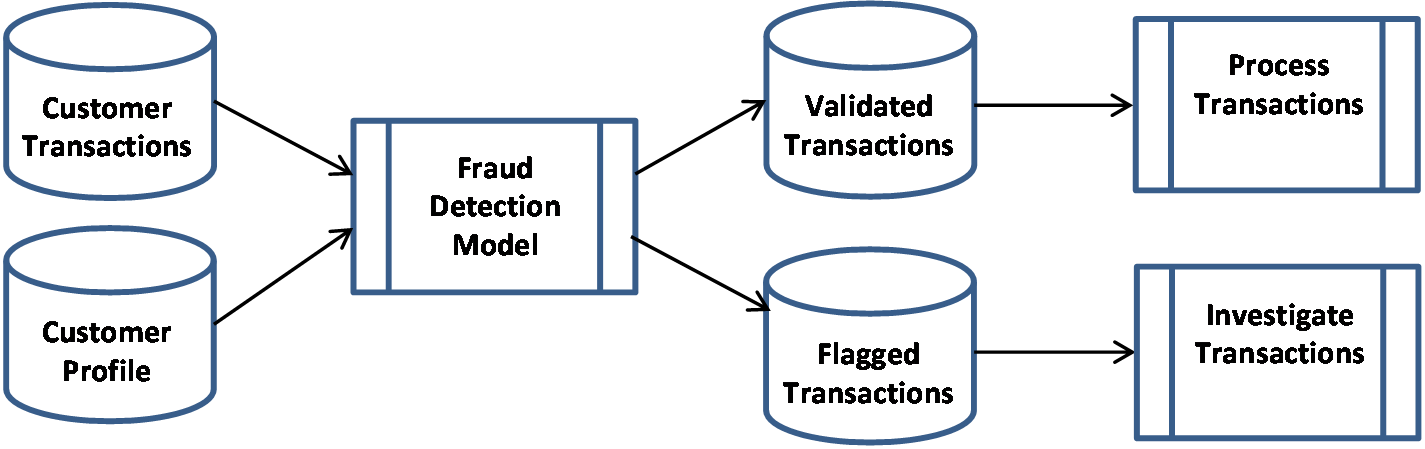
Predictive data mining may require the development and comparison of multiple models in order to find the one that produces the best practical results. After the predictive model is developed, it can be used repeatedly to analyze data that represents real world situations. For example, it may be used to flag activity as potentially fraudulent, as shown in Figure 14-02.
Figure 14-02: Fraud Detection Model
Descriptive Data Mining
Descriptive data mining seeks to find interesting patterns in data. Data mining activities that are descriptive include:
• Description and profiling – describing distinguishing characteristics of groups of entities such as customers.
• Clustering – grouping entities into mutually exclusive groups where members of each group are similar to each other and different from other groups.
• Affinity Grouping – placing entities into groups with similar associations. For example, Market Basket Analysis (MBA) identifies products that are frequently purchased together.
• Outlier analysis – discovery process that identifies anomalies, which are data points outside the range of other data points in the same set. In other words, finding exceptions.
Clusters
Clusters are groupings of data points with a large degree of affinity. In other words, data is being categorized. This means that data points within a cluster are closer to other members of the cluster and farther away from members of other clusters. Figure 14-03 depicts an example of obvious clusters.
Figure 14-03: Clusters

Clustering a small set of data with two dimensions is usually straightforward. When there is a large sample size or population with dozens to thousands of attributes, it becomes more difficult and requires the use of statistical algorithms. These algorithms use measures of distance to determine how far apart or close together the data points are.
Applications of clustering include:
• Customer analysis
• Cataloging of astronomical objects
• Grouping books and music into genres.
The ability to cluster books has given Amazon a competitive advantage. The display of book titles that are related leads to more sales and is a service to customers.
Predictive Data Mining – Decision Trees
A decision tree is a structure that enables large collections of inputs to be classified into homogeneous groups through a series of choices called nodes. The tree is processed from left to right or top to bottom, with the first node called the root node, nodes secondary to the root node called child nodes, and nodes at the bottom called leaf nodes. Figure 14-04 depicts a generic decision tree. The leaf nodes are where the final group/value is determined.
Figure 14-04: Decision Tree

Decision tree algorithms have been available since the late 1970s. These algorithms include ID3 (late 1970s), C.4.5 (1980), and Classification and Regression Trees (CART – 1984). Developing a decision tree requires providing a set of training data to a software package which determines the appropriate set of rules that results in the desired classification.
The strengths of decision trees include their understandability, applicability to practical problems, and their generation of business rules that can be applied to further sets of data. The weaknesses of decision trees include output of a single discrete attribute, so they are not suited to generating a series of actions or continuous values.
Consider using decision trees when the desired output is a discrete value and input data can be described by multiple attribute value pairs. The final group/value can correspond to a decision, such as grant credit, place an order, or hire a baseball player.
Predictive Data Mining – Neural Nets
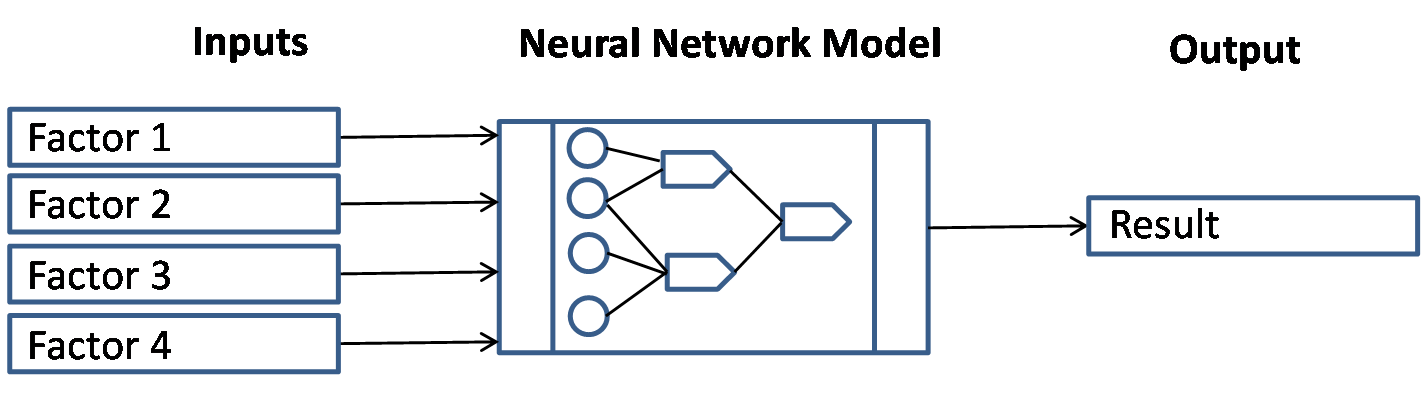
A neural net is a flexible predictive analytics tool that mimics the learning of the human brain. A neural net model accepts a large collection of known inputs and produces an output that may be continuous-valued. The net is processed from left to right, with inputs entering on the left and the final result output to the right. The model includes nodes referred to as neurons, and flows of data known as edges. Each node transfers inputs to an output using an algorithm, along with weights assigned to the inputs. Figure 14-05 shows a simple neural net model.
Figure 14-05: Neural Net
One way that neural nets learn is through a process called backward propagation. This is a feedback loop which enables the neural net to adjust the weights assigned to inputs. This powerful technique enables neural nets to produce surprisingly perceptive outputs.
The strengths of neural nets include the ability to handle many cases, the ability to handle poorly structured problems, and have easy implementation. Consider using neural nets when the desired output can be continuously valued and a high quality training data set is available.
The weakness of neural nets is that they are not easy to understand. The workings are hidden in a black box which does not make for intuitive explanations of how outputs are generated. This makes it difficult to evaluate the quality of neural network results.
Data Mining Tips and Traps
It's not so much how busy you are, but why you are busy. The bee is praised; the mosquito is swatted.
Marie O'Connor
Obtaining good input data is critical to building a successful predictive model. By studying this book, you have learned much about data – data definition, data modeling, data governance, and data quality. All of these disciplines are helpful in obtaining and conditioning data for data mining. Data Issues that are particular traps in data mining are described in Table 14-03. Also, see Table 10-01 of the Data Sources chapter for additional ways to deal with data issues.
Table 14-03: Dealing with Data Issues Specific to Data Mining
|
Data Issue |
Explanation and Correction Procedure |
|
Outliers |
Outliers are extreme data values that are far from the average. These outliers can distort the predicted outputs. If necessary, avoid this by examining the outliers and removing them from the training data set. |
|
Data is a Synonym of Predicted Attribute |
Suppose we want to predict income level using data mining? It would not make sense to include gross income as an input, but if it's available, the model will use this factor to predict the outcome. It is not telling us anything that we do not already know. |
|
Noise |
Data that is not going to be a factor in determining the results is noise. For example, social security number is not a factor in credit worthiness, so it should not be part of the training data set. In general, unique identifiers are not helpful in data mining or statistical analysis. |
Learn More
Expand your knowledge of data mining using these helpful resources.
|
Visit a website! |
KDNuggets™ – is a great data mining and analytics resource: http://www.kdnuggets.com/ |
|
Read about it! |
I recommend these books on Data Mining: Pang-Ninq and Michael Steinbach and Vipin Kumar. Introduction to Data Mining – First Edition. Addison Wesley, 2005. Celko, Joe. Joe Celko's Analytics & OLAP in SQL. Morgan Kaufmann, 2006. |
|
Get Research! |
Search the web for research reports (filetype=pdf): • Aberdeen Executive Intelligence • Forrester Wave Predictive Analytics • Gartner Magic Quadrant Business Intelligence
|
|
Try this software! |
RapidMiner is a leading open source platform that provides integrated data mining capabilities. This product is both powerful and easy to use. Models are developed through a rapid prototyping approach and can include predictive analytics, reporting, and ETL. This product is in use by major organizations in numerous countries: http://www.rapid-i.com Excellent tutorials are available at the product website and at youtube.com. |
|
Key Points • Data mining addresses large volumes of data versus the data samples addressed by statistics. • Data mining can be used to discovery previously unknown patterns and knowledge. • Descriptive data mining aids in understanding a set of data. • Predictive data mining infers the future and may recommend courses of action. • A training set of data is used by data mining analytics to build predictive models. • Obtain high quality input data. Avoid garbage data – “garbage in, garbage out” is all too true. • Remove outlier data, which can distort results. • Do not include synonyms of the predicted attribute, otherwise you will predict what you already know. • Descriptive data mining enables better understanding of data and the reality that it represents. • Clustering enables classification of entities such as customers into groups with a large degree of affinity. • Decision trees classify collections of inputs through a series of choices that resemble a tree. • Neural nets mimic the human brain to learn and solve problems. |