
Chapter 11
Networking
Almost all malware has some sort of networking capability, whether the purpose is to contact a command and control server, spread to other machines, or create a backdoor on the system. Because the Windows OS must maintain state and pass packets it receives to the correct process or driver, it is no surprise that the involved API functions result in the creation of significant artifacts in memory. Additionally, attackers, whether remote or local, inevitably leave traces of their network activities in web browser histories, DNS caches, and so on.
This chapter provides you with an understanding of how network artifacts are created in memory and which factors are most important to your investigation. Also, you learn the significance of Microsoft fully redesigning the TCP/IP stack starting with Windows Vista; and you’ll explore two undocumented methods of recovering sockets and connections from memory dumps. Furthermore, you’ll discover why responding quickly to potential incidents is paramount, and why correlating network-related evidence in memory with external data sources such as packet captures and firewall/proxy/IDS logs is invaluable.
Network Artifacts
The two primary types of network artifacts are sockets and connections. Sockets define endpoints for communications. Applications create client sockets to initiate connections to remote servers and they create server sockets to listen on an interface for incoming connections. You have a few ways to create these sockets:
- Direct from user mode: Applications can call the
socketfunction from the Winsock2 API (ws2_32.dll). - Indirect from user mode: Applications can call functions in libraries such as WinINet (
wininet.dll), which provide wrappers around the Winsock2 functions. - Direct from kernel mode: Kernel drivers can create sockets through the use of the Transport Driver Interface (TDI), which is the primary interface to the transport stack used by higher-level components such as Winsock2.
Windows Sockets API (Winsock)
When an application calls socket, it passes the following information:
- An address family (
AF_INETfor IPv4,AF_INET6for IPv6) - A type (
SOCK_STREAM,SOCK_DGRAM,SOCK_RAW) - A protocol (
IPPROTO_TCP,IPPROTO_UDP,IPPROTO_IP,IPPROTO_ICMP)
After an application calls socket, the socket isn’t ready for use. Servers must supply the local address and port when calling bind and listen. Likewise, clients must supply the remote address and port when calling connect (bind is optional for clients). A socket cannot work until it knows the IP and port. Therefore, it makes sense that the _ADDRESS_OBJECT (the name of the structure that represents socket objects) is allocated after the call to bind or connect rather than after the call to socket.
Figure 11-1 shows the sequence of API calls required to create a simple TCP server, and the relationship between those APIs and the artifacts in memory. Figure 11-2 shows the same relationship for a TCP client. For the entire source code, see the Windows sockets reference on MSDN (http://msdn.microsoft.com/en-us/library/ms740673%28VS.85%29.aspx).
The figures show the following:
- The server and client both start out with a call to
socket, which causes the calling process to open a handle toDeviceAfdEndpoint. This handle enables the user mode process to communicate withAfd.sysin kernel mode, which is the Auxiliary Function Driver for Winsock2. This is not an optional handle; it must remain open for the duration of the socket’s lifetime, or else the socket will become invalid. - The server calls
bind(this is optional for the client), which results in the following artifacts. Note that the server also callslisten, which doesn’t create new artifacts.- The calling process opens a handle to
DeviceTcp,DeviceUdp, orDeviceIp, depending on the protocol specified in the call tosocket. - Memory is allocated in the kernel for an
_ADDRESS_OBJECTstructure, and its members are filled in according to the parameters sent tosocketandbind.
- The calling process opens a handle to
- The client calls
connect, which results in the same artifacts as discussed previously, in addition to the allocation of a_TCPT_OBJECT(i.e., connection object). For every connection established with a client (whenacceptreturns), the server process will also become associated with a_TCPT_OBJECTand a new set of handles. These artifacts exist until the applications callclosesocket, at which time the handles are closed and the objects are released.
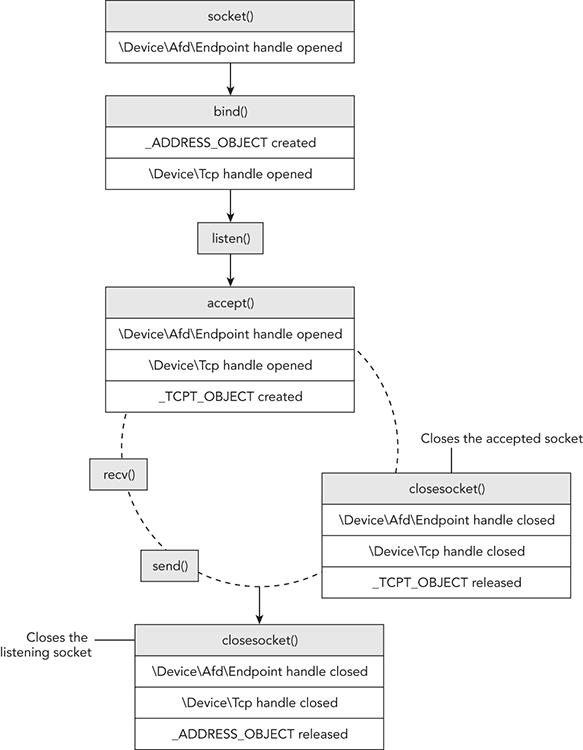
Figure 11-1: The relationship between socket APIs and the artifacts they create in memory (server side)
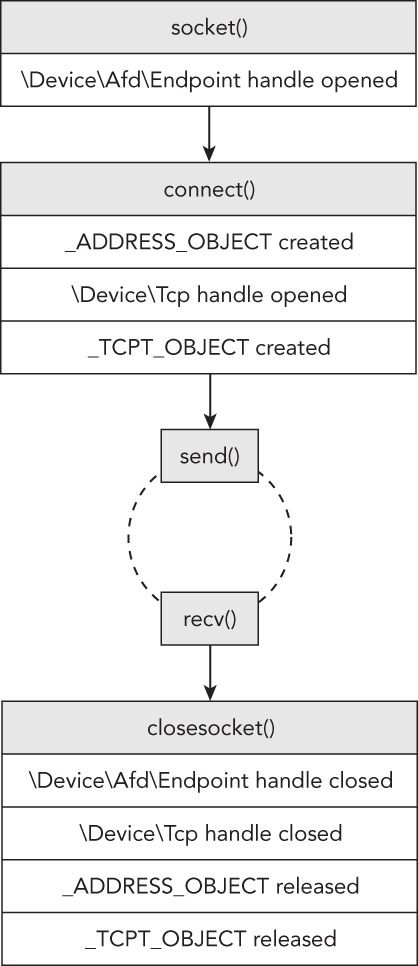
Figure 11-2: The relationship between socket APIs and the artifacts they create in memory (client side)
Now that you have an understanding of how and when different network artifacts are created in memory, you’ll move on to see how to locate them in memory dumps and the types of conclusions you can draw during an investigation.
Active Sockets and Connections
The operating system maintains active sockets and connections by using a chained-overflow hash table, which consists of singly linked lists (see Chapter 2). Thus, one way to enumerate the existing sockets on the system is to find and walk all entries in the hash table. You treat each nonzero entry as the start of a singly linked list of _ADDRESS_OBJECT structures, and follow the Next pointers until reaching the end of the list (indicated by a Next value of zero). Likewise, you could do the same thing with the _TCPT_OBJECT list to enumerate the open connections on a system.
In fact, this is how the sockets and connections plugins in Volatility work. For either command, Volatility finds the tcpip.sys module in kernel memory and locates a non-exported, global variable in its data section. For sockets, the variable that Volatility finds is named _AddrObjTable, which stores a pointer to the first _ADDRESS_OBJECT entry. For connections, it finds a variable named _TCBTable, which stores a pointer to the first _TCPT_OBJECT entry. Figure 11-3 shows a diagram of the enumeration procedure.
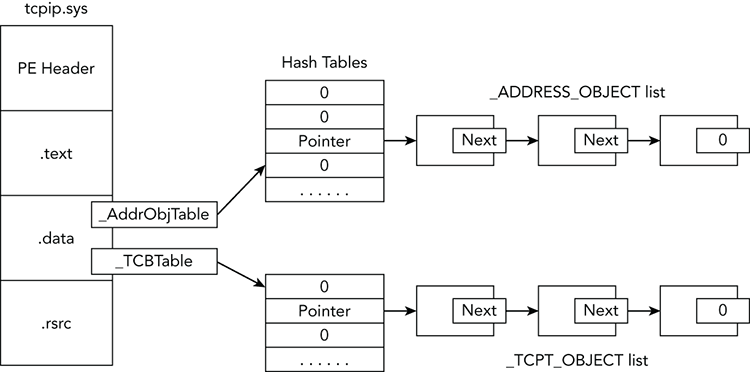
Figure 11-3: Diagram of locating the socket and connection objects in memory on XP and 2003 systems
The following command shows an example of using Volatility to print the sockets of a memory dump infected with Zeus malware:
$ python vol.py sockets -f zeus.bin --profile=WinXPSP3x86
Volatility Foundation Volatility Framework 2.4
   PID   Port   Proto  Protocol        Address         Create Time
-------- ------ ------ --------------- --------------- -----------
 1156   1900     17 UDP             192.168.128.128 2008-12-11 20:51:52
  892  19705      6 TCP             0.0.0.0         2009-02-12 03:38:14
  740    500     17 UDP             0.0.0.0         2008-09-18 05:33:19
    4    139      6 TCP             192.168.128.128 2008-12-11 20:51:51
    4    445      6 TCP             0.0.0.0         2008-09-18 05:32:51
  972    135      6 TCP             0.0.0.0         2008-09-18 05:32:59
    4    137     17 UDP             192.168.128.128 2008-12-11 20:51:51
 1320   1029      6 TCP             127.0.0.1       2008-09-18 05:33:29
 1064    123     17 UDP             127.0.0.1       2008-12-11 20:51:52
  740      0    255 Reserved        0.0.0.0         2008-09-18 05:33:19
 1112   1025     17 UDP             0.0.0.0         2008-09-18 05:33:28
 1112   1033     17 UDP             0.0.0.0         2008-09-18 05:42:19
    4    138     17 UDP             192.168.128.128 2008-12-11 20:51:51
  892  35335      6 TCP             0.0.0.0         2009-02-12 03:38:14
 1112   1115     17 UDP             0.0.0.0         2008-12-11 18:54:24
 1064    123     17 UDP             192.168.128.128 2008-12-11 20:51:52
  892   1277      6 TCP             0.0.0.0         2009-02-12 03:38:15
 1156   1900     17 UDP             127.0.0.1       2008-12-11 20:51:52
  740   4500     17 UDP             0.0.0.0         2008-09-18 05:33:19
 1064   1276     17 UDP             127.0.0.1       2009-02-12 03:38:12
 1064   1275     17 UDP             192.168.128.128 2009-02-12 03:38:12
    4    445     17 UDP             0.0.0.0         2008-09-18 05:32:51
In the output, you can see the process ID of the owning process, port, protocol, and creation time. Let’s begin the analysis by looking at the entry in bold at the top, showing that a process with PID 892 is using TCP port 19705. Because an _ADDRESS_OBJECT is allocated for client and server sockets, you cannot tell whether the process is listening for incoming connections on TCP port 19705 or whether the process just established a TCP connection with a remote endpoint (for example, memoryanalysis.net:80) using 19705 as the source port.
One thing you know, however, is that ports below 1025 are typically reserved for servers. Ports above 1025 could be either ephemeral (e.g., short-lived) client ports or server ports for applications that do not have the required privileges to bind to ports in the lower ranges. Of course, there are always exceptions (such as Remote Desktop Protocol [RDP], which binds to TCP 3389 even if it has admin privileges). Thus, you’ll need more information to distinguish the purpose of the TCP socket using port 19705.
Let’s continue with what you know about ephemeral client ports: They increase by one until reaching the maximum (which varies, see the upcoming Note), at which point they wrap back around to 1025. If TCP 19705 happens to be a client socket, other processes on the system that created client sockets within a few seconds would be assigned a value close to 19705. Let’s place all the sockets created within the same time period in order based on the creation time and see whether any evidence supports our theory:
   PID   Port   Proto  Protocol        Address         Create Time
-------- ------ ------ --------------- --------------- -----------
  1064   1276     17   UDP             127.0.0.1       2009-02-12 03:38:12
  1064   1275     17   UDP             192.168.128.128 2009-02-12 03:38:12
  892   19705      6   TCP             0.0.0.0         2009-02-12 03:38:14
  892   35335      6   TCP             0.0.0.0         2009-02-12 03:38:14
  892    1277      6   TCP             0.0.0.0         2009-02-12 03:38:15
At 03:38:12, the system assigned ports 1275 and 1276 to a process with PID 1064. Three seconds later, at 03:38:15, the system assigned port 1277 to a process with PID 892. In between these events, at 03:38:14, you see sockets created with the extremely far-off numbers 19705 and 35335. This pattern indicates that the sockets with ports 1275, 1276, and 1277 are probably ephemeral client sockets, and sockets with ports 19705 and 35335 are server sockets. Furthermore, because the first two client sockets are using UDP, they may be involved in making DNS requests.
You can investigate further by determining which processes are using these sockets and whether there are any active connections. The following output shows that the sockets in question were created by two different instances of svchost.exe and that TCP 1277 is, in fact, a client socket that is connected to port 80 of XX.XX.117.254 (an address in Ukraine). Note: XX indicates redacted values.
$ python vol.py -f zeus.vmem --profile=WinXPSP3x86 pslist | grep 892
Volatility Foundation Volatility Framework 2.4
Name                 PID   PPID   Thds     Hnds   Sess  Start
----------------- ------ ------ ------ -------- ------ ------------------
svchost.exe          892    728     26      294      0  2008-09-18 05:32:58

$ python vol.py -f zeus.vmem --profile=WinXPSP3x86 pslist | grep 1064
Volatility Foundation Volatility Framework 2.4
Name                 PID   PPID   Thds     Hnds   Sess  Start
----------------- ------ ------ ------ -------- ------ ------------------
svchost.exe         1064    728     62     1235      0  2008-09-18 05:32:59
$ python vol.py -f zeus.vmem --profile=WinXPSP3x86 connections
Volatility Foundation Volatility Framework 2.4
Offset(V)  Local Address             Remote Address            Pid
---------- ------------------------- ------------------------- ---
0x81eba510 192.168.128.128:1277      XX.XX.117.254:80          892
As you learned in Chapter 8, certain malware, including Zeus, injects code into other processes to remain stealthy. You can see the effect of the code injection and how it makes svchost.exe appear responsible for Zeus’ network-related activities. Although there are no active connections for the TCP 19705 and TCP 35335 sockets, it’s probably just because the attackers were not actively connected at the time of the memory acquisition or the infected system was behind a firewall and unreachable from the Internet.
Attributing Connections to Code
Although we’ve solved many pieces of the puzzle at this point, some questions remain unanswered. For example, what is the purpose of the listening TCP sockets? Do they provide a remote command shell or a SOCKS proxy that the attackers can use to route connections through the infected machine into other systems on the internal network? These are questions that you must answer by extracting the malicious code from the memory dump and analyzing it statically. However, finding the exact code segment that initiated a connection can be tricky.
We suggest first trying to determine whether the main process executable (the .exe) is malicious. If so, you can dump the process (the procdump plugin) and start reverse engineering from there. Examine the import address table (IAT) and follow cross-references to the socket, connect, and send APIs. That procedure typically leads you straight to the functions that handle networking.
If the main process seems legitimate (for example, it is explorer.exe or svchost.exe), maybe it has been the victim of code injection. In this case, you can perform a scan through the process’ memory looking for injected code blocks (e.g., using the malfind plugin) or for specific criteria related to the connection in question—such as part of a URL or a DNS hostname. You can perform these scans with the yarascan plugin, as shown in the following output. Assume the IP address (XX.XXX.5.140) was extracted from firewall logs on the victim system’s network.
$ python vol.py -f memory.raw yarascan --profile=WinXPSP3x86
      -p 3060 -W -Y "XX.XXX.5.140"
Volatility Foundation Volatility Framework 2.4
Rule: r1
Owner: Process ab.exe Pid 3060
0x5500e9ae  XX 00 XX 00 2e 00 XX 00 XX 00 XX 00 2e 00 35 00   X.X...X.X.X...5.
0x5500e9be  2e 00 31 00 34 00 30 00 3a 00 38 00 30 00 38 00   ..1.4.0.:.8.0.8.
0x5500e9ce  30 00 2f 00 7a 00 62 00 2f 00 76 00 5f 00 30 00   0./.z.b./.v._.0.
0x5500e9de  31 00 5f 00 61 00 2f 00 69 00 6e 00 2f 00 00 00   1._.a./.i.n./...
Searching for the substring XX.XXX.5.140 led to an instance of XX.XXX.5.140:8080/zb/v_01_a/in/ at address 0x5500e9ae, which certainly looks like part of a URL. If you perform a reverse lookup with dlllist, you’ll notice that this address range is inside a DLL named ab.dll that starts at 0x55000000.
$ python vol.py -f memory.raw yarascan --profile=WinXPSP3x86
      -p 3060 dlllist
Volatility Foundation Volatility Framework 2.4
************************************************************************
ab.exe pid:   3060
Command line : "C:WINDOWSsystem32ab.exe"
Service Pack 2

Base             Size  LoadCount Path
---------- ---------- ---------- ----
0x00400000    0x21000     0xffff C:WINDOWSsystem32ab.exe
0x7c900000    0xb0000     0xffff C:WINDOWSsystem32
tdll.dll
0x7c800000    0xc40f000     0xffff C:WINDOWSsystem32kernel32.dll
0x77d40000    0x90000     0xffff C:WINDOWSsystem32USER32.dll
0x77f10000    0x46000     0xffff C:WINDOWSsystem32GDI32.dll
0x77c10000    0x58000     0xffff C:WINDOWSsystem32msvcrt.dll
0x55000000    0x33000        0x1 C:WINDOWSsystem32ab.dll
0x77dd0000    0x9b000       0x14 C:WINDOWSsystem32advapi32.dll
0x77e70000    0x91000        0xb C:WINDOWSsystem32RPCRT4.dll
0x71ab0000    0x17000        0x1 C:WINDOWSsystem32WS2_32.dll
0x71aa0000     0x8000        0x1 C:WINDOWSsystem32WS2HELP.dll
0x77f60000    0x76000        0x3 C:WINDOWSsystem32SHLWAPI.dll
0x7c9c0000   0x814000        0x1 C:WINDOWSsystem32SHELL32.dll
0x5d090000    0x97000        0x1 C:WINDOWSsystem32comctl32.dll
0x77b40000    0x22000        0x1 C:WINDOWSsystem32Apphelp.dll
0x77c00000     0x8000        0x1 C:WINDOWSsystem32VERSION.dll
At this point, you can extract the DLL with dlldump and analyze it in the same way as an executable. Unfortunately, however, strings don’t always map back to DLLs. It all depends on how the malware was designed. Instead of planting a plain-text URL in the binary, it may be decoded at run time and copied to the heap or another virtually allocated memory block in the process’ space. Consider the next example, in which you find an interesting URL at 0x75d82438 by simply searching for http:
$ python vol.py -f jack.mem --profile=Win7SP0x86 yarascan
   -p 3030 --wide -Y "http"
Volatility Foundation Volatility Framework 2.4
Rule: r1
Owner: Process jack.exe Pid 3030
0x75d82438  68 00 74 00 74 00 70 00 3a 00 2f 00 2f 00 XX 00   h.t.t.p.:././.X.
0x75d82448  XX 00 XX 00 2e 00 31 00 33 00 34 00 2e 00 31 00   X.X...1.3.4...1.
0x75d82458  37 00 36 00 2e 00 31 00 32 00 36 00 2f 00 65 00   7.6...1.2.6./.e.
0x75d82468  78 00 69 00 73 00 74 00 73 00 2f 00 50 00 61 00   x.i.s.t.s./.P.a.
Rule: r1
Owner: Process jack.exe Pid 3030
0x76c02552  68 00 74 00 74 00 70 00 20 00 65 00 72 00 72 00   h.t.t.p...e.r.r.
0x76c02562  6f 00 72 00 73 00 00 00 90 90 55 00 72 00 6c 00   o.r.s.....U.r.l.
0x76c02572  45 00 6e 00 63 00 6f 00 64 00 69 00 6e 00 67 00   E.n.c.o.d.i.n.g.
0x76c02582  00 00 45 00 6e 00 61 00 62 00 6c 00 65 00 64 00   ..E.n.a.b.l.e.d.
[snip]
Upon further investigation, the 0x75d82438 address is not within any loaded DLLs. The presence of the URL at this location doesn’t tell you any more about the actual purpose of the connection than seeing the corresponding IP address (XXX.134.176.126) in the output of the sockets or connections plugins. You do have some useful information, however. And tedious as it may be, with this process you can sometimes have good success by searching for pointers to the referenced address. Before doing so, you must convert the integer 0x75d82438 to individual bytes and ensure that they’re in the appropriate order for the target operating system. Because we’re investigating Windows, which is typically running on little endian hardware, the search criteria looks like this:
$ python vol.py -f jack.mem --profile=Win7SP0x86 yarascan
     -p 3030 -Y "{38 24 d8 75}"
Volatility Foundation Volatility Framework 2.4
Rule: r1
Owner: Process jack.exe Pid 3030
0x75d47500  38 24 d8 75 ff b5 64 ff ff ff e8 da 37 00 00 85   8$.u..d.....7...
0x75d47510  c0 75 27 8b 03 53 ff b5 68 ff ff ff 89 85 60 ff   .u'..S..h.....`.
0x75d47520  ff ff 68 38 24 d8 75 e8 31 c7 fe ff 89 85 6c ff   ..h8$.u.1.....l.
0x75d47530  ff ff 85 c0 0f 8c 4a e2 01 00 6a 00 57 ff d6 83   ......J...j.W...
According to the output, there appears to be a pointer to 0x75d82438 saved at address 0x75d47500. You can then disassemble code around the saved pointer to see how it’s being used. Note that a few bytes were subtracted to show instructions both before and after the 0x75d47500 address.
$ python vol.py -f jack.mem  --profile=Win7SP0x86 volshell -p 3030
Volatility Foundation Volatility Framework 2.4
Current context: process jack.exe, pid=3030, ppid=2340 DTB=0x1f441380
Welcome to volshell!
To get help, type 'hh()'
>>> dis(0x75d474f0)
0x75d474f0 39058422d875                     CMP [0x75d82284], EAX
0x75d474f6 7542                             JNZ 0x75d4753a
0x75d474f8 a900100000                       TEST EAX, 0x1000
0x75d474fd 753b                             JNZ 0x75d4753a
0x75d474ff 683824d875                       PUSH DWORD 0x75d82438
0x75d47504 ffb564ffffff                     PUSH DWORD [EBP-0x9c]
0x75d4750a e8da370000                       CALL 0x75d4ace9
0x75d4750f 85c0                             TEST EAX, EAX
[snip]
>>> dis(0x75d4ace9)
0x75d4ace9 8bff                             MOV EDI, EDI
0x75d4aceb 55                               PUSH EBP
0x75d4acec 8bec                             MOV EBP, ESP
0x75d4acee 8b4d08                           MOV ECX, [EBP+0x8]
0x75d4acf1 8b550c                           MOV EDX, [EBP+0xc]
0x75d4acf4 0fb701                           MOVZX EAX, WORD [ECX]
0x75d4acf7 6685c0                           TEST AX, AX
[snip]
The pointer to the URL (0x75d82438) is being passed as the second parameter to the function at 0x75d4ace9. Thus, you can disassemble that function to determine where and, more importantly, how the URL is being used.
Inactive Sockets and Connections
Instead of walking the linked-lists in virtual address space (as the sockets and connections commands do), the sockscan and connscan commands scan the physical space of the memory dump searching for kernel pool allocations with the appropriate tag, size, and type (paged versus nonpaged), as described in Chapter 5. Thus, by using connscan and sockscan, you can potentially identify sockets and connections that were used in the past—because you’re also looking in freed and de-allocated memory blocks. Here’s an example:
$ python vol.py -f Win2K3SP0x64.vmem --profile=Win2003SP2x64 connscan
Volatility Foundation Volatility Framework 2.4
 Offset(P)  Local Address             Remote Address            Pid
---------- ------------------------- ------------------------- ------
0x0ea7a610 172.16.237.150:1419       74.125.229.187:80           2136
0x0eaa3c90 172.16.237.150:1393       216.115.98.241:80           2136
0x0eaa4480 172.16.237.150:1398       216.115.98.241:80           2136
0x0ead8560 172.16.237.150:1402       74.125.229.188:80           2136
0x0ee2d010 172.16.237.150:1403       74.125.229.188:80           2136
0x0eee09e0 172.16.237.150:1352       64.4.11.20:80               2136
0x0f9f83c0 172.16.237.150:1425       98.139.240.23:80            2136
0x0f9fe010 172.16.237.150:1394       216.115.98.241:80           2136
0x0fb2e2f0 172.16.237.150:1408       72.246.25.25:80             2136
0x0fb2e630 172.16.237.150:1389       209.191.122.70:80           2136
0x0fb72730 172.16.237.150:1424       98.139.240.23:80            2136
0x0fea3a80 172.16.237.150:1391       209.191.122.70:80           2136
0x0fec80e080 172.16.237.150:1369       64.4.11.30:80               2136
0x0ff21bc0 172.16.237.150:1418       74.125.229.188:80           2136
0x1019ec90 172.16.237.150:1397       216.115.98.241:80           2136
0x179099e0 172.16.237.150:1115       66.150.117.33:80            2856
0x2cdb1bf0 172.16.237.150:139        172.16.237.1:63369             4
0x339c2c00 172.16.237.150:1138       23.45.66.43:80              1332
0x39b10010 172.16.237.150:1148       12.206.53.84:443               0
The very last entry has an owning PID of zero, which is not a valid number for a process identifier. This is not the work of a rootkit changing the PID to zero or anything like that; it’s the scanner picking up a residual structure that’s been partially overwritten. You can tell that at one point it contained valid information because the source IP, source port, destination IP, and destination port all seem reasonable. It’s entirely possible to filter out invalid PIDs, but that would defeat the purpose of the scanner—and you’d miss the potentially critical clue that the local machine contacted an IP (12.206.53.84) on port 443.
Hidden Connections
You have a variety of ways to hide listening ports and active connections on a live system. Table 11-1 summarizes a few possibilities and discusses how you can detect them in memory dumps using Volatility.
| Rootkit Technique | Memory Detection |
Hook user mode APIs used by programs such as netstat.exe and TCPView.exe. Examples include DeviceIoControl, ZwDeviceIoControlFile, GetTcpTable, and GetExtendedTcpTable. The AFX rootkit works in this manner. | Use the apihooks plugin for Volatility to detect the hooks. Or you can also just use the sockets or connections (XP/2003) or netscan (Vista and later) commands because they do not rely on the live system’s APIs. |
Install a kernel driver that hooks the IRP_MJ_DEVICE_CONTROL function of DeviceTcp (owned by tcpip.sys) and filter attempts to gather information using the IOCTL_TCP_QUERY_INFORMATION_EX code. Jamie Butler wrote a proof-of-concept rootkit (TCPIRPHook) that uses this method. | Use the driverirp plugin for Volatility (see Chapter 13) or the sockets or connections (XP/2003) or netscan (Vista and later) commands. |
| Create an NDIS driver, which operates at a much lower level than Winsock2, thus bypassing the creation of common artifacts such as the socket and connection objects. | Focus on finding the loaded driver by scanning for driver objects or hidden kernel threads. Alternately, you can carve IP packets or Ethernet frames from the memory dump. |
IP Packets and Ethernet Frames
The previous section discussed the possibility of malware authors writing their own NDIS drivers, thus bypassing the Winsock2 APIs and their associated artifacts. However, even in this case, they must construct IP packets and Ethernet frames in RAM before sending them on the wire. Both types of data must conform to a standard that involves using a well-known structured header and various predictable constant values (e.g., IP version, IP header length). Thus, it’s relatively straightforward to scan through memory and find the headers, which are often immediately followed by payloads.
The earliest implementation was a plugin named linpktscan (Linux packet scanner) written for the DFRWS 2008 Forensic Challenge (see http://sandbox.dfrws.org/2008/Cohen_Collet_Walters/Digital_Forensics_Research_Workshop_2.pdf). This plugin searched for IP packets with a valid checksum, resulting in the authors’ ability to attribute certain packets back to the target system—specifically, those carrying fragments of an exfiltrated zip and FTP file transfers.
More recently, Jamaal Speights wrote a plugin named ethscan (http://jamaaldev.blogspot.com/2013/07/ethscan-volatility-memory-forensics.html) that finds Ethernet frames and consequently the encapsulated IP packets and payloads. Here’s an example of running the plugin with the –C option to save the data to out.pcap, which you can then analyze with an external tool such as Wireshark or Tcpdump.
$ python vol.py ethscan –f be2.vmem --profile=WinXPSP3x86
        –C out.pcap

[snip]

 Ethernet:    Src: (00:50:56:f1:2d:82)
              Dst: (00:0c:29:a4:81:79)
 Type:        IPv4 (0x0800)
 IPv4:        Src: 131.107.115.254:47873
              Dst: 172.16.176.143:3332
 Protocol:    TCP (6)
 Packet Size: (54) Bytes
 0x00000000  00 0c 29 a4 81 79 00 50 56 f1 2d 82 08 00 45 00   ..)..y.PV.-...E.
 0x00000010  00 28 29 85 00 00 80 06 bd 41 83 6b 73 fe ac 10   .()......A.ks...
 0x00000020  b0 8f 01 bb 04 0d 79 7e 45 77 d8 8d 3f 5e 50 10   ......y~Ew..?^P.
 0x00000030  fa f0 84 30 00 00                                 ...0..

[snip]
The following output shows a recovered IPv6 DNS request from a Linux system. Because DNS (and any traffic, for that matter) is a relatively fast operation, you’re unlikely to capture memory while the UDP socket is active. Even if you did, the output of the sockets command wouldn’t show you which hostname was being resolved. Thus, ethscan is an extremely valuable resource. The plugin recovered the desired hostname: itXXXn.org.
Ethernet:    Src: (::8605:80da:86dd:6000:0:24:1140)
             Dst: (60:9707:69ea::8605:80da:86dd:6000)
Type:        IPv6 (0x86DD)
IPv4:        Src: 3ffe:507::1:200:86ff:fe05:80da:2396
             Dst: 3ffe:501:4819::42:53
Protocol:    UDP (17)
Packet Size: (89) Bytes
0x00000000  00 60 97 07 69 ea 00 00 86 05 80 da 86 dd 60 00   .`..i.........`.
0x00000010  00 00 00 24 11 40 3f fe 05 07 00 00 00 01 02 00   ...$.@?.........
0x00000020  86 ff fe 05 80 da 3f fe 05 01 48 19 00 00 00 00   ......?...H.....
0x00000030  00 00 00 00 00 09 5c 00 35 00 24 f0 09 00 06 01   .......5.$.....
0x00000040  00 00 01 00 00 00 00 00 00 06 69 74 XX XX XX 6e   ..........itXXXn
0x00000050 03 6f 72 67 00 00 ff 00 01 .org.....DKOM Attacks
Direct Kernel Object Manipulation (DKOM) attacks are not as much a threat against socket and connection objects as they are for processes. In other words, you probably won’t see malware trying to unlink or overwrite an _ADDRESS_OBJECT to hide a listening socket or a _TCPT_OBJECT to hide an active connection. During our testing, which we presented in Recipe 18-3 of Malware Analyst’s Cookbook, we found that you must not overwrite these objects, or else a process’ capability to communicate over the network will fail.
It is, however, possible to perform DKOM on nonessential data such as the pool tags (that exist outside of the target structure) to hide from sockscan and connscan.
Raw Sockets and Sniffers
If a process is running with administrator privileges, it can enable raw sockets (see http://msdn.microsoft.com/en-us/library/ms740548%28VS.85%29.aspx) from user mode by using the Winsock2 API. Raw sockets enable programs to access the underlying transport layer data (such as IP or TCP headers), which can allow the system to forge or spoof packets. Additionally, malware can use raw sockets in promiscuous mode to capture passwords transmitted by the infected machine or other hosts on the same subnet.
Creating Raw Sockets
You can create a promiscuous mode socket with Winsock2 using the following steps:
- Create a raw socket by specifying the
SOCK_RAWandIPPROTO_IPflags to socket:SOCKET s = socket(AF_INET, SOCK_RAW, IPPROTO_IP); - Set the port to 0 when initializing the
sockaddr_instructure that you pass tobind. In this case, port 0 just means a port is not necessary.struct sockaddr_in sa; struct hostent *host = gethostbyname(the_hostname); memset(&sa, 0, sizeof(sa)); memcpy(&sa.sin_addr.s_addr, host->h_addr_list[in], sizeof(sa.sin_addr.s_addr)); sa.sin_family = AF_INET; sa.sin_port = 0; bind(s, (struct sockaddr *)&sa, sizeof(sa)); - Use the
WSAIoctlorioctlsocketfunctions with theSIO_RCVALLflag to enable promiscuous mode (i.e., “sniffing mode”) for the NIC associated with the socket:int buf; WSAIoctl(s, SIO_RCVALL, &buf, sizeof(buf), 0, 0, &in, 0, 0);
Detecting Raw Sockets
On a live Windows machine, you can use a tool called promiscdetect (see http://ntsecurity.nu/toolbox/promiscdetect/) to detect the presence of a network card in promiscuous mode. To detect them in a memory dump, you can use the Volatility sockets or handles commands. You don’t even need a special plugin! The artifacts left in memory by executing the previous three steps we described will stand out like a sore thumb. See if you can spot the process with the raw socket in this memory dump of a system infected with Gozi (also known as Ordergun and UrSniff).
$ python vol.py sockets -f ursniff.vmem --profile=WinXPSP3x86
Volatility Foundation Volatility Framework 2.4
PID Port Proto Protocol Address Create Time
-------- ------ ------ --------------- --------------- -----------
1052 123 17 UDP 172.16.99.130 2009-11-18 01:23:24
716 500 17 UDP 0.0.0.0 2009-11-18 01:23:20
1824 0 0 HOPOPT 172.16.99.130 2010-01-07 20:29:10
[...]
$ python vol.py files -p 1824 -f ursniff.vmem --profile=WinXPSP3x86
Volatility Foundation Volatility Framework 2.4
Offset(V) Pid Handle Access Type Details
---------- ------ ---------- ---------- ---------------- -------
0x818f9f90 1824 0xa0 0x1f01ff File DeviceAfdEndpoint
0x814d4b70 1824 0xa8 0x1f01ff File DeviceRawIp�
0x8145bf90 1824 0xd0 0x1f01ff File DeviceAfdEndpoint
0x8155cf90 1824 0xd4 0x1f01ff File DeviceTcp
[...]That was easy! In summary, processes that open raw sockets, with or without promiscuous mode, will have a socket bound to port 0 of protocol 0 and an open handle to DeviceRawIp�.
Next Generation TCP/IP Stack
Starting with Vista and Windows Server 2008, Microsoft introduced the Next Generation TCP/IP Stack (see http://technet.microsoft.com/en-us/network/bb545475.aspx). Its main goal was to enhance performance for both IPv4 and IPv6. In doing so, practically the entire tcpip.sys kernel module was rewritten; and as a result of such drastic changes, the way we recover network-related artifacts from memory needed to adapt.
Working Backward from netstat.exe
Regardless of which changes are made from one version of Windows to another, one thing you can take for granted is that netstat.exe will always work on a live machine. Thus, determining where netstat.exe gets its information is a good start to finding network-related artifacts in memory. This is the approach we took when developing Volatility’s capability to find sockets and connection structures in memory dumps from Vista and later operating systems.
In particular, we reverse engineered the APIs and modules (from both user mode and kernel mode) that are involved in producing network activity on a running system. It all begins when netstat.exe calls InternetGetTcpTable2 from iphlpapi.dll. The execution flow leads all the way back to tcpip.sys in a function named TcpEnumerateAllConnections. For more information on how we tracked these relationships, see http://mnin.blogspot.com/2011/03/volatilitys-new-netscan-module.html.
Volatility’s Netscan Plugin
After identifying the authoritative source of information printed by netstat.exe on a live machine, it was possible to build a Volatility plugin that directly accesses the data in RAM. This capability is implemented by the netscan plugin. It uses the pool-scanning approach (see Chapter 5) to locate the _TCP_ENDPOINT, _TCP_LISTENER, and _UDP_ENDPOINT structures in memory. Here’s an example of its output on a 64-bit Windows 7 machine:
$ python vol.py -f win764bit.raw --profile=Win7SP0x64 netscan
Volatility Foundation Volatility Framework 2.4
Proto    Local Address      Foreign Address      State        Pid   Owner
-----    --------------     ----------------     -----------  ----  ------------
TCPv4    0.0.0.0:135        0.0.0.0:0            LISTENING    628   svchost.exe
TCPv6    :::135             :::0                 LISTENING    628   svchost.exe
TCPv4    0.0.0.0:49152      0.0.0.0:0            LISTENING    332   wininit.exe
TCPv6    :::49152           :::0                 LISTENING    332   wininit.exe

[snip]

TCPv6    :::49153           :::0                 LISTENING    444   lsass.exe
TCPv4    0.0.0.0:49155      0.0.0.0:0            LISTENING    880   svchost.exe
TCPv6    :::49155           :::0                 LISTENING    880   svchost.exe
TCPv4    -:0                232.9.125.0:0        CLOSED       1     ?C?
TCPv4    -:49227            184.26.31.55:80      CLOSED       2820  iexplore.exe
TCPv4    -:49359            93.184.220.20:80     CLOSED       2820  iexplore.exe
TCPv4    10.0.2.15:49363    173.194.35.38:80     ESTABLISHED  2820  iexplore.exe
TCPv4    -:49341            82.165.218.111:80    CLOSED       2820  iexplore.exe
TCPv4    10.0.2.15:49254    74.125.31.157:80     CLOSE_WAIT   2820  iexplore.exe
TCPv4    10.0.2.15:49171    204.245.34.130:80    ESTABLISHED  2820  iexplore.exe
TCPv4    10.0.2.15:49347    173.194.35.36:80     CLOSE_WAIT   2820  iexplore.exe

[snip]

TCPv4    -:49168            157.55.15.32:80      CLOSED       2820  iexplore.exe
TCPv4    -:0                88.183.123.0:0       CLOSED       504   svchost.exe
TCPv4    10.0.2.15:49362    173.194.35.38:80     CLOSE_WAIT   2820  iexplore.exe
TCPv4    -:49262            184.26.31.55:80      CLOSED       2820  iexplore.exe
TCPv4    10.0.2.15:49221    204.245.34.130:80    ESTABLISHED  2820  iexplore.exe
TCPv4    10.0.2.15:49241    74.125.31.157:80     CLOSE_WAIT   2820  iexplore.exe
TCPv4    10.0.2.15:49319    74.125.127.148:80    CLOSE_WAIT   2820  iexplore.exe
UDPv4    10.0.2.15:1900     *:*                               1736  svchost.exe
UDPv4    0.0.0.0:59362      *:*                               1736  svchost.exe
UDPv6    :::59362           *:*                               1736  svchost.exe
UDPv4    0.0.0.0:3702       *:*                               1736  svchost.exe
UDPv6    :::3702            *:*                               1736  svchost.exe
In the output, a few rows display a dash (-) in place of the local or remote IP address. The dash indicates that the information could not be accessed in the memory dump. Unlike the XP and 2003 structures that store the IP address information in the actual structure, the Vista and later structures store pointers to pointers. Thus, to access the data, Volatility must dereference several pointers in virtual memory—a path that can often break if one or more pages along the way are swapped to disk.
Partition Tables
One of the ways Microsoft enhanced performance in the newly redesigned TCP/IP stack is by splitting the work between multiple processing cores. A global variable in the tcpip.sys module named PartitionTable stores a pointer to a _PARTITION_TABLE structure, which contains an array of _PARTITIONs. The exact number of partitions is a factor of the maximum number of CPUs the system can support. During the startup procedure for the tcpip.sys module, a function named TcpStartPartitionModule allocates memory for the partition structures and initializes them. Presumably, each core is responsible for processing connections in its partition; and when a process or driver requests connections, they’re added to the partition with the lightest load.
Figure 11-4 shows how to parse connection information based on the data in partition tables.
A _PARTITION contains three _RTL_DYNAMIC_HASH_TABLE structures—one for connections in each of the following states: established, SYN sent (waiting for the remote end to acknowledge), and time wait (about to become closed). The dynamic hash tables point to doubly linked lists of connection structures, such as _TCP_ENDPOINT. Thus, it’s relatively simple to start from a known variable (tcpip!PartitionTable) in the memory dump and collect all the current connection information.
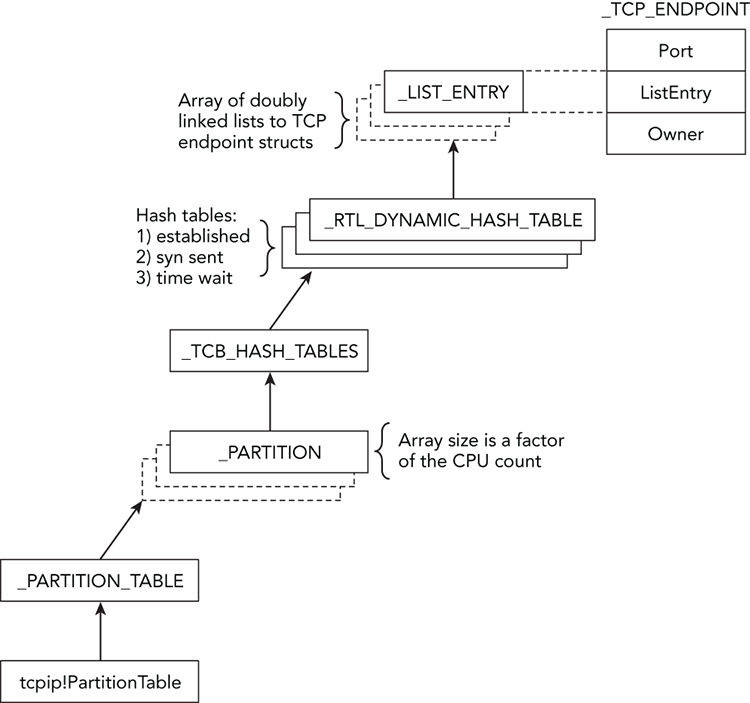
Figure 11-4: Diagram showing how the TCP partitions and hash tables can lead to connection structures
Port Pools and Bitmaps
Yet another undocumented approach to enumerating network activity in memory dumps involves port pools and bitmaps. In the “Big Page Pool” section of Chapter 5, you learned how to leverage the metadata that Windows stores regarding the locations of large kernel pool allocations. This is one example of putting that knowledge to use. In particular, the big page tracker tables will tell you the exact addresses of pools with the InPP tag—and those allocations store _INET_PORT_POOL structures.
These port pools contain a 65535-bit bitmap (one bit represents each port on a system) and an equal number of pointers to _PORT_ASSIGNMENT structures. An extremely fast way to determine which ports are in use on a system is to simply scan the bitmap (0 = unused, 1 = used). If a bit is set, Windows uses the index of the bit to compute the address of the corresponding _TCP_LISTENER, _TCP_ENDPOINT, or _UDP_ENDPOINT structure.
Figure 11-5 shows a diagram of the way these various structures relate to each other. The lightning icon indicates that the _PORT_ASSIGNMENT structures don’t directly point to the connection structures—the value is derived from a base address, plus the index of bits in the bitmap.
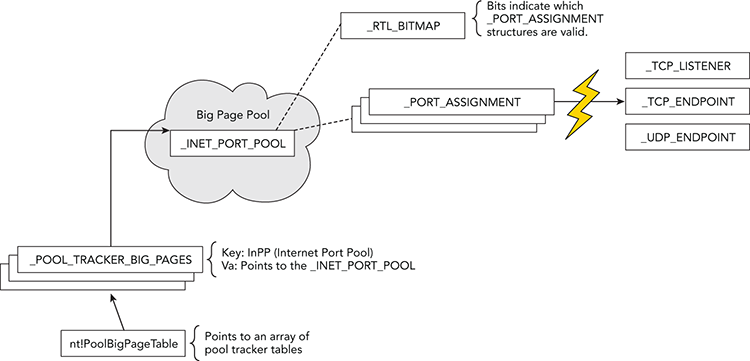
Figure 11-5: Diagram showing how port pools and bitmaps can be used to locate TCP and UDP activity in memory
Internet History
All web browsers optionally save a user’s browsing history in a file on disk. Before the browser process can access that information, it reads the file’s contents into RAM. Thus, if a user visits a page by explicitly typing a URL or clicking a link from a search engine, or even if malicious code uses the same network APIs as the browser, you have a good chance of recovering that information from memory. In other words, Internet Explorer’s history file (index.dat) is not only loaded by the browser but it’s also loaded by all processes, including Windows Explorer and malware samples that use the WinINet API (InternetConnect, InternetReadFile, HttpSendRequest, etc.) to access HTTP, HTTPS, or FTP sites.
To begin the discussion, you can identify a process in your memory dump that you suspect is making web requests. In this case, we chose two IE processes:
$ python vol.py -f win7_x64.dmp --profile=Win7SP0x64 pslist | grep iexplore
Volatility Foundation Volatility Framework 2.4
0x0000fa800dd11190 iexplore.exe  2580  1248  18   532  1  0 2011-04-24 04:04:42
0x0000fa800d0e73f0 iexplore.exe  3004  2580  77  1605  1  0 2011-04-24 04:04:42
Now that you know the PIDs (2580 and 3004), you can use the yarascan plugin to get an initial idea of where index.dat file mappings may exist in process memory. Because the file’s signature includes "Client UrlCache", that string will make a good starting point. This command is shown in the code that follows.
$ python vol.py -f win7_x64.dmp --profile=Win7SP0x64 yarascan
    -Y "Client UrlCache" -p 2580,3004
Volatility Foundation Volatility Framework 2.4
Rule: r1
Owner: Process iexplore.exe Pid 2580
0x00270000  43 6c 69 65 6e 74 20 55 72 6c 43 61 63 68 65 20   Client.UrlCache
0x00270010  4d 4d 46 20 56 65 72 20 35 2e 32 00 00 80 00 00   .MMF.Ver.5.2....
0x00270020  00 40 00 00 80 00 00 00 20 00 00 00 00 00 00 00   .@..............
0x00270030  00 00 80 00 00 00 00 00 00 00 00 00 00 00 00 00   ................
Rule: r1
Owner: Process iexplore.exe Pid 2580
0x00260000  43 6c 69 65 6e 74 20 55 72 6c 43 61 63 68 65 20   Client.UrlCache
0x00260010  4d 4d 46 20 56 65 72 20 35 2e 32 00 00 80 00 00   .MMF.Ver.5.2....
0x00260020  00 50 00 00 80 00 00 00 54 00 00 00 00 00 00 00   .P......T.......
0x00260030  00 00 20 03 00 00 00 00 55 ff 00 00 00 00 00 00   ........U.......
[snip]
The signature is found at two different locations inside the memory of the first IE process (PID 2580). However, to simply find history entries, you don’t need to parse the index.dat file header at all. For example, you can just scan for the individual history records that start with URL, LEAK, or REDR (there’s also a HASH tag, but it is not necessary for our goals). You can combine the multiple strings into a regular expression so you need to search only once, as shown in the following command:
$ python vol.py -f win7_x64.dmp --profile=Win7SP0x64 yarascan
     -Y "/(URL |REDR|LEAK)/" -p 2580,3004
Volatility Foundation Volatility Framework 2.4

Rule: r1
Owner: Process iexplore.exe Pid 3004
0x026c16f000  55 52 4c 20 03 00 00 00 00 99 35 2c 82 43 ca 01   URL.......5,.C..
0x026c16f010  a0 ec 34 cb 34 02 cc 01 00 00 00 00 00 00 00 00   ..4.4...........
0x026c16f020  76 01 00 00 00 00 00 00 00 00 00 00 00 00 00 00   v...............
0x026c16f030  60 00 00 00 68 00 00 00 03 01 10 10 c4 00 00 00   `...h...........
0x026c16f040  41 00 00 00 dc 00 00 00 7d 00 00 00 00 00 00 00   A.......}.......
0x026c16f050  98 3e a3 20 01 00 00 00 00 00 00 00 98 3e a3 20   .>...........>..
0x026c16f060  00 00 00 00 ef be ad de 68 74 74 70 3a 2f 2f 6d   ........http://m
0x026c16f070  73 6e 62 63 6d 65 64 69 61 2e 6d 73 6e 2e 63 6f   snbcmedia.msn.co

[snip]

Rule: r1
Owner: Process iexplore.exe Pid 3004
0x026c0b00  4c 45 41 4b 06 00 00 00 00 a6 3b 01 cc 97 cb 01   LEAK......;.....
0x026c0b10  c0 71 20 14 33 02 cc 01 98 3e 39 1f 00 00 00 00   .q..3....>9.....
0x026c0b20  f8 cf 00 00 00 00 00 00 00 00 00 00 80 2a 02 00   .............*..
0x026c0b30  60 00 00 00 68 00 00 00 03 00 10 10 40 02 00 00   `...h.......@...
0x026c0b40  41 00 00 00 60 02 00 00 9e 00 00 00 00 00 00 00   A...`...........
0x026c0b50  98 3e 99 1e 01 00 00 00 00 00 00 00 98 3e 99 1e   .>...........>..
0x026c0b60  00 00 00 00 ef be ad de 68 74 74 70 3a 2f 2f 75   ........http://u
0x026c0b70  73 65 2e 74 79 70 65 6b 69 74 2e 63 6f 6d 2f 6b   se.typekit.com/k

[snip]

Rule: r1
Owner: Process iexplore.exe Pid 3004
0x026c26e080  52 45 44 52 02 00 00 00 78 1b 02 00 40 af d3 51   REDR[email protected]
0x026c26e090  68 74 74 70 3a 2f 2f 62 73 2e 73 65 72 76 69 6e   http://bs.servin
0x026e26a0  67 2d 73 79 73 2e 63 6f 6d 2f 42 75 72 73 74 69   g-sys.com/Bursti
0x026e26b0  6e 67 50 69 70 65 2f 61 64 53 65 72 76 65 72 2e   ngPipe/adServer.
At offset 0x34 from the start of a URL or LEAK string, you can find a four-byte number (68 00 00 00, as shown in bold) that specifies the offset from the beginning of the string to the visited location (i.e., a URL). For redirected URLs, the location can be found at offset 0x10 of the REDR string. Given that information, you can already start finding URLs in memory that are related to the history (i.e., were indeed accessed), as opposed to those just lingering in memory.
Carving IE History Records
Although you’ve seen an easy way of locating sites in the IE history, you might have a need for different output formatting with better automation and results parsing. For example, instead of a hex dump, you might want a comma-separated value (CSV) file of visited URLs, timestamps, HTTP response data, and various other fields. To support these extra features, we built a plugin named iehistory that defines two rendering options. The default text mode displays blocks of data—one for each cache entry, as shown in the following output:
$ python vol.py -f win7_x64.dmp --profile=Win7SP0x64 iehistory -p 2580,3004
Volatility Foundation Volatility Framework 2.4
**************************************************
Process: 2580 iexplore.exe
Cache type "URL " at 0x275000
Record length: 0x100
Location: Cookie:[email protected]/
Last modified: 2011-04-24 03:53:15
Last accessed: 2011-04-24 03:53:15
File Offset: 0x100, Data Offset: 0x80, Data Length: 0x0
File: admin@go[1].txt

[snip]
**************************************************
Process: 2580 iexplore.exe
Cache type "URL " at 0x266500
Record length: 0x180
Location: https://ieonline.microsoft.com/ie/known_providers_download_v1.xml
Last modified: 2011-03-15 18:30:43
Last accessed: 2011-04-24 03:48:02
File Offset: 0x180, Data Offset: 0xac, Data Length: 0xd0
File: known_providers_download_v1[1].xml
Data: HTTP/1.1 200 OK
Content-Length: 49751
Content-Type: text/xml
The history data can be quite interesting. However, it can also be verbose, so you might want to try the CSV option and open it as a spreadsheet for sorting and filtering. This can be done by appending the --output=csv option to your command, as shown here:
$ python vol.py -f win7_x64.dmp --profile=Win7SP0x64 iehistory
    -p 2580,3004 --output=csv
Volatility Foundation Volatility Framework 2.4
URL ,2011-04-24 03:53:15,2011-04-24 03:53:15,
  Cookie:[email protected]/
URL ,2010-03-25 09:42:43,2011-04-24 04:04:46,
  http://www.google.com/favicon.ico
URL ,2010-08-10 00:03:00,2011-04-24 04:05:01,
  http://col.stc.s-msn.com/br/gbl/lg/csl/favicon.ico
URL ,2006-12-13 01:02:33,2011-04-24 04:05:08,
  http://www.adobe.com/favicon.ico
URL ,2011-03-15 18:30:43,2011-04-24 03:48:02,
  https://ieonline.microsoft.com/ie/known_providers_download_v1.xml
URL ,2010-08-30 15:37:13,2011-04-24 04:05:10,
  http://www.cnn.com/favicon.ie9.ico
[snip]
To produce a file that actually opens in a spreadsheet, redirect your output using the shell (i.e., vol.py [options] > output.csv) or use the built-in option to Volatility, such as --output-file=output.csv. You can then order by most recently accessed, and so on.
IE History in Malware Investigations
The following example shows the iehistory plugin analyzing a system infected with various malware samples. You can see the activity is actually spread across two processes: explorer.exe (PID 1928) and 15103.exe (PID 1192).
$ python vol.py -f exemplar17_1.vmem --profile=WinXPSP3x86 iehistory
Volatility Foundation Volatility Framework 2.4
**************************************************
Process: 1928 explorer.exe
Cache type "URL " at 0xf25100
Record length: 0x100
Location: Visited: foo@http://192.168.30.129/malware/40024.exe
Last modified: 2009-01-08 01:52:09
Last accessed: 2009-01-08 01:52:09
File Offset: 0x100, Data Offset: 0x0, Data Length: 0xa0
**************************************************
Process: 1928 explorer.exe
Cache type "URL " at 0xf25300
Record length: 0x180
Location: Visited: foo@http://www.abcjmp.com/jump1/?affiliate=mu1&subid=[snip]
Last modified: 2009-01-08 01:52:44
Last accessed: 2009-01-08 01:52:44
File Offset: 0x180, Data Offset: 0x0, Data Length: 0x108
**************************************************
Process: 1192 15103.exe
Cache type "URL " at 0xf56180
Record length: 0x180
Location: http://fhg-softportal.com/promo.exe
Last modified: 2009-03-23 16:14:17
Last accessed: 2009-01-08 01:52:15
File Offset: 0x180, Data Offset: 0x8c, Data Length: 0x9c
File: promo[1].exe
Data: HTTP/1.1 200 OK
ETag: "8554be-6200-49c7b559"
Content-Length: 25088
Content-Type: application/x-msdownload
Based on the output, you can tell exactly which URLs were visited. Furthermore, at least one of the files (promo.exe) was saved in the Temporary Internet Files folder as promo[1].exe. This provides you with artifacts that you can use to triage with disk forensics.
Brute Force URL Scans
There are a few situations we haven’t discussed yet. For example, what if you’re looking for all URLs in process memory (i.e., embedded in a web page but not yet visited, in JavaScript code, or in an e-mail body)? IE history files are also known to have slack space in which new records with smaller URLs can overwrite old records with long URLs, thus leaving part of the original domains intact. Furthermore, what about browsers that store history in different formats, such as Firefox and Chrome?
In the aforementioned cases, you can always search for URLs in a bit more forceful yet unstructured manner. If you don’t already have a favorite regular expression for finding domains, IPs, and URLs, try some of the ones on http://regexlib.com/Search.aspx?k=URL. The following command shows an example of using one of those regexes to find all domain names within certain top-level domains (com, org, net, mil, etc.).
$ python vol.py -f win7_x64.dmp --profile=Win7SP0x64 yarascan -p 3004
    -Y "/[a-zA-Z0-9-.]+.(com|org|net|mil|edu|biz|name|info)/"
Volatility Foundation Volatility Framework 2.4

Rule: r1
Owner: Process iexplore.exe Pid 3004
0x003e90dd  77 77 77 2e 72 65 75 74 65 72 73 2e 63 6f 6d 2f   www.reuters.com/
0x003e90ed  61 72 74 69 63 6c 65 2f 32 30 31 31 2f 30 34 2f   article/2011/04/
0x003e90fd  32 34 2f 75 73 2d 73 79 72 69 61 2d 70 72 6f 74   24/us-syria-prot
0x003e910d  65 73 74 73 2d 69 64 55 53 54 52 45 37 33 4c 31   ests-idUSTRE73L1
0x003e911d  53 4a 32 30 31 31 30 34 32 34 22 20 69 64 3d 22   SJ20110424".id="
0x003e912d  4d 41 41 34 41 45 67 42 55 41 4a 67 43 47 6f 43   MAA4AEgBUAJgCGoC
0x003e913d  64 58 4d 22 3e 3c 73 70 61 6e 20 63 6c 61 73 73   dXM"><span.class
0x003e914d  3d 22 74 69 74 6c 65 74 65 78 74 22 3e 52 65 75   ="titletext">Reu

Rule: r1
Owner: Process iexplore.exe Pid 3004
0x00490fa0  77 77 77 2e 62 69 6e 67 2e 63 6f 6d 2f 73 65 61   www.bing.com/sea
0x00490fb0  72 63 68 3f 71 3d 6c 65 61 72 6e 2b 74 6f 2b 70   rch?q=learn+to+p
0x00490fc0  6c 61 79 2b 68 61 72 6d 2b 31 11 3a 87 26 00 88   lay+harm+1.:.&..
0x00490fd0  00 00 00 00 00 00 00 00 80 00 00 00 00 00 00 00   ................
0x00490fe0  d8 50 0b 09 00 00 00 00 00 00 00 00 00 00 00 00   .P..............
0x00490ff0  00 00 00 00 3e 46 69 6e 5d c7 37 4e 20 00 00 00   ....>Fin].7N....
0x00491000  40 10 49 00 00 00 00 00 00 00 00 00 00 00 00 00   @.I.............
0x00491010  01 00 00 00 63 61 3c 2f 63 00 6f 00 6e 00 74 00   ....ca</c.o.n.t.
[snip]
The regular expression searches are very powerful. Instead of using yarascan on process or kernel memory, you could carve across the physical memory dump file and detect any URLs or domains that were lingering in freed or de-allocated storage.
DNS Cache Recovery
A system’s DNS cache is stored in the address space of the svchost.exe process that runs the DNS resolver service. Specifically, you’ll find the relevant data on the process’ heap(s). At the time of this writing, we’ve seen several proof-of-concept plugins (see https://code.google.com/p/volatility/issues/detail?id=124) for recovering the cached entries. However, the plugins focused on 32-bit Windows XP. If you need to analyze the cache during an investigation, your options are:
- Acquire memory with KnTTools (see Chapter 4). The acquisition software records DNS cache entries in an XML file.
- Integrate the command
ipconfig /displaydnsinto your live response toolkit. - Update one of the example Volatility plugins to work on more recent operating systems.
- Brute force the heaps of the
svchost.exeprocess looking for regular expressions of hostnames (see the technique we used in Chapter 8 to find user input on the Notepad process’ heap).
Additionally, you might be interested in the target system’s DNS hosts file. When applications call DnsQuery, as long as they don’t set the DNS_QUERY_NO_HOSTS_FILE flag, the resolver service will return matching data from the hosts file (if it exists) before forwarding the request to a DNS server. Malicious code often sabotages the hosts file to prevent access to certain websites. Thus, inspecting the file’s content gives you another method to detect unauthorized modifications to the system.
To access the hosts file, use the filescan and dumpfiles plugins (see Chapter 16), as shown in the following commands. The first command finds the physical offset of the hosts file’s _FILE_OBJECT structure. The second command extracts the file’s content to disk.
$ python vol.py -f infectedhosts.dmp filescan | grep -i hosts
Volatility Foundation Volatility Framework 2.4
0x0000000002192f90      1      0 R--rw- DeviceHarddiskVolume1WINDOWSsystem32driversetchosts

$ python vol.py -f infectedhosts.dmp dumpfiles -Q 0x2192f90 -D OUTDIR --name
Volatility Foundation Volatility Framework 2.4
DataSectionObject 0x02192f90   None
DeviceHarddiskVolume1WINDOWSsystem32driversetchosts
The next command shows the entries in the infected system’s hosts file. As a result of these entries, programs on the running machine are not able to access any popular antivirus websites or update servers.
$ strings OUTDIR/file.None.0x8211f1f8.hosts.dat
# Copyright (c) 1993-1999 Microsoft Corp.

[snip]

127.0.0.1 localhost
127.0.0.1 avp.com
127.0.0.1 ca.com
127.0.0.1 customer.symantec.com
127.0.0.1 dispatch.mcafee.com
127.0.0.1 f-secure.com
127.0.0.1 kaspersky.com
127.0.0.1 liveupdate.symantec.com
Summary
Many investigations start out with an alert from a firewall or intrusion detection system (IDS). While full network packet captures are extremely valuable, they’re not always available. Even if captures are provided to you, you’ll still need volatile memory to solve many aspects of the incident. For example, you must know how to track connections back to specific processes and drivers if you expect to classify the behavior as malicious or not. A familiarity with process memory and code injection can help a lot with identifying the exact code that initiated or received data over the network. However, remember that some evidence of connections in memory is very short lived. Thus, being able to quickly follow up on an alert and interrogate a system’s network activity is critical.