
Chapter 17
Event Reconstruction
Reconstructing an event is a necessary step in most forensics investigations. Although you could probably pick any chapter in this book and say it facilitates correlations, triage, and so forth, extracting strings and recovering attacker command histories are two procedures that stand out as notably significant. Despite the fact that extracting strings is one of the most ancient forms of analysis, it’s still extremely powerful, especially when combined with the capability to add context (such as linking the strings with their owning process or kernel module).
This chapter shows you several ways to leverage strings to prove or disprove that certain actions took place on a system. You’ll also learn about the internals of the Windows command architecture that attackers frequently exploit to navigate the breached network, install or configure backdoors, mount shares, and so on. For example, if you use cmd.exe as an FTP client, you might find evidence that identifies the server, the attacker’s username and password, and the FTP commands—long after the actual network connections are torn down.
Strings
As introduced in Chapter 2, a string is a sequence of bytes that contains human-readable characters. Although strings can exist in various encodings, the most common ones you’ll analyze are ASCII and Unicode. They are the encodings in which the Windows application programming interfaces (APIs) expect to receive their arguments. For example, CreateFileA accepts an ASCII filename, and CreateFileW accepts a Unicode (the W suffix is for Wide) filename, so before malware or an attacker creates or opens a file, the target filename must inevitably exist in memory. If you recall what was discussed about the longevity of data in RAM, you know that these strings can persist in physical storage long after the containing pages are freed.
Extracting Strings
The first step of analyzing strings from memory dumps is to extract them, and you need to use a tool other than Volatility to initially extract the strings. Unfortunately, this adds a step to your procedure, but the existing options for extracting strings work quite well, and they’re implemented in C (which is fast). It doesn’t make sense to reinvent the wheel in a slower language such as Python just to perform all necessary steps at once with Volatility.
The main factors for determining which external tool to use for extracting strings are your analysis machine’s operating system and whether the tool can generate output in the format that Volatility requires. The acceptable formats are these:
<decimal_offset>:<string>
<decimal_offset> <string>
Volatility requires decimal offsets, followed by a colon or space and then the extracted string. The pairs of offsets and strings must be separated by newlines in a plain text file. For the most thorough results, ensure that you extract both ASCII and Unicode strings. Be aware that some of the upcoming tools get both encodings by default; while others require you to manually select them. Your options for generating strings are discussed in the following sections.
Windows
The Sysinternals strings.exe application from http://technet.microsoft.com/en-us/sysinternals/bb897439.aspx is one of the tools that gather ASCII and Unicode strings in a single pass through the target file. You can use it in the following manner (the -o option requests decimal offsets, and -q suppresses the banner):
C:UsersJakeTools> strings.exe –q –o memory.dmp > strings.txt You can also use the GNU strings command on Windows through a Cygwin (http://www.cygwin.com) shell if you have it installed on your analysis machine. The exact usage of GNU strings is shown in the next section.
Linux
Your options for extracting strings on Linux include the GNU strings command (installed by default with practically all distributions), or you can run the Sysinternals strings.exe tool under the Wine environment (http://www.winehq.org). Because you’ve already seen the Sysinternals usage, we’ll just show you the GNU commands here. Note that the GNU strings command requires two separate runs: one to gather ASCII characters and one for Unicode characters.
$ strings -td -a memory.dmp > strings.txt
$ strings -td -el -a memory.dmp >> strings.txt
In this case, the -td option specifies the decimal-based offsets, -el sets the encoding type to little-endian 16-bit characters (e.g., Unicode), and –a covers the entire file instead of only non-executable sections.
Mac OS X
Unfortunately, the default strings utility that ships with Mac OS X systems does not support Unicode characters. Thus, you can run the Sysinternals strings.exe via Wine; or you can compile your own version from the GNU binutils source code (https://www.gnu.org/software/binutils) or install it via MacPorts (http://www.macports.org).
Example Output
Regardless of which tool and operating system you use to extract strings, your output file should appear like this:
$ cat strings.txt

[snip]

470696013:!This program cannot be run in DOS mode.
470696799:`PAGESPECC
470696919:@PAGEDATAX
470697040:PAGEVRFCI4
470697079:@PAGEVRFDH
470697816:REGISTRYMACHINESYSTEMDISK
470697848:DeviceHarddisk%dPartition%d
470697880:2600.xpsp.080413-2111
470699252:_nextafter

[snip]

507653344:rundll32.exe
507653360:SoftwareMicrosoftWindowsCurrentVersionRunOnce
507653412:explorer.exe
507653428:iernonce.dll
507653444:InstallOCX: End %1
Although this information might be enough to prove that a particular string existed in RAM, the only context you have is an offset in physical memory. For example, you can’t tell whether a string is part of a valid Windows kernel module, is from a DLL injected into a process, or is lingering in freed storage. Likewise, the RunOnce registry key may be part of a legitimate registry hive or a string embedded in the read-only data section of a previously compressed executable. These are the types of issues that Volatility’s offset translation aims to solve.
Translating Strings
Given a properly formatted strings file as input, the Volatility plugin (appropriately named strings) translates the offsets in physical memory to their virtual memory addresses (if any mappings exist). By default, the plugin traverses the page tables of all processes in the active process list, including the System process, which has the kernel address space mappings. Based on these mappings, it determines which processes were able to access the specified strings. The following output shows the plugin’s usage:
$ python vol.py strings --help

[snip]

  -s STRING_FILE, --string-file=STRING_FILE
                        File output in strings format (offset:string)
  -S, --scan            Use PSScan if no offset is provided
  -o OFFSET, --offset=OFFSET
                        EPROCESS offset (in hex) in the physical address space
  -p PID, --pid=PID     Operate on these Process IDs (comma-separated)

---------------------------------
Module Strings
---------------------------------
Match physical offsets to virtual addresses (may take a while, VERY verbose)
To translate strings owned by a hidden process, you can either specify the –S option to scan for processes rather than walking the list or the –o option to indicate the physical offset of the hidden process. Either way, the only other option that you’ll need is –s for the path to your strings file. As a comment in the help menu reminds you, depending on the size of your input file (e.g., the number of strings), this plugin can take a while, and its output is also verbose. Thus, we recommend redirecting output to a file. You can also trim the input file to include only a subset of the initial strings, just to focus on mapping a few of the most interesting ones.
$ python vol.py strings –s strings.txt
          –f memory.dmp
          --profile=Win7SP0x64 > translated.txt

$ cat translated.txt

[snip]
470696013 [ntoskrnl.exe:804d704d] !This program cannot be run in DOS
470696799 [ntoskrnl.exe:804d735f] `PAGESPECC
470696919 [ntoskrnl.exe:804d73d7] @PAGEDATAX
470697040 [ntoskrnl.exe:804d7450] PAGEVRFCI4
470697079 [ntoskrnl.exe:804d7477] @PAGEVRFDH
470697816 [ntoskrnl.exe:804d7758] REGISTRYMACHINESYSTEMDISK
470697848 [ntoskrnl.exe:804d7778] DeviceHarddisk%dPartition%d
470697880 [ntoskrnl.exe:804d7798] 2600.xpsp.080413-2111
470699252 [ntoskrnl.exe:804d7cf4] _nextafter

[snip]

507653344 [1024:75261ce0] rundll32.exe
507653360 [1024:75261cf0] SoftwareMicrosoftWindowsCurrentVersionRunOnce
507653412 [1024:75261d24] explorer.exe
507653428 [1024:75261d34] iernonce.dll
507653444 [1024:75261d44] InstallOCX: End %1
The lines from your original input file now have an additional column, telling you which processes or kernel modules owned (or had references to) the strings. For example, the DOS message is found at the virtual address 0x804d704d, which tells you it is in kernel memory—in the same space occupied by the ntoskrnl.exe module. Furthermore, the RunOnce string is not in a cached registry hive—it’s at address 0x75261cf0 of the process with process ID (PID) 1024. You can then leverage dlllist to determine which DLL (if any) occupies the region containing 0x75261cf0.
String-Based Analysis
One caveat to string-based analysis is the sheer number of items you’ll find in a memory dump. Even in 512MB RAM dumps you can easily discover millions of strings. One way to minimize the noise is to increase the minimum length (-n NUMBER) for what the string extraction tools consider a valid string. Undoubtedly, there are far fewer ten-character strings than five-character strings in RAM. However, be aware that your attempts to cut down the noise may also result in missing some evidence (e.g., a four-character password).
The following sections describe a few ways to expedite your event reconstruction efforts without manually reviewing all the extracted strings. In these instances, we leverage strings more for correlation than open-ended research.
Finding Prefetch Files
As mentioned in Chapter 16, Prefetch files are created by Microsoft Windows when programs execute. In this particular case, we found evidence of an attacker downloading several single-letter executables to the suspect machine, but it wasn’t clear which of the programs, if any, were actually run. By extracting strings and translating them with Volatility, we could identify that at least five of them executed because the corresponding Prefetch filenames were found in kernel memory. Here is the command used to narrow down the string results:
$ grep ".pf" translated.txt | grep ' [A-Z].EXE'

50711138  [kernel:c15c2a62] R.EXE-19834F9B.pf-0
55875810  [kernel:c15c08e2] G.EXE-24E91AA8.pfDA
55892778  [kernel:c15c1b2a] W.EXE-0A1E603F.pf5B
122417914 [kernel:e15c22fa] G.EXE-24E91AA8.pfG.EXE-24E91AA8.PF
225133922 [kernel:e0ac4562] R.EXE-19834F9B.pf
278414074 [kernel:e106e2fa] P.EXE-04500029.pfP.EXE-04500029.PF
332995290 [kernel:e190aada] W.EXE-0A1E603F.pfW.EXE-0A1E603F.PF
404921698 [kernel:e0ac0d62] W.EXE-0A1E603F.pf
420774242 [kernel:e0ac1162] G.EXE-24E91AA8.pf
455987554 [kernel:e0ac2162] P.EXE-04500029.pf
We first searched for all occurrences of strings with a Prefetch file extension (.pf). If you didn’t already have an idea of the suspect filenames or patterns, you would stop here and review. However, in our case, we filtered the results further based on applications with only one letter in their names.
Spatial Proximity with IOCs
In many cases, you’ll receive some type of indicator before starting your analysis, whether it’s a filename, registry key, mutex, domain name, or IP address. Chances are that if you find one of the indicators, a good number of related artifacts will be nearby because strings that are adjacent in virtual memory are also adjacent in physical memory, unless they cross page boundaries. The following scenario describes how you can start with one indicator (for example, an IP address seen in the output of connections or netscan) and look at the surrounding data for additional clues.
You can do this by using the grep command with one of the following modifiers:
-A NUM: printNUMlines after a string-B NUM: printNUMlines before a string-C NUM: printNUMlines before and after a string
In this case, we wanted to print 30 strings after every occurrence of 66.32.119.38 in RAM.
$ grep -A 30 "66.32.119.38" translated.txt

361990424 [kernel:c75bf918] open 66.32.119.38
361990443 [kernel:c75bf92b] jack
361990449 [kernel:c75bf931] 2awes0me
361990459 [kernel:c75bf93b] lcd c WINDOWSSystem32systems
361990492 [kernel:c75bf95c] cd/home/jack
361990508 [kernel:c75bf96c] binary
361990516 [kernel:c75bf974] mput "*.txt"
361990530 [kernel:c75bf982] disconnect
[snip]
This query revealed many strings associated with the IP address. Whereas before you only knew that a connection was established with the remote IP, now you know it was likely involved in an FTP transaction in which files from the victim system were uploaded to the FTP server. These strings are not in process memory, and a specific kernel module does not own them. Thus, you can’t track the activity back to a particular body of code. However, because the operating system has not yet freed or overwritten the physical pages that store these strings, they’re unintentionally left behind.
Strings in Free Memory
As previously mentioned, only a subset of strings that you extract from a memory dump are being actively referenced; the rest are in freed or unallocated pages. Similar to The Sleuth Kit (www.sleuthkit.org), which provides several commands for recovering data from unallocated disk blocks (see tsk_recover, ffind, blkls), you can also focus your RAM analysis on strings in unallocated storage. After you initially extract strings from your memory dump, there will be items in unallocated storage, but they will be mixed in with items in allocated storage; thus the dispositions are ambiguous.
To distinguish between strings in allocated or unallocated storage, you need to follow through with the translation step involving Volatility’s strings plugin. Strings in unallocated storage do not have any virtual address mappings, so they’ll fail to translate, and you’ll see the FREE MEMORY indicator in place of kernel or process details. For example, the following string, which identifies the path to a DLL installed by TDL3, is in unallocated storage:
209952762 [FREE MEMORY] mciFre\?globalrootDeviceScsivmscsi1
evxtepo

evxtepo	dlwsp.dll
Based on that information, you can filter out the allocated strings and dump freed strings to a separate file. The following commands show this procedure (approximately 551K of the original 881K strings are in unallocated storage):
$ grep "FREE MEMORY" translated.txt > unallocated.txt

$ wc -l translated.txt
  881286 translated.txt

$ wc -l unallocated.txt
  551218 unallocated.txt
The advantage of this technique is that you can analyze data that other tools might miss. For example, many antivirus and Host Intrusion Prevention System (HIPS) products that run on live systems are designed to scan memory for known signatures, but they focus only on allocated memory. Even kernel mode drivers cannot access the strings in freed pages unless they directly map them (by using a similar method as RAM acquisition tools; see Chapter 4).
Detecting Shared Pages
Multiple processes can concurrently access the same physical page, which occurs for various reasons, including these:
- Shared libraries (DLLs): Every process loads system DLLs such as
kernel32.dllandntdll.dll. The executable sections of these libraries typically don’t change per process, so the physical pages are simply shared between multiple processes to conserve memory. - Shared file mappings: Similar to the previous item, except that the shared file doesn’t need to be a DLL. It can be any file with content shared among two or more processes.
- Named shared memory: Applications can also share blocks of memory that aren’t backed by files on disk. In other words, just an arbitrary set of pages that two or more processes agree to share.
The following scenario shows how you can leverage strings in shared pages during investigations. In the first case, we were presented with an infected memory dump, but we had only one piece of information to go on—a known bad URL (microsoft-REDACTED-info.com). We extracted strings and found several occurrences that looked like this:
376758331:1http://www.microsoft-REDACTED-info.com/mls/shrt4.gif
377655780:C:Documents and SettingsDefault User.WINDOWSLocal
    SettingsTemporary Internet FilesContent.IE5G9E7C5ERshrt4[2].gif
378837952:C:Documents and SettingsDefault User.WINDOWSLocal
    SettingsTemporary Internet FilesContent.IE5G9E7C5ERshrt4[2].gif
379197416:http://www.microsoft-REDACTED-info.com/mls/shrt4.gif
379197468:shrt4[2].gif
379197800:http://www.microsoft-REDACTED-info.com/mls/shrt4.gif
379197852:shrt4[2].gif
379198184:http://www.microsoft-REDACTED-info.com/mls/shrt4.gif
379198236:shrt4[2].gif
Notice that the spacial proximity concept also applies here—you can see paths to temporary Internet files (e.g., shrt4[2].gif) both above and below the malicious URL. The next step was to figure out which process or kernel driver was responsible for making the outbound connections. To do this, we translated the strings with Volatility. The results are shown in the following command:
$ python vol.py -f case24888.dmp --profile=Win2003SP2x86
   strings -s strings.txt

[snip]

1674e03b [1140:1000603b] 1http://www.microsoft-REDACTED-info.com/mls/shrt4.gif
168291e4 [1140:00ece1e4] C:Documents and SettingsDefault
    User.WINDOWSLocal SettingsTemporary Internet
    FilesContent.IE5G9E7C5ERshrt4[2].gif
16949bc0 [1140:00ecdbc0] C:Documents and SettingsDefault
    User.WINDOWSLocal SettingsTemporary Internet
    FilesContent.IE5G9E7C5ERshrt4[2].gif
169a17e8 [1140:00f267e8 980:046a67e8]
    http://www.microsoft-REDACTED-info.com/mls/shrt4.gif
169a181c [1140:00c26f081c 980:046a681c] shrt4[2].gif
169a1968 [1140:00f26968 980:046a6968]
    http://www.microsoft-REDACTED-info.com/mls/shrt4.gif
169a199c [1140:00c26f099c 980:046a699c] shrt4[2].gif
169a1ae8 [1140:00f26ae8 980:046a6ae8]
    http://www.microsoft-REDACTED-info.com/mls/shrt4.gif
169a1b1c [1140:00f26b1c 980:046a6b1c] shrt4[2].gif
The first three strings are found only in the memory of the process with PID 1140. The rest are found in both 1140 and 980. When processes share the same page, Volatility includes multiple PID:ADDRESS pairs inside the brackets. You might jump to conclusions at this point and think that both processes are infected with the same malware, but that is false. To find out why, first determine which two processes you’re dealing with:
$ python vol.py -f case24888.dmp --profile=Win2003SP2x86
    pslist -p 1140,980

Volatility Foundation Volatility Framework 2.4
Offset(V)  Name            PID   PPID   Thds   Hnds  Start
---------- ------------- ------ ------ ------ -----  --------------------------
0x898b74e8 svchost.exe    980    540     60  1980   2010-10-13 19:55:38 UTC+0000
0x89841d88 spoolsv.exe   1140    540     13   218   2010-10-13 19:55:44 UTC+0000
The two process names are svchost.exe (980) and spoolsv.exe (1140). The very first string shown was found at virtual address 0x1000603b in the memory of spoolsv.exe. For more details about that address, do a reverse lookup and determine whether there are any DLLs occupying that space. As shown in the following output, winpugtr.dll starts at 0x10000000 and spans to 0x1000a000, which fully encapsulates the address of the first string:
$ python vol.py -f case24888.dmp --profile=Win2003SP2x86 dlllist -p 1140
Volatility Foundation Volatility Framework 2.4
************************************************************************
spoolsv.exe pid:   1140
Command line : C:WINDOWSsystem32spoolsv.exe
Service Pack 2

Base             Size  LoadCount Path
---------- ---------- ---------- ----
[snip]
0x10000000     0xa000        0x1 C:WINDOWSsystem32winpugtr.dll
[snip]
Now that you know specifically which DLL contains the string, you can dump it from memory and confirm, as shown here:
$ python vol.py -f case24888.dmp --profile=Win2003SP2x86
    dlldump -p 1140 -b 0x10000000 -D OUTDIR

Volatility Foundation Volatility Framework 2.4
Process(V) Name                 Module Base Module Name          Result
---------- -------------------- ----------- -------------------- ------
0x89841d88 spoolsv.exe          0x010000000 winpugtr.dll         OK:
  module.1140.9841d88.10000000.dll

$ strings -a OUTDIR/module.1140.9841d88.10000000.dll
[snip]
GetProcAddress
LoadLibraryA
winpugtr.dll
ServiceMain
1http://www.microsoft-REDACTED-info.com/mls/shrt4.gif
Google Adv
VS_VERSION_INFO
[snip]
The evidence shown so far was enough for us to conclusively determine that spoolsv.exe PID 1104 was hosting a malicious (potentially injected) DLL. But what about PID 980? It also has references to the same URL that exists in pages shared between the two processes. Is PID 980 also hosting injected code? Take a close look at the virtual addresses for the shared pages in PID 1104 and you’ll see that they’re all in the range 0x00f26XXX. In PID 980, they’re all in the range 0x046a6XXX. No DLLs occupied the ranges in either process, so we moved on to other types of analyses, such as pulling cached Internet history records. The output of the iehistory plugin for PID 980 follows:
$ python vol.py -f case24888.dmp --profile=Win2003SP2x86
      iehistory -p 1140,980

[snip]

**************************************************
Process: 980 svchost.exe
Cache type "URL " at 0x46a6780
Record length: 0x180
Location: http://www.microsoft-REDACTED-info.com/mls/shrt4.gif
Last modified: 2010-07-14 01:05:16 UTC+0000
Last accessed: 2010-09-21 03:03:10 UTC+0000
File Offset: 0x180, Data Offset: 0x9c, Data Length: 0xac
File: shrt4[2].gif
Data: HTTP/1.1 200 OK^M
ETag: "1c8428-5ac-48b4c94e024eb00"^M
Content-Length: 1452^M
Content-Type: image/gif^M
^M
~U:system^M

**************************************************
Process: 980 svchost.exe
Cache type "URL " at 0x46a6900
Record length: 0x180
Location: http://www.microsoft-REDACTED-info.com/mls/shrt4.gif
Last modified: 2010-07-14 01:05:16 UTC+0000
Last accessed: 2010-10-23 20:25:29 UTC+0000
File Offset: 0x180, Data Offset: 0x9c, Data Length: 0xac
File: shrt4[2].gif
Data: HTTP/1.1 200 OK^M
ETag: "1c8428-5ac-48b4c94e024eb00"^M
Content-Length: 1452^M
Content-Type: image/gif^M
^M
~U:system^M
This process’ references to the malicious URL are in the range 0x046a6XXX because that’s where its view of the cached IE history file (index.dat) is mapped. This does not mean that PID 980 initiated, or was in any way involved with, the download of shrt4.gif from www.microsoft-REDACTED-info.com. All it means is that both processes map the history file in a way that allows content sharing. The mapping is configured automatically by wininet.dll when it’s loaded into a process.
To summarize what you learned, consider the reasons why processes share memory before drawing conclusions. If multiple processes access a physical page that contains evidence, that doesn’t automatically mean that all processes are infected or that they’re even aware of the suspect data. On a similar note, antivirus products often leave traces of their signature databases or even URL blacklists in various processes. This can make it appear as if those processes are hosting injected code; while in fact, they’re completely benign.
Command History
Unlike the bash shell on UNIX systems, Microsoft’s command shell (cmd.exe) does not have the capability to log commands to a history file. The lack of such evidence has traditionally made it difficult, if not impossible, to analyze unauthorized users’ activities based on their command shell usage. However, as you’ll soon see, the command architecture on Windows involves more than just cmd.exe, and there is most definitely a mechanism (based entirely in memory) to store and retrieve commands entered into the shell. Figuring out how to locate this data and leverage it in your forensic investigations is the focus of this section.
Windows Command Architecture
cmd.exe is a console application (a non-GUI application that runs on the desktop). It still needs to engage in GUI activities, however, such as minimizing its window size, responding to copy-and-paste requests, and scrolling through the screen buffer. Prior to Windows 7, the csrss.exe process, which runs with SYSTEM privileges, brokered all this necessary GUI functionality. However, the model exposed csrss.exe to rogue window messages that applications with lesser privileges send (see “Malicious Window Abuse” in Chapter 14). Starting with Windows 7, Microsoft introduced the console host process (conhost.exe), which assumes the same responsibilities that csrss.exe once held for the command architecture, but it runs with the permissions of the user who started the command shell.
The takeaway from the previous discussion is that commands entered into by cmd.exe are processed by csrss.exe or conhost.exe, depending on the target platform. In other words, cmd.exe is really just the client in a client-server architecture. Thus, even if an attacker closes the command shell and cmd.exe exits, there’s a good chance that you can find commands the client executed by looking in the server’s memory. As previously mentioned, the server was csrss.exe before Windows 7, which is always active while the computer is powered on. Thus, commands are preserved quite well. In fact, the server doesn’t just proxy data for the client; it actually maintains the client’s history buffer and a copy of the current screen contents (e.g., everything displayed in the cmd.exe console).
Console Modules and Functions
Prior to Windows 7, although csrss.exe facilitated the server side of the command architecture, it was actually winsrv.dll running inside CSRSS that implemented the recordkeeping. A majority of that code was simply moved to conhost.exe in the more recent versions of Windows. In these modules, you can find various undocumented (and non-exported) functions that can help you understand how evidence of attacker commands is derived from memory. Here are a few of the most relevant functions:
SrvAllocConsole: Creates a new console. Each console can have multiple screens, command histories, and aliases.AllocateCommandHistory: Creates a new command history buffer. Each buffer contains commands entered into the shell, up to a specified maximum number.AddCommand: Adds a new command to the history buffer. By default, this function usesFindMatchingCommandandRemoveCommandto avoid storing duplicates of the same command.FindCommandHistory: Given a process handle, this function iterates through the console’s list of command histories until it finds the one for the desired process.SrvAddConsoleAlias: Adds a command alias to the console.
Data Structure Map
The diagram in Figure 17-1 illustrates the major structures involved in maintaining command histories in memory. Before Windows 7, a global variable named _ConsoleHandles in the winsrv.dll module pointed to an array of _CONSOLE_INFORMATION structures. Nowadays, the symbol is _gConsoleInformation in conhost.exe. The console information contains members that lead you to a doubly linked list of history buffers (_COMMAND_HISTORY) and a pointer to a singly linked list of screens (_SCREEN_INFORMATION).
Each history buffer has a bucket of commands (_COMMAND), one for each of the commands typed into the shell, up to the specified maximum size of the buffer. The screens contain a list of _ROW structures, in which the number of rows is equal to the console window’s height, and the number of characters in each row is equal to its width. As shown in Figure 17-1, if you traverse the data structures and focus on the _COMMAND_HISTORY, that’s how you recover the basic commands. However, if you focus on the _SCREEN_INFORMATION, you’ll find the entire screen contents, which includes both input and output.

Figure 17-1: A diagram of the critical structures involved in maintaining consoles and command histories
Now that you’ve seen the high-level relationship between the relevant structures, here’s a listing of their members (for a 64-bit Windows 7 system):
>>> dt(“_CONSOLE_INFORMATION”)
‘_CONSOLE_INFORMATION’
0x28  : ProcessList            [‘_LIST_ENTRY’]
0xe0  : CurrentScreenBuffer    [‘pointer’, [‘_SCREEN_INFORMATION’]]
0xe8  : ScreenBuffer           [‘pointer’, [‘_SCREEN_INFORMATION’]]
0x148 : HistoryList            [‘_LIST_ENTRY’]
0x158 : ExeAliasList           [‘_LIST_ENTRY’]
0x168 : HistoryBufferCount     [‘unsigned short’]
0x16a : HistoryBufferMax       [‘unsigned short’]
0x16c : CommandHistorySize     [‘unsigned short’]
0x170 : OriginalTitle          [‘pointer’, [‘String’, {‘length’: 256,
 ‘encoding’: ‘utf16’}]]
0x178 : Title                  [‘pointer’, [‘String’, {‘length’: 256,
 ‘encoding’: ‘utf16’}]]
>>> dt(“_SCREEN_INFORMATION”)
‘_SCREEN_INFORMATION’
0x8   : ScreenX       [‘short’]
0xa   : ScreenY       [‘short’]
0x48  : Rows          [‘pointer’, [‘array’, lambda x: x.ScreenY, [‘_ROW’]]]
0x128 : Next          [‘pointer’, [‘_SCREEN_INFORMATION’]]

>>> dt(“_ROW”)
‘_ROW’
0x8   : Chars    [‘pointer’, [‘String’, {‘length’: 256, ‘encoding’: ‘utf16’}]]

>>> dt(“_COMMAND_HISTORY”)
‘_COMMAND_HISTORY’
0x0   : ListEntry         [‘_LIST_ENTRY’]
0x10  : Flags             [‘Flags’, {‘bitmap’: {‘Reset’: 1, ‘Allocated’: 0}}]
0x18  : Application       [‘pointer’, [‘String’, {‘length’: 256,
 ‘encoding’: ‘utf16’}]]
0x20  : CommandCount      [‘short’]
0x22  : LastAdded         [‘short’]
0x24  : LastDisplayed     [‘short’]
0x26  : FirstCommand      [‘short’]
0x28  : CommandCountMax   [‘short’]
0x30  : ProcessHandle     [‘address’]
0x38  : PopupList         [‘_LIST_ENTRY’]
0x48  : CommandBucket     [‘array’, lambda x: x.CommandCount, [‘pointer’,
 [‘_COMMAND’]]]

>>> dt(“_COMMAND”)
‘_COMMAND’
0x0   : CmdLength   [‘unsigned short’]
0x2   : Cmd         [‘String’, {‘length’: lambda x: x.CmdLength,
 ‘encoding’: ‘utf16’}]
Key Points
The key points for _CONSOLE_INFORMATION are these:
ProcessList: A doubly linked list of_CONSOLE_PROCESSstructures—one for each of the processes attached to the console. You can attach multiple processes to the same console, usually as a result of inheritance from a parent process or by duplicating another process' console handle (see theAttachConsoleAPI).CurrentScreenBufferandScreenBuffer: You can have multiple screen buffers within the same console.ScreenBufferpoints to a singly-linked list of all available screens.CurrentScreenBufferpoints to the screen that’s currently displayed.HistoryList: A doubly linked list of_COMMAND_HISTORYstructures.ExeAliasList: A doubly linked list of all executable aliases that have been added to the console.HistoryBufferCount: The current number of command history structures in theHistoryList.HistoryBufferMax: The maximum number of command history structures that theHistoryListsupports. The default is 4.CommandHistorySize: The size of the command history. In other words, this is the maximum number of commands that you can save in_COMMAND_HISTORYbefore they start wrapping and overwriting older entries. The default is 50.Title: The title for the console window. For example, in many cases, this is just the path tocmd.exebecause that’s what you see in the top-left corner of the console window. However, when you launch commands from the console, the title changes to the new command (including any arguments you passed).
The key points for _SCREEN_INFORMATION are these:
ScreenX: This is the width, in characters, of the lines the console displays. The default is 80.ScreenY: The height of the screen buffer (i.e., number of rows it supports). The default is 300.Rows: Points to an array of_ROWstructures, which store the actual content displayed within the screen buffer. The size of the array is equal toScreenY.Next: A singly linked list that connects the various screen buffers in a console.
The key points for _COMMAND_HISTORY are these:
ListEntry: A doubly linked list that connects all command history structures if more than one exists.Flags: When a command history structure is marked for deletion, the contained commands aren’t immediately overwritten. Instead, thisFlagsmember is just set toReset.Application: The Unicode name of the application connected to the console.CommandCount: The current size of the history buffer.CommandCountMax: The maximum size of the history buffer. The default is 50, and should match_CONSOLE_INFORMATION.CommandHistorySize. After this size is reached, the oldest commands begin getting overwritten.ProcessHandle: This member identifies the process attached to the console. AlthoughApplicationis just the process' short name, there might be multiple processes with the same name. Thus, thisProcessHandlepoints to a_CSR_PROCESS(not shown) from which you can derive the_EPROCESSaddress.CommandBucket: This bucket (or array) containsCommandCountnumber of_COMMANDstructures—one for each of the commands a user has typed into the shell.
Default Settings
Many of the console window default settings play a key role in how Volatility finds the command history contents in memory. Thus, you should know where the default settings are stored and how they can be overridden. As shown in Figure 17-2, the HKEY_CURRENT_USERConsole registry key is the authoritative source of most settings. In particular, the HistoryBufferSize and NumberOfHistoryBuffers values map directly to the CommandHistorySize and HistoryBufferMax members of the _CONSOLE_INFORMATION structure, respectively. Volatility scans memory for these values to identify potential console information structures.
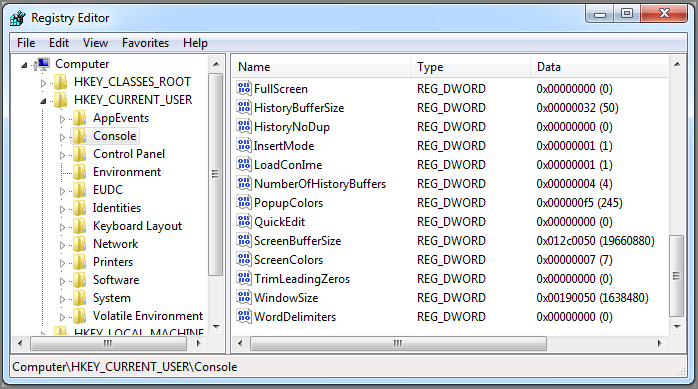
Figure 17-2: The default command history settings are stored in each user’s HKCUConsole key.
On most Windows systems, the default number of history buffers is 4, and the maximum number of commands they can each hold is 50. A user can change the default settings in two ways. First, they can simply reset the corresponding registry values. In this case, you can use Volatility’s registry API (see Chapter 10) to query the modified settings. Keep in mind that these settings are under HKEY_CURRENT_USER, so they’re per-user values. Second, users can change the settings on a per-console level, as shown in Figure 17-3. You can get to the edit controls by clicking the Properties ⇒ Options ⇒ Layout in the cmd.exe window.

Figure 17-3: You can change the default settings per-console by inspecting the cmd.exe window properties.
The machine’s defaults from the registry are also displayed in these windows. When you make changes, you can decide to apply them to the single console or for all future consoles for the respective user. In the latter case, the settings are saved to the registry. Thus, if a user changes settings for only a single console, in which case the new values are not saved to the registry, it’s much more difficult for you to determine the new values. Ultimately, it might affect your ability to retrieve the commands from memory.
Finding Commands in Memory
Now that you’re familiar with the command architecture, relevant data structures, and default settings, we’ll describe how to find the evidence in memory. You can also read the original paper, Extracting Windows Command Line Details from Physical Memory by Richard M. Stevens and Eoghan Casey here: http://www.dfrws.org/2010/proceedings/2010-307.pdf. Volatility’s current capabilities are based on their initial findings; in particular, they scanned the memory of csrss.exe for the default command history size (50) and treated each hit as a potential _COMMAND_HISTORY.CommandCountMax member. They then performed a series of sanity checks on the surrounding members of the command history structure to eliminate false positives. Because the scanner is based on a default value that can be changed, you can understand why the prior discussion about default values is so important.
CmdScan Plugin
This plugin most closely resembles the original plugin by Stevens and Casey. It finds all instances of the default command history size value (50) in pages of memory owned by csrss.exe or conhost.exe, and then performs sanity checks to properly identify _COMMAND_HISTORY structures. It cycles through the CommandBucket array, attempting to find entries that contain valid commands. In some cases, especially when the client cmd.exe terminates, the CommandCount might not be reliable. Thus, even when CommandCount is zero, indicating no commands in the bucket, this plugin brute forces its way through all possible slots, from zero to CommandCountMax. It can often identify commands that were issued in the past.
In the following output, two csrss.exe processes (PID 484 and 7888) are running on the suspect 2003 Server machine. An application named CNTAoSMgr.exe, which is a component of Trend Micro OfficeScan, has an available command history, but it has never been used. The CommandCount and FirstCommand values are zero, and the LastAdded and LastDisplayed members are -1. This is what you would expect to see if a command shell is opened, but not engaged.
$ python vol.py -f iis_server.mem --profile=Win2003SP2x86 cmdscan
Volatility Foundation Volatility Framework 2.4
**************************************************
CommandProcess: csrss.exe Pid: 484
CommandHistory: 0x4e4ed8 Application: CNTAoSMgr.exe Flags: Allocated
CommandCount: 0 LastAdded: -1 LastDisplayed: -1
FirstCommand: 0 CommandCountMax: 50
ProcessHandle: 0xf24
**************************************************
CommandProcess: csrss.exe Pid: 7888
CommandHistory: 0x4c2c30 Application: cmd.exe Flags: Allocated
CommandCount: 12 LastAdded: 11 LastDisplayed: 11
FirstCommand: 0 CommandCountMax: 50
ProcessHandle: 0x25c
Cmd #0 @ 0x4c1f90: d:
Cmd #1 @ 0xf41280: cd inetlogs
Cmd #2 @ 0xf412e8: cd w*46
Cmd #3 @ 0xf41340: type ex<REDACTED>.log | find "<REDACTED>.jpg" | find "GET"
Cmd #4 @ 0xf41b10: c:
Cmd #5 @ 0xf412a0: cdwindowssystem32<REDACTED>sample
Cmd #6 @ 0xf41b20: ftp <REDACTED>.com
Cmd #7 @ 0xf41948: notepad ex<REDACTED>.log
Cmd #8 @ 0x4c2388: notepad ex<REDACTED>.log
Cmd #9 @ 0xf43e70: ftp <REDACTED>.com
Cmd #10 @ 0xf43fb0: dir
Cmd #11 @ 0xf41550: notepad ex<REDACTED>.log
The other CSRSS process (PID 7888) is hosting a command history for cmd.exe, which looks more interesting. This history buffer currently contains 12 commands. As with all arrays in C, they have a 0-based index, so the most recently entered command, number 11, is both the last added and last displayed. You can then see the full command that the attacker entered, minus some redacted fields to hide the victim’s identity. In this case, an attacker gained access to an IIS server, opened a command shell, and began navigating through the web access logs. In particular, the attacker searched for GET requests to a specific file with a JPEG extension and then uploaded several of the log files to an FTP server. It’s possible the attacker was trying to collect IP addresses of systems that accessed a phishing URL.
Consoles Plugin
It wasn’t until several years after Stevens and Casey’s original research that we realized how much evidence was still available in the memory of csrss.exe and conhost.exe. Recovering the attacker’s commands really shows only one side of the picture. It’s critical to know whether the commands succeeded; and if so, the exact data that the victim system divulged to the attacker. This is the advantage of the consoles plugin. Rather than scanning for the command history structures such as cmdscan, it looks for the console information (_CONSOLE_INFORMATION). In doing so, it has access to the screen buffers that contain all lines of input and output that fit within the current width and height of the console window.
As shown in the following command, the consoles plugin can be very verbose and it will help you understand the attacker’s actions much better. It starts out by displaying the command history, but then dumps the entire screen buffer. Notice that the Y coordinate for the buffer (its height) was increased to 3000 from the default of 300. Thus, the attacker’s adjustments caused the shell to retain 100 times more evidence than it would normally save!
$ python vol.py -f iis_server.mem --profile=Win2003SP2x86 consoles
Volatility Foundation Volatility Framework 2.4

[snip]

**************************************************
ConsoleProcess: csrss.exe Pid: 7888
Console: 0x4c2404 CommandHistorySize: 50
HistoryBufferCount: 4 HistoryBufferMax: 4
OriginalTitle: Command Prompt
Title: Command Prompt
AttachedProcess: cmd.exe Pid: 5544 Handle: 0x25c
----
CommandHistory: 0x4c2c30 Application: cmd.exe Flags: Allocated, Reset
CommandCount: 12 LastAdded: 11 LastDisplayed: 11
FirstCommand: 0 CommandCountMax: 50
ProcessHandle: 0x25c
Cmd #0 at 0x4c1f90: d:
Cmd #1 at 0xf41280: cd inetlogs
Cmd #2 at 0xf412e8: cd w*46
Cmd #3 at 0xf41340: type <REDACTED>.log | find "<REDACTED>.jpg" | find "GET"
Cmd #4 at 0xf41b10: c:
Cmd #5 at 0xf412a0: cdwindowssystem32<REDACTED>sample
Cmd #6 at 0xf41b20: ftp <REDACTED>.com
Cmd #7 at 0xf41948: notepad <REDACTED>.log
Cmd #8 at 0x4c2388: notepad <REDACTED>.log
Cmd #9 at 0xf43e70: ftp <REDACTED>.com
Cmd #10 at 0xf43fb0: dir
Cmd #11 at 0xf41550: notepad <REDACTED>.log
----
Screen 0x4c2b10 X:80 Y:3000
Dump:
Microsoft Windows [Version 5.2.3790]
(C) Copyright 1985-2003 Microsoft Corp.

C:Documents and SettingsAdministrator.<REDACTED>>d:

D:>cd inetlogs
D:inetlogs>cd w*46

D:inetlogs<REDACTED>>type <REDACTED>.log | find "<REDACTED>.jpg" | find "GET"
2012-05-23 02:51:19 W3SVC481486246 X.X.83.22 GET <REDACTED>.jpg - 80 –
    X.X.110.161
Mozilla/4.0+(compatible;+MSIE+7.0;+Windows+NT+5.
1;+Trident/4.0) 200 0 0

D:inetlogs<REDACTED>>c:

C:Documents and SettingsAdministrator.<REDACTED>>cdwindowssystem32
    <REDACTED>sample

C:WINDOWSsystem32oobesample>ftp <REDACTED>.com
Connected to <REDACTED>.com.
220 Microsoft FTP Service
User (<REDACTED>.com:(none)): <REDACTED>
331 Password required for <REDACTED>.
Password:
230 User <REDACTED> logged in.
ftp> cd statistics
250 CWD command successful.
ftp> cd logs
250 CWD command successful.
ftp> dir
200 PORT command successful.
150 Opening ASCII mode data connection for /bin/ls.
05-22-12  09:34AM       <DIR>          W3SVC31122
226 Transfer complete.
ftp: 51 bytes received in 0.00Seconds 51000.00Kbytes/sec.
ftp> cd W3SVC31122
250 CWD command successful.
ftp> dir
200 PORT command successful.
150 Opening ASCII mode data connection for /bin/ls.
05-22-12  06:59PM             24686680 <REDACTED>.log
05-22-12  07:00PM              3272096 <REDACTED>.log
226 Transfer complete.
ftp: 106 bytes received in 0.06Seconds 1.68Kbytes/sec.
ftp> get <REDACTED>.log
200 PORT command successful.
150 Opening ASCII mode data connection for <REDACTED>.log(3272096 bytes).
226 Transfer complete.
ftp: 3272096 bytes received in 7.47Seconds 438.09Kbytes/sec.
ftp> get for /bin/ls.
200 PORT command successful.
550 for: The system cannot find the file specified.
ftp> ge <REDACTED>.log
200 PORT command successful.
150 Opening ASCII mode data connection for <REDACTED>.log(24686680 bytes).
226 Transfer complete.
ftp: 24686680 bytes received in 46.39Seconds 532.13Kbytes/sec.
ftp> bye

C:WINDOWSsystem32<REDACTED>sample>notepad <REDACTED>.log

C:WINDOWSsystem32<REDACTED>sample>dir
 Volume in drive C has no label.
 Volume Serial Number is AC20-A7D1

 Directory of C:WINDOWSsystem32<REDACTED>sample

05/22/2012  09:18 PM    <DIR>          .
05/22/2012  09:18 PM    <DIR>          ..
02/28/2012  08:30 AM                 0 <REDACTED>.att
02/28/2012  08:30 AM               341 <REDACTED>.bdy
02/28/2012  08:30 AM               474 <REDACTED>.epj
02/28/2012  08:30 AM                 0 <REDACTED>.fad
02/28/2012  08:27 AM               100 <REDACTED>.txt
02/28/2012  08:30 AM                 0 <REDACTED>.vad
08/03/2011  06:48 AM               323 <REDACTED>.vbs
02/28/2012  08:05 AM           501,760 <REDACTED>.hlp
05/22/2012  09:18 PM        44,184,520 <REDACTED>.log
05/22/2012  09:10 PM        24,686,680 <REDACTED>.log
05/22/2012  09:09 PM         3,272,096 <REDACTED>.log
05/21/2012  01:25 AM            28,672 JpgCommand.exe
08/03/2011  06:49 AM             4,608 <REDACTED>.exe
01/20/2012  09:07 AM            57,344 <REDACTED>.hlp
              14 File(s)     72,736,918 bytes
               2 Dir(s)  39,034,490,880 bytes free
Whereas the previous cmdscan output showed the attacker changing into a directory named windowssystem32<REDACTED>sample, you wouldn’t know the significance to that directory without the console plugin. Of course, you could pull Master File Table (MFT) records from memory and triage them, but that isn’t necessary in this case. Because the attacker typed dir to list the directory contents, the screen buffer shows the exact filenames, sizes, and timestamps that the attacker saw. Furthermore, you can see the results of the attacker’s find command when he searched through the access logs as well as the exact commands issued during the FTP transaction.
Summary
One of the most important stages of a digital investigation is event reconstruction. During this stage, you leverage the collected artifacts to develop hypotheses about what events occurred on the system. Extracted strings and command histories often provide valuable insight into what the malware or suspect was trying to accomplish. It enables an investigator to correlate digital events with physical events and provide context into why certain digital artifacts were created.