
Chapter 13
Kernel Forensics and Rootkits
So far in this book, you’ve learned a lot about artifacts that exist in kernel memory, such as file objects, network structures, and cached registry hives. We even covered topics such as hiding processes by directly modifying kernel objects. However, you haven’t learned how to actually track down malware that runs in kernel mode by loading a driver. Furthermore, once running in the kernel, a rootkit has countless ways to evade detection and persist on a system by manipulating call tables, hooking functions, and overwriting metadata structures.
This chapter shows you how memory forensics can help you detect high-profile rootkits such as ZeroAccess, Tigger, Blackenergy, and Stuxnet. You’ll also get some experience with combining Volatility with IDA Pro for in-depth static analysis of malicious kernel modules.
Kernel Modules
The diagram shown in Figure 13-1 displays, at a high level, some of the concepts covered in this chapter. When you’re performing kernel memory forensics, you’re often hunting down a malicious kernel module—and there are many ways to do that. As shown in the diagram, the kernel debugger data block has a member named PsLoadedModuleList that points to a doubly linked list of KLDR_DATA_TABLE_ENTRY structures. These contain metadata about each kernel module, such as where to find its base address (i.e., the start of the PE file), the size of the module, and the full path to the module’s file on disk. APIs on the live system, and consequently any forensic tools that rely on those APIs, enumerate modules by walking this list. Thus, rootkits can hide their presence by unlinking an entry. In the diagram, the entry in the middle has been unlinked.
Despite the fact that an entry has been unlinked, the metadata structure is still intact (i.e., not zeroed out). Thus, it’s possible to find the structure(s) by using a pool-scanning approach (see Chapter 5). In particular, the metadata structures exist in pools tagged with MmLd, which is how the Volatility modscan plugin finds them. Moving on to a slightly more thorough rootkit, assume that the metadata structure is unlinked and then overwritten with all zeros, including the pool tag. In this case, neither list walking nor pool tag scanning can identify the hidden module. But don’t worry—only the metadata is targeted here. The actual data (i.e., the portable executable [PE] file and all its functions) is still accessible.
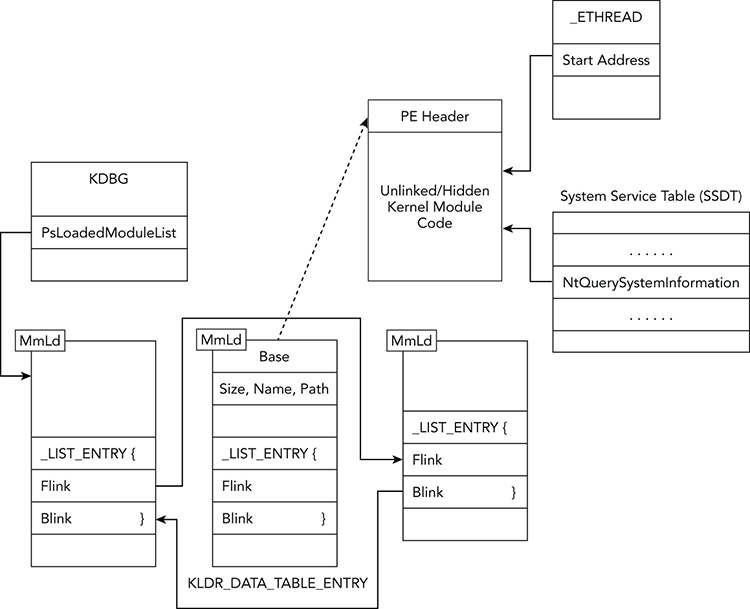
Figure 13-1: A high-level overview of some of the artifacts in kernel memory that can help you find malicious modules
If you encounter a rootkit that hides in the aforementioned ways, you can still perform a brute force scan through kernel memory looking for PE headers (e.g., the MZ signature). Specifically, look for instances in which the base address is not represented in the linked list of modules, which is a strong indicator that the PE file you found is hidden. Unfortunately, this technique doesn’t help you recover the full path on disk to the module, but at least you can extract it from memory and perform static analysis of the binary.
Now consider an even stealthier rootkit that also wipes out its PE header (and the MZ signature). Once loaded into memory, these values are nonessential and can easily be corrupted for anti-forensics. One comforting fact that you can rely on, however, is that the malicious kernel module’s code must remain in memory in order for the rootkit to function. In other words, no matter how many ways it hides, it still must retain some presence, which is the weakness that you can exploit for detection.
For example, if the module wants to monitor API calls, it hooks the System Service Dispatch Table (SSDT), described later in the chapter, or patches another module’s code section with instructions that redirect control to the rootkit function. If it wants to communicate with processes in user mode, it needs a driver object (see the driverscan plugin) and one or more devices (the devicetree plugin). At any point, if the module launches additional threads to carry out tasks concurrently, it results in the creation of a new thread object that has a starting address pointing directly at the module’s code.
In this chapter, you’ll see how to leverage these indirect artifacts to locate and extract the malicious kernel module’s code, regardless of how it hides.
Classifying Modules
A typical Windows system has hundreds of kernel modules, so identifying the malicious one(s) can require a good amount of effort. As you read through this chapter, keep the following questions in mind. They will help you determine which modules to focus on during an investigation:
- Is it unlinked or hidden? With the exception of some antivirus products that try to hide from malware, there’s no legitimate reason to unlink a module’s metadata structure.
- Does it handle any interrupts? Although third-party kernel modules can register their own interrupt handlers, the NT module (
ntoskrnl.exe,ntkrnlpa.exe, etc.) should always be the handler of critical interrupts such as the page fault, breakpoint trap, and system service dispatcher. You can check these with the Volatilityidtplugin. - Does it provide any system APIs? When user mode applications call system APIs, the address of the API in kernel memory is resolved using a table of pointers called the SSDT. An adversary can overwrite these pointers, except in some cases on 64-bit platforms with Patchguard enabled. Typically, the only modules that should be involved are the NT module, the Windows graphical user interface (GUI) subsystem module (
win32k.sys), the IIS support driver (spud.sys), and some antivirus products. - Is the driver signed? On 64-bit systems, all kernel modules need to be signed. You should check that the signer is legitimate, the certificate hasn’t expired, and so on. You’ll need the corresponding kernel module files from disk to verify the signatures, however, due to the changes that occur when loading modules into memory.
- Are the names and paths valid? Sometimes a very simple indicator, such as the module’s name or full path on disk, can reveal suspicious behaviors. For example, Stuxnet used hard-coded names such as
MRxNet.sys, and Blackenergy loaded a module whose name was entirely composed of hex characters (e.g.,000000BD8.sys). It’s also a good idea to make sure that modules aren’t loaded from temporary paths. - Does it install any callbacks? As you’ll see later in the chapter, callbacks provide a mechanism to receive notification when particular events occur, such as when new processes start or a crash dump is about to be created. You’ll want to be aware of which callbacks, if any, a particular module has registered.
- Does it create any devices? Devices often have a name, which means you can use them for indicators of compromise (provided that they’re not randomly generated). You’ll also want to see whether a driver’s devices are acting as a filter by attaching to the keyboard, network, or file system driver stacks.
- Are there any known signatures? Last but not least, brute force code content checks can be very useful. Extract a module from memory, or all of them for that matter, and scan them with antivirus signatures or Yara rules.
How Modules Are Loaded
The simple act of loading a kernel module results in the creation of various artifacts in memory. However, the exact evidence depends on the technique used. Here is a short description of the possible methods and some of the traces you can expect to find:
- Service Control Manager (SCM): Microsoft’s recommended way to load kernel modules is to create a service (
CreateService) of typeSERVICE_KERNEL_DRIVERand then start the service (StartService). As described in Chapter 12, these APIs automatically create a subkey in the registry underCurrentControlSetservicesnamed according to the new service. This method also generates event log messages if auditing is enabled. Furthermore, a new service record structure is created in the memory ofservices.exe(see thesvcscanplugin). It’s possible to unload the driver by simply stopping the service. - NtLoadDriver: Chapter 12 described a malware sample that bypassed some of the forensic artifacts that the SCM method left. Although the registry keys are still required, if you directly call
NtLoadDriver(instead ofCreateServiceandStartService), the event log messages are not emitted, andservices.exeis not notified of the activity. You can still easily unload the module by callingNtUnloadDriver. - NtSetSystemInformation: A slightly stealthier method of loading modules involves calling this API with the
SystemLoadAndCallImageclass (see http://www.shmoo.com/mail/bugtraq/aug00/msg00404.shtml). Although this is the only method that does not require registry entries, after you load a module in this manner there is no easy way to unload it—short of rebooting the machine.
Now that you’ve seen the APIs required for each of these methods, you can recognize them when analyzing an application’s imported function calls.
Enumerating Modules on Live Systems
It’s important to become familiar with the ways in which live tools enumerate kernel modules to understand how they’re often subverted. A list of the available resources follows:
- Process Explorer: If you click the
Systemprocess and choose View ⇒ Lower Pane View ⇒ DLLs, you’ll see the list of currently loaded kernel modules. Figure 13-2 shows an image of the way it appears.
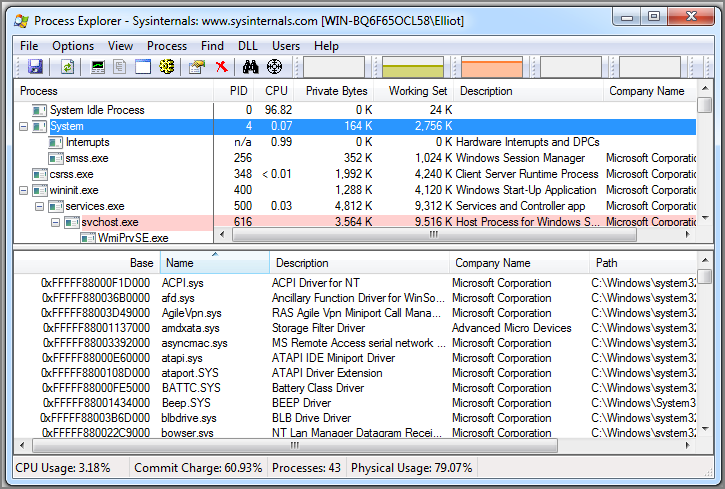
Figure 13-2: Process Explorer can show loaded kernel modules in the lower pane when you select the System process.
- Windows API: The
EnumDeviceDriversfunction (seeK32EnumDeviceDrivers) can retrieve the load address for each kernel module. Internally, these helper APIs callNtQuerySystemInformation. - Windows Management Instrumentation (WMI): You can use the
Win32_SystemDriverclass to enumerate system drivers. Note that this class is derived fromWin32_BaseService, so it actually consults the registry (notNtQuerySystemInformation) for the subset of installed services that load kernel modules. - Nirsoft: The DriverView GUI application (http://www.nirsoft.net/utils/driverview.html) shows a list of loaded modules generated by calling
NtQuerySystemInformation. - Native API: C or C++ programs can directly call
NtQuerySystemInformationwith theSystemModuleInformationclass to retrieve the list of loaded kernel modules. This API, upon which so many other tools rely, references the doubly linked list ofKLDR_DATA_TABLE_ENTRYstructures described in Figure 13-1.
In short, with the exception of WMI, all the described methods directly or indirectly call the native API NtQuerySystemInformation. In other words, simply unlinking a metadata structure or installing an API hook is powerful enough to hide from the majority of system administration tools. It is also possible to hide from WMI by deleting the required registry keys after loading a module or by using NtSetSystemInformation to initially load the module.
Modules in Memory Dumps
Volatility is well equipped to find, report on, and extract kernel modules from memory. Here’s a list of the plugins that you’ll use most frequently for these types of actions:
modules: This plugin walks the doubly linked list of metadata structures pointed to byPsLoadedModuleList. Because newly loaded modules are always added to the end of the list, this plugin has the advantage of showing you a relative temporal relationship between modules (in other words, you can tell the order in which the modules loaded).modscan: This plugin uses pool tag scanning through the physical address space, including freed/deallocated memory, in search ofMmLd(the module metadata pool tag). It enables you to find both unlinked and previously loaded modules.unloadedmodules: For debugging purposes, the kernel maintains a list of modules that have recently unloaded. Along with the module names, it stores timestamps to indicate exactly when they unloaded and the locations in kernel memory they used to occupy.moddump: This plugin extracts one or more kernel modules that you identify by name or base address. It can only extract currently loaded modules with valid PE headers.
Ordered List of Active Modules
The following output shows an example of using the modules plugin. It’s important to understand the difference between the Offset(V) and Base columns. The prior (displayed in the far-left column) is the virtual address of the KLDR_DATA_TABLE_ENTRY metadata structure. The latter is the base address (also in virtual memory) of the start of the module’s PE header. Thus, on this particular system, you would expect to find the MZ signature for the NT module, ntoskrnl.exe, at 0xfffff80002852000.
$ python vol.py -f memory.vmem --profile=Win7SP1x64 modules
Volatility Foundation Volatility Framework 2.4
Offset(V)          Name            Base                   Size  File
------------------ --------------- ------------------ --------- ----
0xfffffa8000c32890 ntoskrnl.exe    0xfffff80002852000   0x5ea000
  SystemRootsystem32
toskrnl.exe
0xfffffa8000c327a0 hal.dll         0xfffff80002809000    0x49000
  SystemRootsystem32hal.dll
0xfffffa8000c326c0 kdcom.dll       0xfffff80000b9a000     0xa000
  SystemRootsystem32kdcom.dll
0xfffffa8000c2cf20 mcupdate.dll    0xfffff88000cdd000    0x4f000
  SystemRootsystem32mcupdate_GenuineIntel.dll

[snip]

0xfffffa8001515e20 bthport.sys     0xfffff880022c70e000    0x8c000
  SystemRootSystem32Driversthport.sys
0xfffffa80014383f0 rfcomm.sys      0xfffff88003238000    0x2c000
  SystemRootsystem32DRIVERS
fcomm.sys
0xfffffa80023d3570 BthEnum.sys     0xfffff88003264000    0x10000
  SystemRootsystem32DRIVERSBthEnum.sys
0xfffffa80020461e0 bthpan.sys      0xffffc88c00f039d000    0x20000
  SystemRootsystem32DRIVERSthpan.sys
0xfffffa80029958a0 PROCEXP152.SYS  0xffffc88f003bd000     0xd000
  ??C:Windowssystem32DriversPROCEXP152.SYS
The NT module is the very first module to load, and it’s followed by hal.dll (the hardware abstraction layer). This makes sense because they are both primary components of the OS that need to start early. You’ll then begin to notice drivers related to specific services that start automatically at boot time, such as the kernel debugger communication (kdcom.dll) and Bluetooth (BthEnum.sys) drivers. The very end of the list shows the most recently loaded module, PROCEXP152.SYS, which is related to SysInternals Process Explorer—which a user interactively started.
If the system became infected with a kernel rootkit, you’d see a new entry for the malicious module added to the end (assuming that you capture memory before the next reboot and that the rootkit doesn’t try to hide its metadata structure).
Brute Force Scanning for Modules
The output of the modscan plugin resembles that of which you just saw. However, there are some key differences:
- Because the module metadata structures are found by scanning through the physical address space, the column on the left,
Offset(P), displays a physical offset rather than an address in virtual memory. - The modules appear in the order in which they’re found, not the order in which they were loaded.
Of course, because modscan also audits free and deallocated memory blocks, you can find unlinked and previously loaded modules. Here’s an example of the output:
$ python vol.py -f memory.vmem --profile=Win7SP1x64 modscan
Volatility Foundation Volatility Framework 2.4
Offset(P)          Name            Base                    Size File
------------------ --------------- ------------------ --------- ----
0x000000000038ae90 mouclass.sys    0xfffff88003bd9000     0xf000
  SystemRootsystem32DRIVERSmouclass.sys
0x000000002c78c590 serenum.sys     0xfffff88003a1d000     0xc000
  SystemRootsystem32DRIVERSserenum.sys
0x000000003e0edde0 spsys.sys       0xffffc88f00321000    0x71000
  SystemRootsystem32driversspsys.sys
0x000000003c39e058a0 PROCEXP152.SYS  0xffffc88f003bd000     0xd000
  ??C:Windowssystem32DriversPROCEXP152.SYS
0x000000003e422360 lltdio.sys      0xffffc88f002d2000    0x15000
  SystemRootsystem32DRIVERSlltdio.sys
0x000000003e424a00 rspndr.sys      0xffffc88f002c70e000    0x18000
  SystemRootsystem32DRIVERS
spndr.sys
 [snip]
Recently Unloaded Modules
The following output shows an example of the unloadedmodules plugin. As previously mentioned, the kernel maintains this list for debugging purposes. For example, a module may queue a Deferred Procedure Call (DPC) or schedule a timer, but then unload without cancelling it. Thus, when the procedure is invoked, the intended handler function is no longer in memory. This can cause a dangling pointer issue and lead to unpredictable consequences. If the kernel didn’t keep this list of recently unloaded modules and the address ranges they used to occupy, it would be next to impossible to determine which module is buggy.
$ python vol.py -f memory.vmem --profile=Win7SP1x64 unloadedmodules
Volatility Foundation Volatility Framework 2.4
Name                 StartAddress       EndAddress         Time
-------------------- ------------------ ------------------ ----
dump_dumpfve.sys     0xfffff8800167b000 0xfffff8800168e000 2014-03-27 17:22:20
dump_LSI_SAS.sys     0xfffff8800165e000 0xfffff8800167b000 2014-03-27 17:22:20
dump_storport.sys    0xfffff88001654000 0xfffff8800165e000 2014-03-27 17:22:20
crashdmp.sys         0xfffff88001646000 0xfffff88001654000 2014-03-27 17:22:20
bthpan.sys           0xffffc88f002b2000 0xffffc88f002d2000 2014-04-08 16:43:31
rfcomm.sys           0xffffc88f00276000 0xffffc88f002a2000 2014-04-08 16:43:31
BthEnum.sys          0xffffc88f002a2000 0xffffc88f002b2000 2014-04-08 16:43:31
BTHUSB.sys           0xfffff88003ca8000 0xfffff88003cc0000 2014-04-08 16:43:31
[snip]
The unloaded module list can also come in handy for forensics and malware investigations, particularly when rootkits attempt to unload quickly (i.e., the get in, get out approach). As shown in the following example from a Rustock.C variant, you cannot find the xxx.sys module in the active modules list or by pool tag scanning. However, in an entirely different data structure, the kernel remembers that the malicious module once loaded.
$ python vol.py -f rustock-c.vmem --profile=WinXPSP3x86 unloadedmodules
Volatility Foundation Volatility Framework 2.4
Name                 StartAddress EndAddress Time
-------------------- ------------ ---------- ----
Sfloppy.SYS          0x00f8b92000 0xf8b95000 2010-12-31 18:46:04
Cdaudio.SYS          0x00f89d2000 0xf89d7000 2010-12-31 18:46:04
splitter.sys         0x00f8c1c000 0xf8c1e000 2010-12-31 18:46:40
swmidi.sys           0x00f871a000 0xf8728000 2010-12-31 18:46:41
aec.sys              0x00f75d8000 0xf75fb000 2010-12-31 18:46:41
DMusic.sys           0x00f78d0000 0xf78dd000 2010-12-31 18:46:41
drmkaud.sys          0x00f8d9c000 0xf8d9d000 2010-12-31 18:46:41
kmixer.sys           0x00f75ae000 0xf75d8000 2010-12-31 18:46:46
xxx.sys              0x00f6f88000 0xf6fc2000 2010-12-31 18:47:57

$ python vol.py -f rustock-c.vmem --profile=WinXPSP3x86 modules | grep xxx
$ python vol.py -f rustock-c.vmem --profile=WinXPSP3x86 modscan | grep xxx
Unfortunately, because the xxx.sys module did in fact unload, you can no longer expect to dump it out of memory. However, at least you have a timestamp associated with the activity that you can use in timeline-based investigations, and you also have the name of the file on disk, so you can attempt to recover it from the file system.
Extracting Kernel Modules
Provided that a kernel module is still loaded into memory, you can extract it for static analysis with the moddump plugin. The available command-line options are shown here:
$ python vol.py -f memory.vmem --profile=Win7SP1x64 moddump
[snip]

 -D DUMP_DIR, --dump-dir=DUMP_DIR
                        Directory in which to dump executable files
  -u, --unsafe          Bypasses certain sanity checks when creating image
  -r REGEX, --regex=REGEX
                        Dump modules matching REGEX
  -i, --ignore-case     Ignore case in pattern match
  -b BASE, --base=BASE  Dump driver with BASE address (in hex)
  -m, --memory          Carve as a memory sample rather than exe/dis

---------------------------------
Module ModDump
---------------------------------
Dump a kernel driver to an executable file sample
To extract all currently loaded modules, just supply a path to your desired output directory, like this:
$ python vol.py –f memory.dmp
      --profile=Win7SP1x64 moddump
      –-dump-dir=OUTDIR

Volatility Foundation Volatility Framework 2.4
Module Base        Module Name          Result
------------------ -------------------- ------
0xfffff8000281b000 ntoskrnl.exe         OK: driver.fffff8000281b000.sys
0xfffff80002e05000 hal.dll              OK: driver.fffff80002e05000.sys
0xfffff88002b53000 peauth.sys           OK: driver.fffff88002b53000.sys
0xfffff88002ad9000 mrxsmb10.sys         OK: driver.fffff88002ad9000.sys
0xfffff88000f3c000 WMILIB.SYS           OK: driver.fffff88000f3c000.sys
0xfffff8800183a000 disk.sys             OK: driver.fffff8800183a000.sys
0xffffc88f00493000 portcls.sys          OK: driver.ffffc88f00493000.sys
0xfffff88000e1b000 termdd.sys           OK: driver.fffff88000e1b000.sys
0xfffff880042a8000 HIDPARSE.SYS         OK: driver.fffff880042a8000.sys
0xfffff880027dd000 rspndr.sys           OK: driver.fffff880027dd000.sys
0xfffff880042be000 vmusbmouse.sys       OK: driver.fffff880042be000.sys
0xfffff88000c00000 CI.dll               OK: driver.fffff88000c00000.sys
[snip]
Notice how the name of the output file is driver.ADDR.sys where ADDR is the base address of the module in kernel memory. Because only one module can occupy a given address at a time, the naming convention ensures that the output file names are unique (as opposed to basing them on the module’s name, which can cause conflicts).
In the next example, we extract modules using a case-insensitive regular expression. The tcp criteria matched two modules, tcpip.sys and tcpipreg.sys.
$ python vol.py –f memory.dmp
      --profile=Win7SP1x64 moddump
      --regex=tcp –-ignore-case
      --dump-dir=OUTDIR/

Volatility Foundation Volatility Framework 2.4
Module Base        Module Name          Result
------------------ -------------------- ------
0xfffff880018d3000 tcpip.sys            OK: driver.fffff880018d3000.sys
0xfffff88002a3c000 tcpipreg.sys         OK: driver.fffff88002a3c000.sys
Although the regular expression search is convenient, remember that there are occasions when you’ll have no name upon which to deploy a search (for example, if the metadata structures are overwritten or if you’ve found a PE header in an anonymous kernel pool allocation). In these cases, you can supply the base address (where you see the MZ signature) and moddump will perform the extraction. The following example assumes that a PE file exists at 0xfffff88003800000:
$ python vol.py –f memory.dmp
     --profile=Win7SP1x64 moddump
     --base=0xfffff88003800000
     --dump-dir=OUTDIR/

Volatility Foundation Volatility Framework 2.4
Module Base        Module Name          Result
------------------ -------------------- ------
0xfffff88003800000 UNKNOWN           OK: driver.fffff88003800000.sys
If you plan to load the extracted module into IDA Pro for static analysis, remember one thing: the ImageBase address in the PE header needs to be changed to match its real load address in kernel memory. In other words, you should use 0xfffff88003800000 for the last example shown. Here’s how you can do it using the pefile Python module from https://code.google.com/p/pefile:
$ python
Python 2.7.6 (v2.7.6:3a1db0d2747e, Nov 10 2013, 00:42:54)
[GCC 4.2.1 (Apple Inc. build 5666) (dot 3)] on darwin
Type "help", "copyright", "credits" or "license" for more information.
>>> import pefile
>>> pe = pefile.PE("driver.0xfffff88003800000.sys", fast_load = True)
>>> pe.OPTIONAL_HEADER.ImageBase = 0xfffff88003800000
>>> pe.write("driver.0xfffff88003800000.sys")
>>> quit()
This simple fix gives IDA Pro the additional context it needs to properly display relative function calls, jumps, and string references. Depending on the state of the binary’s import address table, you may also need to use Volatility’s impscan plugin to generate labels that you can apply to the IDA database. You’ll see an example of using impscan later in the chapter (also see “Recipe 16-8: Scanning for Imported Functions with ImpScan” in the Malware Analyst’s Cookbook).
Threads in Kernel Mode
When kernel modules create new threads with PsCreateSystemThread, the System process (PID 4 on XP and later) becomes the owner of the thread. In other words, the System process is the default home for threads that start in kernel mode. You can explore this fact with Process Explorer and see that the starting addresses for threads owned by the System process are offsets into kernel modules such as ACPI.sys and HTTP.sys (see Figure 13-3).
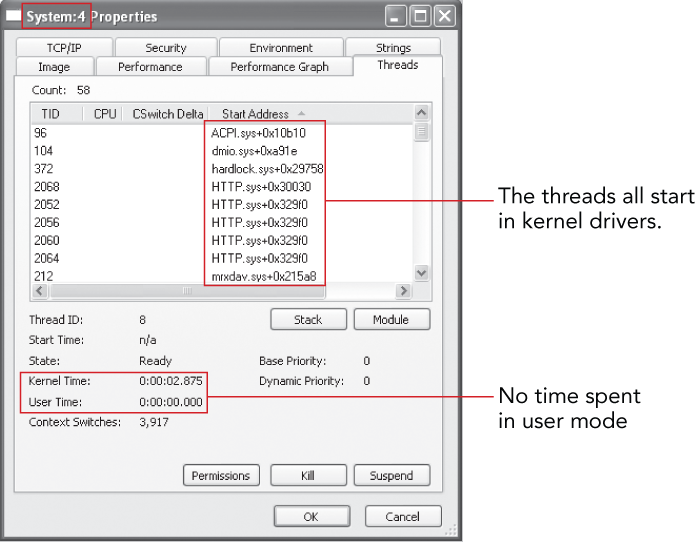
Figure 13-3: Threads that start in kernel mode are owned by the System process.
When parsing through a memory dump, you can distinguish these system threads from others based on the following factors:
- The
_ETHREAD.SystemThreadvalue is 1. - The
_ETHREAD.CrossThreadFlagsmember has thePS_CROSS_THREAD_FLAGS_SYSTEMflag set. - The owning process is PID 4.
This information can help you find malware families, such as Mebroot and Tigger, that attempt to hide their presence in the kernel. When the rootkit modules initially load, they allocate a pool of kernel memory, copy executable code to the pool, and call PsCreateSystemThread to begin executing the new code block. After the thread is created, the module can unload. These actions help the rootkit remain stealthy because it survives based on threads running from untagged pools of memory. However, this creates a rather obvious artifact for forensics because you have a thread with a starting address pointing to an unknown area of kernel memory, in which no known module exists.
Tigger’s Kernel Threads
Figure 13-4 shows the threads owned by the System process of a machine infected with Tigger. You can see the presence of four new threads that did not exist in Figure 13-3. Process Explorer just shows the thread’s start address instead of the normal format, such as driverName.sys+0xabcd, because the start address does not fall within the memory range of any loaded modules.

Figure 13-4: Process Explorer shows four new threads with no known kernel module.
Detecting Orphan Threads
The threads plugin can help you identify attempts to hide in the described manner. It enumerates loaded modules by walking the doubly linked list and records their base addresses and sizes. Then it scans for system threads and checks whether the _ETHREAD.StartAddress value is within the range of one of the modules. If the plugin cannot pair a thread with its owning driver, it assumes that the thread is detached or hidden. For this reason, the threads have also become known as orphan threads. The following output shows how orphan threads appear in memory dumps. You’ll see the OrphanThread tag displayed as well as an UNKNOWN to the right of the starting address (0xf2edd150).
$ python vol.py -f orphan.vmem threads -F OrphanThread
     --profile=WinXPSP3x86
[snip]

ETHREAD: 0xff1f92b0 Pid: 4 Tid: 1648
Tags: OrphanThread,SystemThread
Created: 2010-08-15 19:26:13
Exited: 1970-01-01 00:00:00
Owning Process: System
Attached Process: System
State: Waiting:DelayExecution
BasePriority: 0x8
Priority: 0x8
TEB: 0x00000000
StartAddress: 0xf2edd150 UNKNOWN
ServiceTable: 0x80552180
  [0] 0x80501030
  [1] 0x00000000
  [2] 0x00000000
  [3] 0x00000000
Win32Thread: 0x00000000
CrossThreadFlags: PS_CROSS_THREAD_FLAGS_SYSTEM
If you suspect a kernel rootkit exists on the system you’re investigating, but you can’t find supporting evidence with the modules or modscan plugins, we recommend checking for orphan threads. However, keep in mind that the thread’s starting address will point at a function inside the malicious PE file, rather than at the PE file’s base address. Thus, you may need to do some calculation to find the MZ signature. Near the end of the chapter, you’ll see a volshell script that can scan backward from a given address to find the first valid PE header.
Driver Objects and IRPs
Typically, when a kernel module loads, in addition to the creation of a KLDR_DATA_TABLE_ENTRY structure, a corresponding _DRIVER_OBJECT is also initialized. This is important because the driver object contains critical information about its kernel module, such as a copy of the module’s base address, its unload routine, and pointers to the list of handler functions. This information can help you locate malicious modules when the metadata structures described thus far in the chapter are unlinked or corrupted. Furthermore, by finding the driver objects, you can check for hooks in the handler routines.
To provide a little more background, applications in Windows communicate with drivers by sending I/O Request Packets (IRPs). An IRP is a data structure that includes an integer to identify the desired operation (create, read, write, and so on) and buffers for any data to be read or written by the driver. Each driver object has a table of 28 function pointers that it can register to handle the different operations. The driver usually configures this table, known as the major function table or IRP function table, in its entry point routine right after being loaded. The following output shows that the table of 28 pointers, named MajorFunction, is part of every driver object:
>>> dt("_DRIVER_OBJECT")
'_DRIVER_OBJECT' (336 bytes)
0x0   : Type                           ['short']
0x2   : Size                           ['short']
0x8   : DeviceObject                   ['pointer64', ['_DEVICE_OBJECT']]
0x10  : Flags                          ['unsigned long']
0x18  : DriverStart                    ['pointer64', ['void']]
0x20  : DriverSize                     ['unsigned long']
0x28  : DriverSection                  ['pointer64', ['void']]
0x30  : DriverExtension                ['pointer64', ['_DRIVER_EXTENSION']]
0x38  : DriverName                     ['_UNICODE_STRING']
0x48  : HardwareDatabase               ['pointer64', ['_UNICODE_STRING']]
0x50  : FastIoDispatch                 ['pointer64', ['_FAST_IO_DISPATCH']]
0x58  : DriverInit                     ['pointer64', ['void']]
0x60  : DriverStartIo                  ['pointer64', ['void']]
0x68  : DriverUnload                   ['pointer64', ['void']]
0x70 : MajorFunction ['array', 28, ['pointer64', ['void']]]Scanning for Driver Objects
The Volatility driverscan command finds driver objects by pool tag scanning. Here’s an example of its output:
$ python vol.py -f memory.dmp --profile=Win7SP1x64 driverscan
Volatility Foundation Volatility Framework 2.4
Offset(P)          Start                  Size Service Key  Driver Name
------------------ ------------------ -------- ------------ -----------
0x000000000038ac80 0xfffff88003bd9000   0xf000 mouclass     Drivermouclass
0x00000000254eaa80 0xfffff88000e00000  0x15000 volmgr       Drivervolmgr
0x00000000254eae40 0xfffff88000fba000   0xd000 vdrvroot     Drivervdrvroot
0x000000003e0c10f060 0xfffff8800323c000  0x20000 BthPan       DriverBthPan
0x000000003e416060 0xffffc88f002c70e000  0x18000 rspndr       Driver
spndr
0x000000003e474e70 0xfffff8800364c000  0x2d000 mrxsmb       FileSystemmrxsmb
0x000000003c47e065d0 0xfffff8800284d000  0x24000 mrxsmb20     FileSystemmrxsmb2
[snip]
The physical offset of the _DRIVER_OBJECT structure displays in the far-left column. Then you see the starting address of the driver in kernel memory in the Start column. To give you an idea of how this can be useful, the address you see for Drivermouclass should match the base address for mouclass.sys shown by the modules or modscan plugins. Thus, if malware hides or erases the KLDR_DATA_TABLE_ENTRY, there’s still a _DRIVER_OBJECT with just as much (if not more) information on which modules are loaded on a system.
Hooking and Hook Detection
Rootkits can hook entries in a driver’s IRP function table. For example, by overwriting the IRP_MJ_WRITE function in a driver’s IRP table, a rootkit can inspect the buffer of data to be written across the network, to disk, or even to a printer. Another commonly seen example is hooking IRP_MJ_DEVICE_CONTROL for tcpip.sys. When you use netstat.exe or SysInternals TcpView.exe on a live system, it determines active connections and sockets using this communication channel. Thus, by hooking it, rootkits can easily hide network activity.
To detect IRP function hooks, you just need to find the _DRIVER_OBJECT structures in memory, read the 28 values in the MajorFunction array, and determine where they point. Although it is all automated by the driverirp plugin, as you’ll soon see, it doesn’t definitively tell you which entries are hooked; it still requires some analysis and interpretation on your part. That’s because there are legitimate cases in which a driver will forward its handler to another driver, causing the appearance of a hook.
Here’s an example of the driverirp plugin’s output for the Tcpip driver on a clean 64-bit system:
$ python vol.py -f memory.dmp --profile=Win7SP1x64 driverirp -r tcpip
Volatility Foundation Volatility Framework 2.4

--------------------------------------------------
DriverName: Tcpip
DriverStart: 0xfffff880016bb000
DriverSize: 0x204000
DriverStartIo: 0x0
   0 IRP_MJ_CREATE                        0xfffff880017a1070 tcpip.sys
   1 IRP_MJ_CREATE_NAMED_PIPE             0xfffff800028b81d4 ntoskrnl.exe
   2 IRP_MJ_CLOSE                         0xfffff880017a1070 tcpip.sys
   3 IRP_MJ_READ                          0xfffff800028b81d4 ntoskrnl.exe
   4 IRP_MJ_WRITE                         0xfffff800028b81d4 ntoskrnl.exe
   5 IRP_MJ_QUERY_INFORMATION             0xfffff800028b81d4 ntoskrnl.exe
   6 IRP_MJ_SET_INFORMATION               0xfffff800028b81d4 ntoskrnl.exe
   7 IRP_MJ_QUERY_EA                      0xfffff800028b81d4 ntoskrnl.exe
   8 IRP_MJ_SET_EA                        0xfffff800028b81d4 ntoskrnl.exe
   9 IRP_MJ_FLUSH_BUFFERS                 0xfffff800028b81d4 ntoskrnl.exe
  10 IRP_MJ_QUERY_VOLUME_INFORMATION      0xfffff800028b81d4 ntoskrnl.exe
  11 IRP_MJ_SET_VOLUME_INFORMATION        0xfffff800028b81d4 ntoskrnl.exe
  12 IRP_MJ_DIRECTORY_CONTROL             0xfffff800028b81d4 ntoskrnl.exe
  13 IRP_MJ_FILE_SYSTEM_CONTROL           0xfffff800028b81d4 ntoskrnl.exe
  14 IRP_MJ_DEVICE_CONTROL                0xfffff880016dafd0 tcpip.sys
  15 IRP_MJ_INTERNAL_DEVICE_CONTROL       0xfffff880017a1070 tcpip.sys
[snip]
The Tcpip driver starts at 0xfffff880016bb000 and occupies 0x20400 bytes. Most of its handlers either point at a function within tcpip.sys (self-handled operations) or at another module (forwarded operations). Rather than leaving the pointers zero/null, if a driver doesn’t intend to handle certain operations, it points the IRP at nt!IopInvalidDeviceRequest, which is just a dummy function in the NT module that acts as a fall-through (like a default case in a C switch statement).
Here’s an example of a 32-bit XP machine in which the Tcpip driver’s IRP_MJ_DEVICE_CONTROL routine has actually been hooked:
$ python vol.py -f hooker.bin --profile=WinXPSP3x86 driverirp -r tcpip
Volatility Foundation Volatility Framework 2.4

--------------------------------------------------
DriverName: Tcpip
DriverStart: 0xb2ec30f000
DriverSize: 0x58480
DriverStartIo: 0x0
   0 IRP_MJ_CREATE                        0xb2ef94f9 tcpip.sys
   1 IRP_MJ_CREATE_NAMED_PIPE             0xb2ef94f9 tcpip.sys
[snip]
  12 IRP_MJ_DIRECTORY_CONTROL             0xb2ef94f9 tcpip.sys
  13 IRP_MJ_FILE_SYSTEM_CONTROL           0xb2ef94f9 tcpip.sys
  14 IRP_MJ_DEVICE_CONTROL                0xf8b615d0 url.sys
  15 IRP_MJ_INTERNAL_DEVICE_CONTROL       0xb2ec97f018 tcpip.sys
  16 IRP_MJ_SHUTDOWN                      0xb2ef94f9 tcpip.sys
[snip]
Notice that the handler points at a function inside url.sys, which is not a normal system driver. In this case, you could dump url.sys from memory and reverse-engineer it to figure exactly what network sockets and connections it’s attempting to filter on the live machine.
Stealthy Hooks
TDL3 is an example of a rootkit that defeats the common method of IRP hooks detection. In the following output, all the IRP handlers for vmscsi.sys lead to a function that at first glance appears to indicate that there is no forwarding or hooking for the request. In particular, they all point to 0xf9db9cbd, which is within the range of the vmscsi.sys driver’s memory.
$ python vol.py -f tdl3.vmem driverirp -r vmscsi
      --profile=WinXPSP3x86
Volatility Foundation Volatility Framework 2.4
--------------------------------------------------
DriverName: vmscsi
DriverStart: 0xf9db8000
DriverSize: 0x2c00
DriverStartIo: 0xf97ea40e
   0 IRP_MJ_CREATE                        0xf9db9cbd vmscsi.sys
   1 IRP_MJ_CREATE_NAMED_PIPE             0xf9db9cbd vmscsi.sys
   2 IRP_MJ_CLOSE                         0xf9db9cbd vmscsi.sys
   3 IRP_MJ_READ                          0xf9db9cbd vmscsi.sys
   4 IRP_MJ_WRITE                         0xf9db9cbd vmscsi.sys
   5 IRP_MJ_QUERY_INFORMATION             0xf9db9cbd vmscsi.sys
   6 IRP_MJ_SET_INFORMATION               0xf9db9cbd vmscsi.sys
   7 IRP_MJ_QUERY_EA                      0xf9db9cbd vmscsi.sys
   8 IRP_MJ_SET_EA                        0xf9db9cbd vmscsi.sys
[snip]
Consider the diagram in Figure 13-5, which illustrates how the TDL3 rootkit can still gain control over all operations intended for the vmscsi.sys driver.
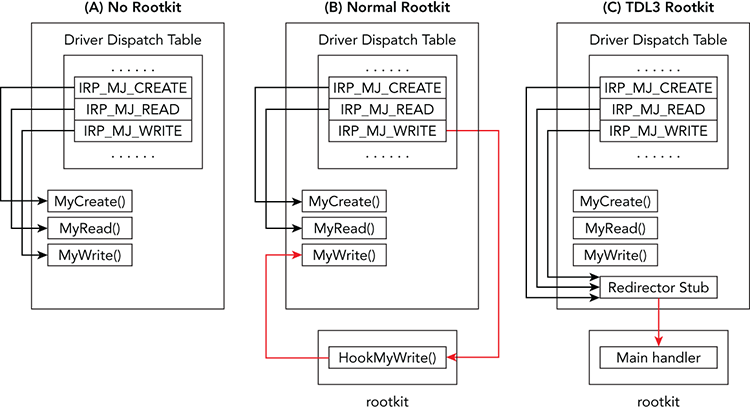
Figure 13-5: TDL3 evades IRP hook detection by using a redirector stub inside the victim driver.
The diagram shows that normal rootkits overwrite IRP table entries and point them outside of the owning driver’s memory. TDL3, on the other hand, writes a small code block in the memory of the owning driver (vmscsi.sys in this case), which it uses as a launching point to jump to the rootkit code. In this scenario, the IRP functions still point inside vmscsi.sys, making it very difficult to determine if the driver has been compromised. By using the --verbose flag to driverirp or by using the volshell plugin to disassemble the handler function, you’ll see that it just contains the following:
0xf9db9cbd a10803dfff       MOV EAX, [0xffdc03f008]
0xf9db9cc2 ffa0fc000000     JMP DWORD [EAX+0xfc]
0xf9db9cc8 0000             ADD [EAX], AL
0xf9db9cca 0000             ADD [EAX], AL
0xf9db9ccc 0000             ADD [EAX], AL
0xf9db9cce 0000             ADD [EAX], AL
The first instruction dereferences a pointer at 0xffdc03f008. Then the CPU is redirected via a JMP instruction to an address that’s located at offset 0xFC from the pointer in EAX. You can easily follow these hops in volshell as shown here:
 >>> dd(0xffdc03f008, length=4)
ffdc03f008  817ef908

>>> dd(0x817ef908 + 0xFC, length=4)
817efa04  81926e31

>>> dis(0x81926e31)
0x81926e31 55                               PUSH EBP
0x81926e32 8bec                             MOV EBP, ESP
0x81926e34 8b450c                           MOV EAX, [EBP+0xc]
0x81926e37 8b4d08                           MOV ECX, [EBP+0x8]
0x81926e3a 83ec0c                           SUB ESP, 0xc
0x81926e3d 53                               PUSH EBX
0x81926e3e 8b5860                           MOV EBX, [EAX+0x60]
0x81926e41 a10803dfff                       MOV EAX, [0xffdc03f008]
0x81926e46 3b4808                           CMP ECX, [EAX+0x8]
[snip]
At this point, you know the rootkit’s real code occupies the area around 0x81926e31. Regardless of how the rootkit hides, remember that it always has to remain functional. This one’s functionality involved hooking IRPs, and by following the hooks, you were taken straight to the body of the malicious module.
High Value Targets
There are hundreds of drivers on a typical system, so you cannot possibly analyze all 28 major function pointers for each driver, especially if they’re using stealthy hooking techniques. Our recommendation is that you focus on the highest-value targets. For example, attackers will be interested in the IRP_MJ_READ and IRP_MJ_WRITE of file system drivers. Additionally, they’ll be interested in the IRP_MJ_DEVICE_CONTROL for networking drivers such as DriverTcpip, DriverNDIS, and DriverHTTP.
Device Trees
Windows uses a layered (or stacked) architecture for handling I/O requests. In other words, multiple drivers can handle the same IRP. This layered approach has its advantages—it permits transparent file system archiving and encryption (such as EFS), as well as the capability for firewall products to filter network connections. However, it also provides yet another way for a malicious driver to interact with data that it shouldn’t be accessing. For example, instead of hooking a target driver’s IRP function, as previously described, a rootkit can just insert, or attach, to the target device’s stack. In this manner, the rootkit’s driver receives a copy of the IRP, which it can log or modify before the legitimate driver receives it.
Figure 13-6 shows a simplified diagram of how a rootkit can exploit the layered driver architecture. The point is that the malicious driver takes a position in the stack so that it can “inspect” the requested operation regardless of where the request originates. In this case, it attached to the ATA driver’s stack (atapi.sys) and filtered attempts to write to specific sectors of the hard disk. In this manner, it doesn’t matter whether an application in user mode or an antivirus driver in kernel mode tries to delete a protected file; the rootkit driver still gets the opportunity to block or drop the request.

Figure 13-6: A malicious filter driver can inspect, log, and/or prevent attempts to read or write from the disk
Auditing Device Trees
To audit device trees, you can use the devicetree plugin. This plugin’s output shows you that the drivers on the outer edge of the tree (DRV) and their devices (DEV) are indented one level. Any attached devices (ATT) are further indented. When analyzing the output, you should first focus on the most critical device types (network, keyboard, and disk) because those are the ones attackers commonly target.
Here is an example of a memory dump infected with the proof of concept KLOG rootkit, which attaches to the keyboard device to receive copies of the user’s keystrokes:
$ python vol.py -f klog.dmp --profile=Win2003SP1x86 devicetree

DRV 0x01f89310 Driverklog
---| DEV 0x81d2d730 (?) FILE_DEVICE_KEYBOARD

[snip]

DRV 0x02421770 DriverKbdclass
---| DEV 0x81e96030 KeyboardClass1 FILE_DEVICE_KEYBOARD
---| DEV 0x822211e0 KeyboardClass0 FILE_DEVICE_KEYBOARD
------| ATT 0x81d2d730 (?) - Driverklog FILE_DEVICE_KEYBOARD

[snip]
KLOG created a driver named Driverklog and then it created an unnamed device, indicated by (?), of type FILE_DEVICE_KEYBOARD and attached it to the KeyboardClass0 device owned by DriverKbdclass. You will see a similar effect if you install the Ctrl2cap utility from SysInternals (http://technet.microsoft.com/en-us/sysinternals/bb897578.aspx) because it uses the same layered driver approach to convert caps-lock characters into control characters.
Stuxnet’s Malicious Devices
The next example shows modifications made to the system by the Stuxnet kernel driver (DriverMRxNet):
$ python vol.py -f stuxnet.mem devicetree

DRV 0x0205e5a8 FileSystemvmhgfs
---| DEV 0x820c00f030 hgfsInternal UNKNOWN
---| DEV 0x821a1030 HGFS FILE_DEVICE_NETWORK_FILE_SYSTEM
------| ATT 0x81f5d020 (?) - FileSystemFltMgr FILE_DEVICE_NETWORK_FILE_SYSTEM
---------| ATT 0x821354b8 (?) - DriverMRxNet FILE_DEVICE_NETWORK_FILE_SYSTEM

DRV 0x023ae880 FileSystemMRxSmb
---| DEV 0x81da95d0 LanmanDatagramReceiver FILE_DEVICE_NETWORK_BROWSER
---| DEV 0x81ec50e030 LanmanRedirector FILE_DEVICE_NETWORK_FILE_SYSTEM
------| ATT 0x81bc10f020 (?) - FileSystemFltMgr FILE_DEVICE_NETWORK_FILE_SYSTEM
---------| ATT 0x81f0fc58 (?) - DriverMRxNet FILE_DEVICE_NETWORK_FILE_SYSTEM

DRV 0x02476da0 FileSystemCdfs
---| DEV 0x81e636c8 Cdfs FILE_DEVICE_CD_ROM_FILE_SYSTEM
------| ATT 0x81fac548 (?) - FileSystemFltMgr FILE_DEVICE_CD_ROM_FILE_SYSTEM
---------| ATT 0x8226ef10 (?) - DriverMRxNet FILE_DEVICE_CD_ROM_FILE_SYSTEM

DRV 0x0253d180 FileSystemNtfs
---| DEV 0x82166020  FILE_DEVICE_DISK_FILE_SYSTEM
------| ATT 0x8228c6b0 (?) - FileSystemsr FILE_DEVICE_DISK_FILE_SYSTEM
---------| ATT 0x81f47020 (?) - FileSystemFltMgr FILE_DEVICE_DISK_FILE_SYSTEM
------------| ATT 0x81fb9680 (?) - DriverMRxNet FILE_DEVICE_DISK_FILE_SYSTEM
The unnamed device created by DriverMRxNet is the outermost device attached to the vmhgfs (VMware Host to Guest File System), MRxSmb (SMB), Cdfs, and Ntfs file system drivers. Now Stuxnet can filter or hide specifically named files and directories on those file systems.
Auditing the SSDT
A System Service Descriptor Table (SSDT) contains pointers to kernel mode functions. As shown in Figure 13-7, when applications in user mode request system services, such as writing to a file or creating a process, a small stub in ntdll.dll (or other user mode library) assists the calling thread in entering kernel mode in a controlled manner. The transition is accomplished by issuing an INT 0x2E instruction in Windows 2000 or by using SYSENTER in XP and later. Both methods first end up in a function named KiSystemService, which looks up the address of the requested kernel function in the SSDT. The lookup is index-based because the call tables are arrays of pointers.
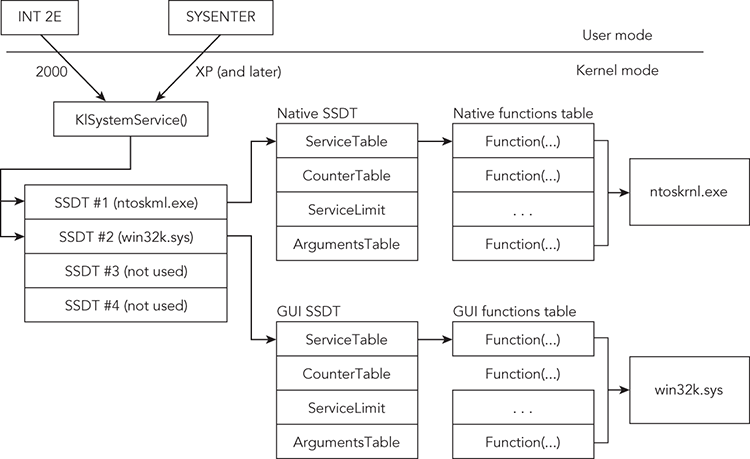
Figure 13-7: A high-level diagram showing the role of the SSDT in dispatching system calls
The order and total number of functions in the SSDT differ across operating system versions. For example, NtUnloadDriver can be found at index 0x184 on Windows 7 64-bit, but it is 0x1A1 on Windows 8 64-bit. Also, note that there is more than one call table on every system. The first and most well-known table stores native API functions that the kernel executive module provides (ntoskrnl.exe, ntkrnlpa.exe, etc.). The second table, known as the shadow SSDT, stores GUI functions provided by win32k.sys. As shown in Figure 13-7, the other two tables are unused by default unless you’re running an IIS server—in which case the third one is used by spud.sys (the IIS service driver).
Enumerating the SSDT
To enumerate the SSDT in Windows memory dumps, you can use the ssdt plugin. Due to changes between 32- and 64-bit versions, the plugin finds the SSDT data in entirely different ways, but the format of the output is consistent. Specifically, on 32-bit Windows, we enumerate all thread objects and gather the unique values for the _ETHREAD.Tcb.ServiceTable member. This member doesn’t exist on 64-bit platforms, so instead we disassemble the exported nt!KeAddSystemServiceTable function and extract the relative virtual addresses (RVAs) for the KeServiceDescriptorTable and KeServiceDescriptorTableShadow symbols, as shown in Figure 13-8.
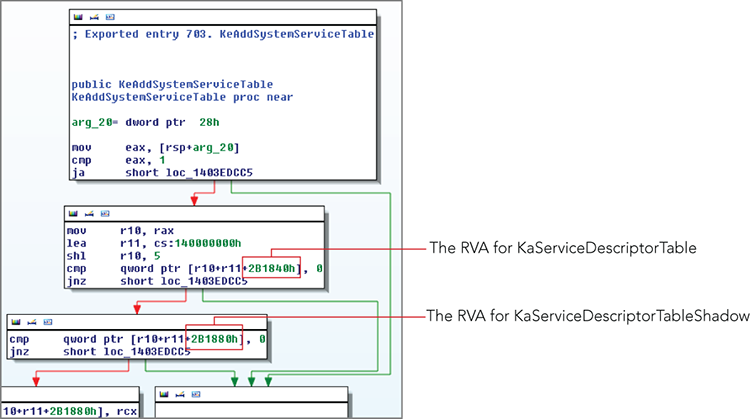
Figure 13-8: The RVAs of the SSDT and Shadow SSDT are accessible from the KeAddSystemServiceTable API.
Here’s how the ssdt plugin’s output appears on a clean 64-bit Windows 7 machine:
$ python vol.py -f memory.dmp --profile=Win7SP1x64 ssdt
Volatility Foundation Volatility Framework 2.4

[x64] Gathering all referenced SSDTs from KeAddSystemServiceTable...
Finding appropriate address space for tables...

SSDT[0] at fffff800028dc300 with 401 entries
  Entry 0x0000: 0xfffff80002ce9ca0 (NtMapUser[snip]) owned by ntoskrnl.exe
  Entry 0x0001: 0xfffff80002bd18c0 (NtWaitForSingleObject) owned by ntoskrnl.exe
  Entry 0x0002: 0xfffff800028d31a0 (NtCallbackReturn) owned by ntoskrnl.exe
  Entry 0x0003: 0xfffff80002bc4a80 (NtReadFile) owned by ntoskrnl.exe
  Entry 0x0004: 0xfffff80002bf67a0 (NtDeviceIoControlFile) owned by ntoskrnl.exe
  Entry 0x0005: 0xfffff80002bed9a0 (NtWriteFile) owned by ntoskrnl.exe
  Entry 0x0006: 0xfffff80002b97c90 (NtRemoveIoCompletion) owned by ntoskrnl.exe
  [snip]

SSDT[1] at fffff960001a1f00 with 827 entries
  Entry 0x1000: 0xfffff96000195974 (NtUserGetThreadState) owned by win32k.sys
  Entry 0x1001: 0xfffff96000192a50 (NtUserPeekMessage) owned by win32k.sys
  Entry 0x1002: 0xfffff960001a3f6c (NtUserCallOneParam) owned by win32k.sys
  Entry 0x1003: 0xfffff960001b211c (NtUserGetKeyState) owned by win32k.sys
  Entry 0x1004: 0xfffff960001ab500 (NtUserInvalidateRect) owned by win32k.sys
  Entry 0x1005: 0xfffff960001a4164 (NtUserCallNoParam) owned by win32k.sys
  Entry 0x1006: 0xfffff9600019b990 (NtUserGetMessage) owned by win32k.sys
  Entry 0x1007: 0xfffff9600017ffb0 (NtUserMessageCall) owned by win32k.sys
  [snip]
As shown, the table at 0xfffff800028dc300 is SSDT[0] or the first descriptor in the _SERVICE_DESCRIPTOR_TABLE.Descriptors array. In other words, this table is for the native APIs exported by the NT module. The table at 0xfffff960001a1f00 is SSDT[1] (the second descriptor), which tells you that it is the table for GUI subsystem APIs. All functions shown appear to be owned by the proper module (either the NT module or win32k.sys).
Attacking the SSDT
There are several different ways to attack the system call dispatching architecture. We list the methods next, along with a description of how you can use memory forensics to detect the attacks.
Pointer Replacement
This method involves overwriting pointers in the SSDT to hook individual functions. To do this, you typically need the base address of the call table in kernel memory and the index of the function that you want to hook. You have several ways to find the call table, but malware often leverages MmGetSystemRoutineAddress (the kernel version of GetProcAddress) and locates the KeServiceDescriptorTable symbol, which is exported by the NT module. It then references the ServiceTable member. You’ll often see the InterlockedExchange API used to perform the actual pointer replacement.
All addresses in the native function table should point inside the NT module, and all addresses in the GUI function table should point inside win32k.sys. Detecting SSDT hooks is simple in this regard because you can just check each of the entries and determine whether they point at the right module. Here’s a malware sample that hooks various functions and points them at a module named lanmandrv.sys. You can filter the results using egrep -v to exclude the legitimate modules:
$ python vol.py -f laqma.vmem ssdt --profile=WinXPSP3x86
      | egrep -v '(ntoskrnl.exe|win32k.sys)'
Volatility Foundation Volatility Framework 2.4

[x86] Gathering all referenced SSDTs from KTHREADs...
Finding appropriate address space for tables...

SSDT[0] at 805011fc with 284 entries
  Entry 0x0049: 0xf8c52884 (NtEnumerateValueKey) owned by lanmandrv.sys
  Entry 0x007a: 0xf8c5253e (NtOpenProcess) owned by lanmandrv.sys
  Entry 0x0091: 0xf8c52654 (NtQueryDirectoryFile) owned by lanmandrv.sys
  Entry 0x00ad: 0xf8c52544 (NtQuerySystemInformation) owned by lanmandrv.sys
The rootkit hooks four functions: NtEnumerateValueKey for hiding registry values, NtOpenProcess and NtQuerySystemInformation for hiding active processes, and NtQueryDirectoryFile for hiding files on disk. Despite the somewhat misleading name (lanmandrv.sys sounds like it could be a legitimate component), it stands out because it should not be handling APIs that are typically implemented by the NT module.
Inline Hooking
Attackers are well aware of the methods used to detect the modifications their tools make to systems. Thus, instead of pointing SSDT functions outside of the NT module or win32ks.sys, they can just use an inline hooking technique. This technique has the same effect of redirecting execution to a malicious function, but it is not as obvious. Here’s an example of how it appeared when the Skynet rootkit hooked NtEnumerateKey (we added the --verbose flag to check for these inline hooks):
$ python vol.py -f skynet.bin --profile=WinXPSP3x86 ssdt --verbose

[snip]

SSDT[0] at 804e26a8 with 284 entries
  Entry 0x0047: 0x80570d64 (NtEnumerateKey) owned by ntoskrnl.exe
  ** INLINE HOOK? => 0x820f1b3c (UNKNOWN)
  Entry 0x0048: 0x80648aeb (NtEnumerateSystem[snip]) owned by ntoskrnl.exe
  Entry 0x0049: 0x80590677 (NtEnumerateValueKey) owned by ntoskrnl.exe
  Entry 0x004a: 0x80625738 (NtExtendSection) owned by ntoskrnl.exe
  Entry 0x004b: 0x805b0b4e (NtFilterToken) owned by ntoskrnl.exe
  Entry 0x004c: 0x805899b4 (NtFindAtom) owned by ntoskrnl.exe
The pointer 0x80570d64 is indeed owned by ntoskrnl.exe, but the instructions at that address have been overwritten with a JMP that leads to 0x820f1b3c. Thus, if you check only the initial owning module, you’ll miss the fact that this malware hooks the SSDT.
Table Duplication
Each thread on a 32-bit system has a _ETHREAD.Tcb.ServiceTable member that identifies the SSDT table it uses. Although this capability to assign call tables on a per-thread basis does not apply to 64-bit systems, what it essentially means is that each thread can be “looking” at a different SSDT, depending on the value of its ServiceTable member. In this case, malware could create a copy of the native function table, hook a few functions, and then update the ServiceTable value for a specific thread or all threads in a specific process to point at the new copy. As a result, many tools fail to report SSDT hooks because they check only the original table, not the copies.
Here’s an example of how the ssdt plugin’s output appears when analyzing a memory dump infected with Blackenergy. Only the relevant lines are shown:
$ python vol.py -f blackenergy.vmem --profile=WinXPSP3x86 ssdt

SSDT[0] at 814561b0 with 284 entries
  Entry 0x0115: 0x817315c1 (NtWriteVirtualMemory) owned by 00000B9D

SSDT[0] at 81882980 with 284 entries
  Entry 0x0115: 0x817315c1 (NtWriteVirtualMemory) owned by 00000B9D

SSDT[0] at 80501030 with 284 entries
  Entry 0x0115: 0x805a82f6 (NtWriteVirtualMemory) owned by ntoskrnl.exe
Note that there are three different instances of SSDT[0], whereas a typical system has only one. You can tell that the table at 0x80501030 is the original clean copy because NtWriteVirtualMemory points to the NT module. However, both tables at 0x814561b0 and 0x81882980 are hooked—their versions of NtWriteVirtualMemory are pointing at a module named 00000B9D.
SSDT Hook Disadvantages
Hooking SSDT functions can provide a wide range of capabilities, but they can also be unstable. Here are a few reasons why malware authors might begin to use other techniques in the future:
- Patchguard: Hooking the SSDT is prevented on 64-bit systems due to Kernel Patch Protection (KPP), also known as Patchguard.
- Multiple cores: The system call tables are not a per-CPU structure. Thus, while one core is attempting to apply a hook, another core can be trying to call APIs.
- Duplicate entries: If third-party drivers are allowed to hook SSDT entries, multiple drivers might try to hook the same function. The consequences of drivers swapping out hooks can be unpredictable.
- Undocumented APIs: Many of the SSDT functions are undocumented by Microsoft and subject to change across versions of Windows. Thus, it can be difficult to write a portable rootkit that’s also reliable.
Kernel Callbacks
Kernel callbacks, or notification routines, are the new API hooks. They solve many of the previously described issues regarding SSDT hooks. In particular, they’re documented, supported on 64-bit systems, and safe for multicore machines; and it is perfectly fine for multiple modules to register for the same type of event. The following list describes the various types of events that Volatility’s callbacks plugin detects:
- Process creation: These callbacks are installed with the
PsSetCreateProcessNotifyRoutineAPI and they’re relied upon by the Process Monitor utility from SysInternals, various antivirus products, and many rootkits. They’re triggered when a process starts or exits. - Thread creation: These callbacks are installed with the
PsSetCreateThreadNotifyRoutineAPI. They’re triggered when a thread starts or exits. - Image load: These callbacks are installed with the
PsSetLoadImageNotifyRoutineAPI. The purpose of these callbacks is to provide notifications when any executable image is mapped into memory, such as a process, library, or kernel module. - System shutdown: These callbacks are installed with the
IoRegisterShutdownNotificationAPI. In this case, the target driver’sIRP_MJ_SHUTDOWNhandler is invoked when the system is about to be powered off. - File system registration: To receive notification when a new file system becomes available, use the
IoRegisterFsRegistrationChangeAPI. - Debug message: To capture debug messages emitted by kernel modules, use the
DbgSetDebugPrintCallbackAPI. - Registry modification: Drivers can call
CmRegisterCallback(Windows XP and 2003) orCmRegisterCallbackEx(Windows Vista and later) to receive notification when any thread performs an operation on the registry. - PnP (Plug and Play): These callbacks are installed with the
IoRegisterPlugPlayNotificationAPI and they trigger when PnP devices are introduced, removed, or changed. - Bugchecks: These callbacks are installed with the
KeRegisterBugCheckCallbackorKeRegisterBugCheckReasonCallbackAPI, functions. They allow drivers to receive notification when a bug check (unhandled exception) occurs, thus providing the opportunity to reset device configurations or add device-specific state information to a crash dump file (before a Blue Screen of Death [BSoD], for example).
Callbacks in Memory
The following example shows the callbacks plugin on a clean Windows 7 64-bit system. Although the output is truncated for brevity, there were about 80 callbacks of different types installed on this system. The Callback column tells you the address of the function that is invoked when the event of interest occurs. The Module column tells you the name of the kernel module that occupies the memory for the callback function. Depending on the type of callback, you might also see the name of the driver object or a description of the component that installed the callback.
$ python vol.py -f memory.dmp --profile=Win7SP1x64 callbacks
Volatility Foundation Volatility Framework 2.4
Type                                 Callback           Module         Details
------------------------------------ ------------------ -------------- -------
GenericKernelCallback                0xfffff88002922d2c peauth.sys     -
EventCategoryTargetDeviceChange      0xfffff96000221304 win32k.sys     Win32k
[snip]
EventCategoryDeviceInterfaceChange   0xfffff88000db99b0 partmgr.sys    partmgr
EventCategoryTargetDeviceChange      0xfffff800029ef180 ntoskrnl.exe   ACPI
GenericKernelCallback                0xfffff800028a6af0 ntoskrnl.exe   -
IoRegisterShutdow[snip]              0xfffff88001434b04 VIDEOPRT.SYS   DriverRDPREFMP
IoRegisterShutdow[snip]              0xfffff88001434b04 VIDEOPRT.SYS   DriverRDPCDD
IoRegisterShutdow[snip]              0xfffff88000dd0c40 volmgr.sys     Drivervolmgr
[snip]
IoRegisterShutdownNotification       0xfffff80002cd0f70 ntoskrnl.exe   FileSystemRAW
PsRemoveLoadImageNotifyRoutine       0xfffff80002bf7cc0 ntoskrnl.exe   -
KeBugCheckCallbackListHead           0xfffff88001494b00 ndis.sys       Ndis min
KeBugCheckCallbackListHead           0xfffff88001494b00 ndis.sys       Ndis min
Malicious Callbacks
Many high-profile rootkits such as Mebroot, ZeroAccess, Rustock, Ascesso, Tigger, Stuxnet, Blackenergy, and TDL3 leverage kernel callbacks. In most cases, they also try to hide by unlinking the KLDR_DATA_TABLE_ENTRY or by running as an orphan thread from a kernel pool. This behavior makes the malicious callbacks easy to spot because the Module column in the output of Volatility’s callbacks plugin displays UNKNOWN. In other cases, malware authors don’t hide their module at all, but they use a hard-coded (and thus predictable) name with which you can build indicators of compromise (IOCs).
The first example is from Stuxnet. It loads two modules: mrxnet.sys and mrxcls.sys. The first one installs a file system registration change callback to receive notification when new file systems become available (so it can immediately spread or hide files). The second one installs an image load callback, which it uses to inject code into processes when they try to load other dynamic link libraries (DLLs).
$ python vol.py -f stuxnet.vmem --profile=WinXPSP3x86 callbacks
Volatility Foundation Volatility Framework 2.4
Type                                 Callback   Module               Details
------------------------------------ ---------- -------------------- -------
IoRegisterFsRegistrationChange       0xf84be876 sr.sys               -
IoRegisterFsRegistrationChange       0xb21d89ec mrxnet.sys           -
IoRegisterFsRegistrationChange       0xf84d54b8 fltMgr.sys           -
[snip]
KeRegisterBugCheckReasonCallback     0xf8b7aab8 mssmbios.sys         SMBiosDa
KeRegisterBugCheckReasonCallback     0xf8b7aa28 mssmbios.sys         SMBiosDa
KeRegisterBugCheckReasonCallback     0xf82e01be USBPORT.SYS          USBPORT
KeRegisterBugCheckReasonCallback     0xf82c75f022 VIDEOPRT.SYS         Videoprt
PsSetLoadImageNotifyRoutine          0xb240ce4c PROCMON20.SYS        -
PsSetLoadImageNotifyRoutine          0x805f81a6 ntoskrnl.exe         -
PsSetLoadImageNotifyRoutine          0xf895ad06 mrxcls.sys           -
PsSetCreateThreadNotifyRoutine       0xb240cc9a PROCMON20.SYS        -
PsSetCreateProcessNotifyRoutine      0xf87ad194 vmci.sys             -
PsSetCreateProcessNotifyRoutine      0xb240cb94 PROCMON20.SYS        -
The next example is from Rustock.C. It registers a bug check callback so that it can clean its memory before a crash dump is created (see Frank Boldewin’s report here: http://www.reconstructer.org/papers/Rustock.C%20-%20When%20a%20myth%20comes%20true.pdf). The only reason why you see its artifacts here in the memory dump is because the memory was acquired in raw format instead.
$ python vol.py -f rustock-c.mem --profile=WinXPSP3x86 callbacks
Volatility Foundation Volatility Framework 2.4
Type                                 Callback   Module               Details
------------------------------------ ---------- -------------------- -------
IoRegisterFsRegistrationChange       0xf84be876 sr.sys               -
KeBugCheckCallbackListHead           0x81f53964 UNKNOWN              -
[snip]
GenericKernelCallback                0xf887b6ae vmdebug.sys          -
KeRegisterBugCheckReasonCallback     0xf8b5aac0 mssmbios.sys         SMBiosDa
KeRegisterBugCheckReasonCallback     0xf8b5aa78 mssmbios.sys         SMBiosRe
KeRegisterBugCheckReasonCallback     0xf8b5aa30 mssmbios.sys         SMBiosDa
KeRegisterBugCheckReasonCallback     0xf82d93e2 VIDEOPRT.SYS         Videoprt
KeRegisterBugCheckReasonCallback     0xf8311006 USBPORT.SYS          USBPORT
KeRegisterBugCheckReasonCallback     0xc83f010f66 USBPORT.SYS          USBPORT
PsSetCreateProcessNotifyRoutine      0xf887b6ae vmdebug.sys          -
Here’s an example that shows the registry change callback installed by Ascesso. The rootkit uses this functionality to watch over its persistence keys in the registry, and adds them back if an administrator or antivirus software removes them.
$ python vol.py -f ascesso.vmem --profile=WinXPSP3x86 callbacks
Volatility Foundation Volatility Framework 2.4
Type                                 Callback   Module               Details
------------------------------------ ---------- -------------------- -------
IoRegisterFsRegistrationChange       0xf84be876 sr.sys               -
IoRegisterFsRegistrationChange       0xb2838900 LiveKdD.SYS          -
[snip]
GenericKernelCallback                0xf888d194 vmci.sys             -
GenericKernelCallback                0x8216628f UNKNOWN              -
GenericKernelCallback                0x8216628f UNKNOWN              -
KeRegisterBugCheckReasonCallback     0xf8b82ab8 mssmbios.sys         SMBiosDa
KeRegisterBugCheckReasonCallback     0xf8b82a70 mssmbios.sys         SMBiosRe
KeRegisterBugCheckReasonCallback     0xf7c61f011e USBPORT.SYS          USBPORT
KeRegisterBugCheckReasonCallback     0xf7f78522 VIDEOPRT.SYS         Videoprt
PsSetCreateProcessNotifyRoutine      0xf888d194 vmci.sys             -
CmRegisterCallback                   0x8216628f UNKNOWN              -
The Blackenergy rootkit installs a thread creation callback, so that it can immediately replace the _ETHREAD.Tcb.ServiceTable pointer on all threads that start on the system. As discussed in the section “Table Duplication” of this chapter, on 32-bit systems, the ServiceTable member points to the system call table in which the addresses of all kernel-mode APIs are found.
$ python vol.py -f blackenergy.vmem --profile=WinXPSP3x86 callbacks
Volatility Foundation Volatility Framework 2.4
Type                              Callback   Module         Details
--------------------------------- ---------- -------------- -------
IoRegisterShutdownNotification    0xf9eae5be Fs_Rec.SYS     FileSystemFs_Rec
[snip]
IoRegisterShutdownNotification    0x805c46f030 ntoskrnl.exe   DriverWMIxWDM
IoRegisterFsRegistrationChange    0xf97d9876 sr.sys         -
GenericKernelCallback             0xf9abec72 vmci.sys       -
PsSetCreateThreadNotifyRoutine    0x81731ea7 00000B9D       -
PsSetCreateProcessNotifyRoutine   0xf9abec72 vmci.sys       -
KeBugCheckCallbackListHead        0xf97015ed NDIS.sys       Ndis miniport
KeBugCheckCallbackListHead        0x806d57ca hal.dll        ACPI 1.0 - APIC
KeRegisterBugCheckReasonCallback  0xf9e68ac0 mssmbios.sys   SMBiosDa
KeRegisterBugCheckReasonCallback  0xf9e68a78 mssmbios.sys   SMBiosRe
Finding and analyzing callbacks is a critical component of kernel memory forensics. Surprisingly, there are no system administration tools and very few anti-rootkit tools for live systems that analyze kernel callbacks (RkU – Rootkit Unhooker is one of them). In fact, Microsoft’s own debugger doesn’t have the capability by default. However, Scott Noone (http://analyze-v.com/?p=746) and Matthieu Suiche (http://www.moonsols.com/2011/02/17/global-windows-callbacks-and-windbg/) have published scripts to help fill that void.
Kernel Timers
Most often, malware uses timers for synchronization and notification. A rootkit driver can create a timer (usually by calling KeInitializeTimer) to receive notification when a given time elapses. If you think this is similar to just calling Sleep, you’re right. However, calling Sleep puts a thread to sleep and prevents it from performing other actions while it waits, unlike notifications based on timers. Also, Sleep doesn’t create any additional forensic artifacts. You can also create timers that reset after expiring. In other words, instead of just being notified once, a thread can be notified on a periodic basis. Maybe the rootkit wants to check whether a DNS host name resolves every five minutes, or to poll a given registry key for changes every two seconds. Timers are great for these types of tasks.
When drivers create timers, they can supply a DPC routine—otherwise known as a deferred procedure call. When the timer expires, the system calls the specified procedure. The address of the procedure or function is stored in the _KTIMER structure, along with information on when (and how often) to execute the procedure. And now you see why kernel timers are such useful artifacts for memory forensics. Rootkits load drivers in kernel memory and try hard to stay undetected. But their use of timers gives you a clear indicator of where the rootkit is hiding in memory. All you need to do is find the timer objects.
Finding Timer Objects
Over the years, Microsoft has changed how and where timers are stored in memory. In Windows 2000, for example, the nt!KiTimerTableListHead symbol pointed to an array of 128 _LIST_ENTRY structures for _KTIMER. The array size later changed to 256 and then again to 512, until finally the nt!KiTimerTableListHead symbol was removed completely in Windows 7. Nowadays, you can find the timer objects by way of each CPU’s control region (_KPCR) structure. For more information on these changes, see Ain’t Nuthin But a K(Timer) Thing, Baby: http://mnin.blogspot.com/2011/10/aint-nuthin-butktimerthing-baby.html.
Malware Analysis with Timers
The following example shows how to investigate the ZeroAccess rootkit using the timers plugin. The rootkit employed various anti-forensic techniques to prevent its module from being easily detected, but as a result, a timer points into an unknown region of kernel memory.
$ python vol.py -f zeroaccess2.vmem timers
Volatility Foundation Volatility Framework 2.1_alpha
Offset       DueTime              Period(ms) Signaled  Routine     Module
0x805598e0   0x00000084:0xce8b961c 1000      Yes       0x80523dee  ntoskrnl.exe
0x820a1e08   0x00000084:0xdf3c0c1c 30000     Yes       0xb2d2a385  afd.sys
0x81ebf0b8   0x00000084:0xce951f84 0         -         0xf89c23f0  TDI.SYS
[snip]
0x81dbeb78   0x00000131:0x2e896402 0         -         0xf83faf6f  NDIS.sys
0x81e8b4f0   0x00000131:0x2e896402 0         -         0xf83faf6f  NDIS.sys
0x81eb8e28   0x00000084:0xc58e055f6a 0         -         0x80534e48  ntoskrnl.exe
0xb20bbbb0   0x00000084:0xd4de72d2 60000     Yes       0xb20b5990  UNKNOWN
0x8210d910   0x80000000:0x0a7efa36 0         -         0x80534e48  ntoskrnl.exe
0x82274190   0x80000000:0x711befba 0         -         0x80534e48  ntoskrnl.exe
0x81dc96e090 0x80000000:0x0d0c3e8a 0 - 0x80534e48 ntoskrnl.exeAdditionally, the same Rustock.C variant that you analyzed in the “Malicious Callbacks” section installed several timers. It also attempts to hide its kernel module, thus leaving traces of suspicious activity easily visible with the timers plugin.
$ python volatility.py timers -f rustock-c.vmem
Volatility Foundation Volatility Framework 1.4_rc1
Offset       DueTime               Period(ms) Signaled  Routine     Module
0xf730a790   0x00000000:0x6db0f0b4 0          -         0xf72fb385  srv.sys
0x80558a40   0x00000000:0x68f10168 1000       Yes       0x80523026  ntoskrnl.exe
0x80559160   0x00000000:0x695c4b3a 0          -         0x80526bac  ntoskrnl.exe
0x820822e4   0x00000000:0xa2a56bb0 150000     Yes       0x81c1642f  UNKNOWN
0xf842f150   0x00000000:0xb5cb4e80 0          -         0xc84f147e  Ntfs.sys
0xf70d00e0   0x00000000:0x81eb644c 0          -         0xf70c18de  HTTP.sys
0xf70cd808   0x00000000:0x81eb644c 60000      Yes       0xf70b6202  HTTP.sys
0x81e57fb0   0x00000000:0x6a4f7b16 30000      Yes       0xf7b62385  afd.sys
0x81f5f8d4   0x00000000:0x6a517bc8 3435       Yes       0x81c1642f  UNKNOWN
[snip]
As stated in the previous analysis, although you don’t know the name of the malicious module in these cases, you at least have pointers to where the rootkit code exists in kernel memory. You can then disassemble it with volshell or extract the code to a separate file for static analysis in IDA Pro or other frameworks.
Putting It All Together
Now that you’ve been exposed to the various methods of finding and analyzing malicious code in the kernel, we’ll show you an example of how to put all the pieces together. In this case, we first noticed the rootkit’s presence due to its timers and callbacks that point into memory that isn’t owned by a module in the loaded module list. Here is the relevant output from those two plugins:
$ python vol.py -f spark.mem --profile=WinXPSP3x86 timers
Volatility Foundation Volatility Framework 2.4
Offset(V) DueTime Period(ms) Signaled Routine Module
---------- ------------------------ ---------- -------- ---------- ------
0x8055b200 0x00000086:0x1c631c38 0 - 0x80534a2a ntoskrnl.exe
0x805516d0 0x00000083:0xe04693bc 60000 Yes 0x804f3eae ntoskrnl.exe
0x81dc52a0 0x00000083:0xe2d175b6 60000 Yes 0xf83fb6bc NDIS.sys
0x81eb8e28 0x00000083:0xd94cd26a 0 - 0x80534e48 ntoskrnl.exe
[snip]
0x80550ce0 0x00000083:0xc731f6fa 0 - 0x8053b8fc ntoskrnl.exe
0x81b9f790 0x00000084:0x290c9ad8 60000 - 0x81b99db0 UNKNOWN
0x822771a0 0x00000131:0x2c87e001a8 0 - 0xf83faf6f NDIS.sys
$ python vol.py -f spark.mem --profile=WinXPSP3x86 callbacks
Volatility Foundation Volatility Framework 2.4
Type Callback Module Details
--------------------------------- ---------- ----------- -------
IoRegisterFsRegistrationChange 0xf84be876 sr.sys -
KeBugCheckCallbackListHead 0xf83e65ef NDIS.sys Ndis miniport
KeBugCheckCallbackListHead 0x806d77cc hal.dll ACPI 1.0 - APIC
IoRegisterShutdownNotification 0x81b934e0 UNKNOWN Driver�3621276
IoRegisterShutdownNotification 0xf88ddc74 Cdfs.SYS FileSystemCdfs
[snip]
PsSetCreateProcessNotifyRoutine 0xf87ad194 vmci.sys -
CmRegisterCallback 0x81b92d60 UNKNOWN -A procedure at 0x81b99db0 is set to execute every 60,000 milliseconds, a function at 0x81b934e0 is set to call when the system shuts down, and a function at 0x81b92d60 gets notified of all registry operations. This rootkit has clearly “planted some seeds” into the kernel of this victim system. At this point, you don’t know the name of its module, but you can see that the shutdown callback is associated with a driver named Driver�3621276. Given that information, you can seek more details with the driverscan plugin:
$ python vol.py -f spark.mem --profile=WinXPSP3x86 driverscan
Volatility Foundation Volatility Framework 2.4
Offset(P) #Ptr Start Size Service Key Driver Name
---------- ---- ---------- -------- ----------------- -----------
0x01e109b8 1 0x00000000 0x0 Driver�3621276 Driver�3621276
0x0214f4c8 1 0x00000000 0x0 Driver�3621275 Driver�3621275
[snip]According to this output, the starting address for the kernel module that created the suspect driver object is zero. It could be an anti-forensics technique to prevent analysts from dumping the malicious code. Indeed, it is working so far because to extract the module, you either need the module’s name or base address, and you already know that the name is not available. However, there are various pointers inside the malicious module’s code; you just need to find out where the PE file starts. You can do this with a little scripting inside volshell, using one of the following techniques:
- Take one of the addresses and scan backward looking for a valid MZ signature. If the malicious PE file has several other binaries embedded, the first result might not be the right one.
- Set your starting address somewhere between 20KB and 1MB behind the lowest pointer that you have; then walk forward looking for a valid MZ signature.
The following code shows how to perform the second method:
$ python vol.py -f spark.mem volshell

[snip]

>>> start = 0x81b99db0 - 0x100000
>>> end = 0x81b93690
>>> while start < end:
...   if addrspace().zread(start, 4) == "MZx90x00":
...     print hex(start)
...     break
...   start += 1
...
0x81b91b80You found an MZ signature at 0x81b91b80, which is about 8KB above the timers and callbacks procedures. You can also verify the PE header in volshell:
>>> db(0x81b91b80)
0x81b91b80  4d5a 9000 0300 0000 0400 0000 ffff 0000   MZ..............
0x81b91b90  b800 0000 0000 0000 4000 0000 0000 0000   ........@.......
0x81b91ba0  0000 0000 0000 0000 0000 0000 0000 0000   ................
0x81b91bb0  0000 0000 0000 0000 0000 0000 d000 0000   ................
0x81b91bc0  0e1f ba0e 00b4 09cd 21b8 014c cd21 5468   ........!..L.!Th
0x81b91bd0  6973 2070 726f 6772 616d 2063 616e 6e6f   is.program.canno
0x81b91be0  7420 6265 2072 756e 2069 6e20 444f 5320   t.be.run.in.DOS.
0x81b91bf0  6d6f 6465 2e0d 0d0a 2400 0000 0000 0000   mode....$.......
Finally, you can now supply a base address to the moddump plugin and extract the module from memory:
$ python vol.py -f spark.mem moddump -b 0x81b91b80 --dump-dir=OUTPUT
      --profile=WinXPSP3x86
Volatility Foundation Volatility Framework 2.4
Module Base Module Name          Result
----------- -------------------- ------
0x081b91b80 UNKNOWN              OK: driver.81b91b80.sys
You have to fix the ImageBase value in the PE header to match where you found it:
$ python
Python 2.7.6 (v2.7.6:3a1db0d2747e, Nov 10 2013, 00:42:54)
[GCC 4.2.1 (Apple Inc. build 5666) (dot 3)] on darwin
Type "help", "copyright", "credits" or "license" for more information.
>>> import pefile
>>> pe = pefile.PE("driver.81b91b80.sys")
>>> pe.OPTIONAL_HEADER.ImageBase = 0x81b91b80
>>> pe.write("driver.81b91b80.sys")
>>> quit()
The last thing you have to do before loading the file in IDA Pro is to generate labels for the API functions. Typically, IDA can parse the import address table and show API names properly, but it doesn’t expect to receive files dumped from memory after the import address table (IAT) is already patched. In these cases, you can run the impscan plugin with the base address of the suspect module and the command-line argument for the idc output format like this:
$ python vol.py -f spark.mem impscan --base=0x81b91b80 --output=idc
      --profile=WinXPSP3x86
Volatility Foundation Volatility Framework 2.4

MakeDword(0x81B9CB90);
MakeName(0x81B9CB90, "PsGetVersion");
MakeDword(0x81B9CB94);
MakeName(0x81B9CB94, "PsGetProcessImageFileName");
MakeDword(0x81B9CB98);
MakeName(0x81B9CB98, "ExAllocatePool");
MakeDword(0x81B9CB9C);
MakeName(0x81B9CB9C, "ZwWriteFile");
MakeDword(0x81B9CBA0);
MakeName(0x81B9CBA0, "ExFreePoolWithTag");
MakeDword(0x81B9CBA4);
MakeName(0x81B9CBA4, "ZwQueryInformationThread");
[snip]
With the dumped module open in IDA Pro, go to the File ⇒ Script Command and paste the output from the impscan plugin into the window. After following these steps, you should have a properly rebuilt binary, with accurate string references and API function names, as shown in Figure 13-9.
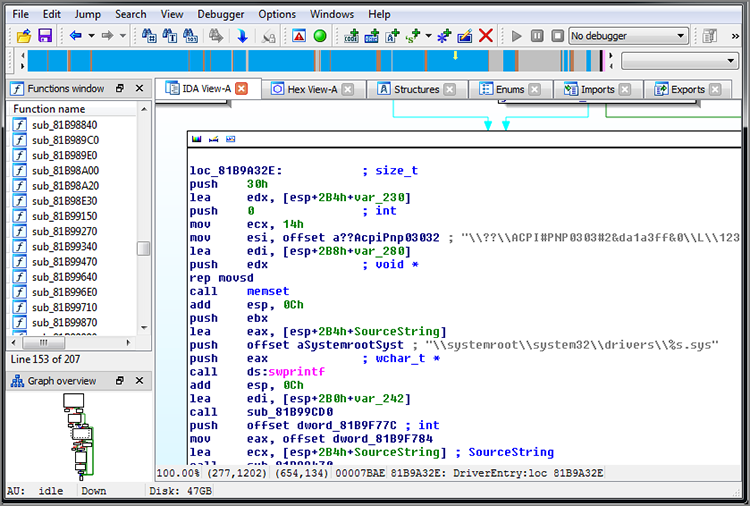
Figure 13-9: A kernel module loaded in IDA Pro after dumping it from memory and fixing its base address and imports
Depending on your goals, you might not always need to go this deep. We typically try to determine as much as possible about a rootkit’s behavior based on the artifacts that it leaves in the memory dump. However, some circumstances require reverse engineering to fully understand the code—and that can’t be avoided. Now you know how to approach those situations by combining memory forensics with static analysis tools.
Summary
Kernel land is a fascinating but broad aspect of memory analysis. There are countless ways to hide code in the kernel, alter operating system behaviors, and so on. Furthermore, many analysts are unfamiliar with the territory, which decreases their evidence-hunting capabilities. However, now you’ve been exposed to the most common methods as well as seen practical examples of detecting high-profile rootkits using memory forensics software. In general, malware that operates in the kernel remains in memory so that it can stay functional. Often, a functional requirement involves modifying a call table, installing a callback, or creating a new thread—all operations that leave artifacts for you to recover like a trail of breadcrumbs. Once you find the memory range(s) occupied by the malicious code and extract it, the rest is history!