
Chapter 23
Kernel Memory Artifacts
Many interesting data structures and artifacts that can be useful during the memory analysis process reside within kernel memory. In this chapter, you learn about some of the most commonly analyzed kernel artifacts, including the physical memory maps, kernel debug buffer, and loaded kernel modules. Whether you’re investigating a system compromised by a kernel-level rootkit or simply trying to prove which wireless networks or USB drives a system has recently been interacting with, the data in kernel memory can help you achieve these goals.
Physical Memory Maps
As described in Chapter 19, Linux maintains a mapping of which devices occupy regions of physical memory. The LiME acquisition tool uses this list to avoid accessing regions that don’t contain system RAM, and the fmem tool also indirectly utilizes the list when it calls the page_is_ram function. This section describes how to enumerate the physical memory maps and how you can use the information.
Hardware Resources
The linux_iomem plugin for Volatility displays memory regions in a similar manner as the cat /proc/iomem command on a live system. It begins at the root of the device tree (a global variable named iomem_resource) and enumerates all of the nodes, which are resource structures. Specifically, the plugin recursively walks the tree by processing the children and sibling pointers. The following shows the output of this plugin against the Debian sample:
$ python vol.py --profile=LinuxDebian-3_2x64 -f debian.lime linux_iomem
Volatility Foundation Volatility Framework 2.4
reserved                                0x0                     0xFFFF
System RAM                              0x10000                 0x9EFFF
reserved                                0x9F000                 0x9FFFF
PCI Bus 0000:00                         0xA0000                 0xBFFFF
Video ROM                               0xC0000                 0xC7FFF
reserved                                0xCA000                 0xCBFFF
  Adapter ROM                           0xCA000                 0xCAFFF
PCI Bus 0000:00                         0xCC000                 0xCFFFF
PCI Bus 0000:00                         0xD0000                 0xD3FFF
PCI Bus 0000:00                         0xD4000                 0xD7FFF
PCI Bus 0000:00                         0xD8000                 0xDBFFF
reserved                                0xDC000                 0xFFFFF
  System ROM                            0xc00f000                 0xFFFFF
System RAM                              0x100000                0x3FEDFFFF
  Kernel code                           0x1000000               0x1358B25
  Kernel data                           0x1358B26               0x1694D7F
  Kernel bss                            0x1729000               0x1806FFF
ACPI Tables                             0x3FEc00e000              0x3FEFEFFF
ACPI Non-volatile Storage               0x3FEFF000              0x3FEFFFFF
System RAM                              0x3FF00000              0x3FFFFFFF
PCI Bus 0000:00                         0xC0000000              0xFEBFFFFF
  0000:00:0f.0                          0xC0000000              0xC0007FFF
  0000:00:10.0                          0xC0008000              0xC000BFFF
  0000:00:07.7                          0xC8000000              0xC8001FFF
  0000:00:10.0                          0xC8020000              0xC803FFFF
[snip]
  IOAPIC 0                              0xFEC00000              0xFEC003FF
HPET 0                                  0xFED00000              0xFED003FF
  pnp 00:08                             0xFED00000              0xFED003FF
Local APIC                              0xFEE00000              0xFEE00FFF
  reserved                              0xFEE00000              0xFEE00FFF
[snip]
In this output, you can see several ranges, including where RAM is mapped (“System RAM”); where the kernel’s static code, data, and bss (uninitialized variables) are mapped; as well as hardware devices such as video cards, ACPI tables, and PCI buses.
You also can see the region where the Advanced Programmable Interrupt Controller (APIC) and IOAPIC are mapped. By default, they are mapped at static physical addresses, but the operating system can change them. Computers with multicore chips use the APIC architecture to handle hardware interrupts and other actions. Malware can hook the APIC data structures to redirect control flow of interrupts to attacker-controlled handler functions. Inspecting the memory maps can help you understand where the hooks are pointing and their impact on the system. Besides the APIC, a number of other hardware devices have also been targeted by malware, such as video cards and PCI network cards. Again, when hooks are placed in these regions, the resource structures can provide a good indication as to what device occupies the physical address range.
Verifying Acquisition Tools
As mentioned in Chapter 4, acquisition tools that interact with memory ranges reserved by devices and other hardware resources can cause memory corruption and/or system errors. By using the linux_iomem plugin on a memory sample, you can verify that the acquisition tool acquired the expected memory regions. To illustrate this, you will see an example of a memory sample collected with LiME, but you can also use the same approach to validate other tools that produce structured file formats.
The following output shows how you can use the limeinfo plugin to print the memory ranges that LiME captures:
$ python vol.py --profile=LinuxDebian-3_2x64 -f debian.lime limeinfo
Volatility Foundation Volatility Framework 2.4
Memory Start       Memory End         Size
------------------ ------------------ ------------------
0x0000000000010000 0x000000000009efff 0x000000000008f000
0x0000000000100000 0x000000003fedffff 0x000000003fdc00e000
0x000000003ff00000 0x000000003fffffff 0x0000000000100000
You see three ranges, and you are given the starting address, ending address, and size of each range. The next command shows how to use the linux_iomem plugin and filter the output to display only system RAM regions:
$ python vol.py --profile=LinuxDebian-3_2x64 -f debian.lime
    linux_iomem | grep "System RAM"
Volatility Foundation Volatility Framework 2.4
Resource Name          Start Address           End Address
System RAM             0x10000                 0x9EFFF
System RAM             0x100000                0x3FEDFFFF
System RAM             0x3FF00000              0x3FFFFFFF
If you compare the starting and ending addresses with the limeinfo output, you see they are same. This indicates that LiME collected the appropriate system RAM ranges. If extra ranges were collected, or if any system RAM ranges are missing, this would indicate that the tool might not have operated safely and accurately. The two main causes of this behavior are improper tool design and malicious interference. If you determine that the tool was not designed correctly (for example, a bug or miscalculation that causes it to omit ranges), you should consider no longer using the tool. On the other hand, if ranges were skipped due to malware manipulating the memory range structures, you can leverage those details to locate the “hidden” data.
Virtual Memory Maps
Linux reserves a number of areas in the virtual address space for storing specific data types. Similar to Windows, Linux sets a boundary between user and kernel memory. For example, on 32-bit systems, userland is the lower 3GB, and kernel mode is the upper 1GB. This means that the kernel mapping starts at 0xC0000000 and goes until the end of memory at 0xFFFFFFFF. On 64-bit systems, the kernel starts at 0xFFFFFFFF80000000. This split is illustrated in Figure 23-1, along with some of the labels you can apply to regions in kernel memory.
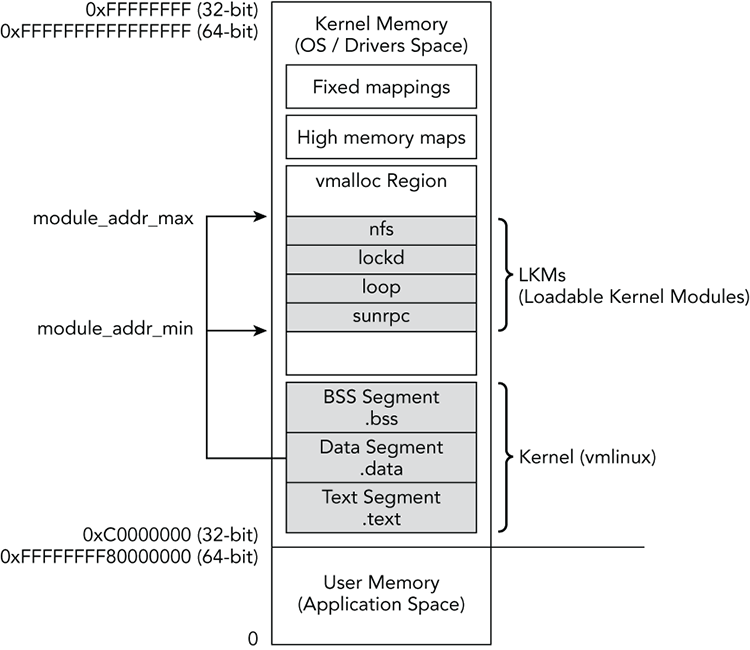
Figure 23-1: Layout of Linux virtual memory
As shown in the diagram, the beginning of the kernel address space starts with the mapping of the kernel, which includes the kernel’s executable code (.text), read/write data (.data), and uninitialized variables (.bss). You can find each of these segments in memory based on their corresponding symbols. For example, the text segment goes from _text to _etext, the data segment goes from _sdata to _edata, and the bss segment goes from __bss_start to __bss_end. The exact addresses are denoted in the linker script, but not computed until compile time, so they vary between systems. However, they’re populated within the System.map file, so you can always find them for a particular machine after you’ve built the profile.
You can see how the code segment symbols are used in the following code for Volatility:
1 def is_kernel_text(addr_space, addr):
2
3    profile = addr_space.obj_vm
4
5    text_start = profile.get_symbol("_text")
6    text_end = profile.get_symbol("_etext")
7
8    return (addr_space.address_compare(addr, text_start) != -1
9            and addr_space.address_compare(addr, text_end) == -1)
The is_kernel_text function can be called by plugins that want to determine whether an address is within the code segment of the kernel. As you will see in Chapter 26, certain functions, such as those that implement system calls, are located within the kernel’s code segment on a clean system, but are often overwritten and pointed elsewhere by malware. For example, the linux_check_syscall plugin walks each system call handler and uses similar logic as the is_kernel_text function to determine whether a handler is in a trusted region (assuming that the vmlinux file hasn’t been infected on disk or in memory).
Figure 23-1 shows the vmalloc area, which is used to store large, virtually contiguous regions, such as kernel modules, video card buffers, and swapped pages. The System.map file stores pointers to the start and end of the vmalloc area, which are VMALLOC_START and VMALLOC_END, respectively. You can also see the module_addr_min and module_addr_max variables stored within the data section of the kernel. These variables identify the memory range inside the vmalloc region that stores all loaded kernel modules. Thus, you can use them to find hidden modules (by scanning all memory within the range).
After the vmalloc area are the mappings of pages from high memory that the kernel needs to access. This reserved range is limited in size and stores mappings that need to exist for only a short period. This range can be located by resolving the PKMAP_BASE symbol. Finally, at the end of the address space are the fixed mappings of non-identity-mapped addresses. If you recall from the “Kernel Identity Paging” section of Chapter 20, the kernel maps some pages of memory in a way that easily converts physical addresses to virtual ones (and vice versa) by adding or subtracting a fixed offset value. Other pages, such as those reserved by hardware devices, depend on where the hardware is eventually mapped into physical memory. Once the system is running, you find these mappings in the region labeled “Fixed mappings” (the FIXADDR_START symbol) in Figure 23-1.
Kernel Debug Buffer
When drivers and kernel components write log messages, they store the messages within the kernel’s debug ring buffer inside of kernel memory. On a default Linux install, all users can read this buffer by typing the dmesg command. Some distributions lock this information down to the root account because it contains information that can be used in local privilege escalation exploits, as well as sensitive information belonging to users and/or hardware devices. One of the factors that determine what type of data you find in the log is whether the target system is a server or client (desktop/laptop). However, either way, there should be plenty of information kept within the debug buffers that can help you with forensics, incident response, and malware analysis.
The linux_dmesg plugin can recover the kernel debug buffer. For all kernel versions, the recovery process starts by locating the addresses of the log_buf and log_buf_len variables. As previously mentioned, because the format of the data depends on the kernel version, the plugin either prints the character array (before 3.5) or enumerates the log structures (3.5 and later).
The following shows the partial output of linux_dmesg for our Debian sample:
$ python vol.py --profile=LinuxDebian-3_2x64 -f debian.lime linux_dmesg
<6>[    0.000000] Initializing cgroup subsys cpu
<5>[    0.000000] Linux version 3.2.0-4-amd64 ([email protected])
(gcc version 4.6.3 (Debian 4.6.3-14) ) #1 SMP Debian 3.2.51-1
<6>[    0.000000] Command line: BOOT_IMAGE=/boot/vmlinuz-3.2.0-4-amd64
root=UUID=b2385703-e550-4736-a19f-c84e090e5a570e ro quiet
<6>[    0.000000] Disabled fast string operations
<6>[    0.000000] BIOS-provided physical RAM map:
<6>[    0.000000]  BIOS-e820: 0000000000000000 - 000000000009f000 (usable)
<6>[    0.000000]  BIOS-e820: 000000000009f000 - 00000000000a0000 (reserved)
<6>[    0.000000]  BIOS-e820: 00000000000ca000 - 00000000000cc000 (reserved)
<6>[    0.000000]  BIOS-e820: 00000000000dc000 - 0000000000100000 (reserved)
<6>[    0.000000]  BIOS-e820: 0000000000100000 - 000000003fec00e000 (usable)
<6>[    0.000000]  BIOS-e820: 000000003fec00e000 - 000000003feff000 (ACPI data)
<6>[    0.000000]  BIOS-e820: 000000003feff000 - 000000003ff00000 (ACPI NVS)
<6>[    0.000000]  BIOS-e820: 000000003ff00000 - 0000000040000000 (usable)
<6>[    0.000000]  BIOS-e820: 00000000e0000000 - 00000000f0000000 (reserved)
<6>[    0.000000]  BIOS-e820: 00000000fec00000 - 00000000fec10000 (reserved)
<6>[    0.000000]  BIOS-e820: 00000000fee00000 - 00000000fee01000 (reserved)
<6>[    0.000000]  BIOS-e820: 00000000fffc00e000 - 0000000100000000 (reserved)
<6>[    0.000000] NX (Execute Disable) protection: active
[snip]
<6>[    0.000000] found SMP MP-table at [ffff8800000f6bf0] f6bf0
<7>[    0.000000] initial memory mapped : 0 - 20000000
<7>[    0.000000] Base memory trampoline at [ffff88000009a000] 9a000 size 20480
<6>[    0.000000] init_memory_mapping: 0000000000000000-0000000040000000
<7>[    0.000000]  0000000000 - 0040000000 page 2M
<7>[    0.000000] kernel direct mapping tables up to 40000000@1fffe000-20000000
<6>[    0.000000] RAMDISK: 36c72000 - 37631000
<4>[    0.000000] ACPI: RSDP 00000000000f6b80 00024 (v02 PTLTD )
<4>[    0.000000] ACPI: XSDT 000000003feed65e 0005C (v01 INTEL  440BX
<4>[    0.000000] ACPI: FACP 000000003fefee98 000F4 (v04 INTEL  440BX
<4>[    0.000000] ACPI: DSDT 000000003feee366 10B32 (v01 PTLTD  Custom
<4>[    0.000000] ACPI: FACS 000000003fefffc0 00040
[snip]
<5>[    3.227662] sd 0:0:0:0: [sda] 41943040 512-byte logical blocks:
<5>[    3.227724] sd 0:0:0:0: [sda] Write Protect is off
<7>[    3.227726] sd 0:0:0:0: [sda] Mode Sense: 61 00 00 00
<5>[    3.227839] sd 0:0:0:0: [sda] Cache data unavailable
<3>[    3.227840] sd 0:0:0:0: [sda] Assuming drive cache: write through
<5>[    3.229167] sd 0:0:0:0: [sda] Cache data unavailable
<3>[    3.229169] sd 0:0:0:0: [sda] Assuming drive cache: write through
<6>[    3.265076]  sda: sda1 sda2 < sda5 >
<5>[    3.265942] sd 0:0:0:0: [sda] Cache data unavailable
<3>[    3.265944] sd 0:0:0:0: [sda] Assuming drive cache: write through
<5>[    3.266367] sd 0:0:0:0: [sda] Attached SCSI disk
<6>[    3.627793] EXT4-fs (sda1): mounted filesystem with ordered data mode.
<6>[   13.204927] Adding 901116k swap on /dev/sda5.  Priority:-1 extents:1
In this output, you can see information related to the physical memory mappings of the machine, hardware configuration information, and the main hard drive being initialized. Besides local hard drives, information can also be recorded about removable media and network share access:
<6> [ 40.621932] CIFS VFS: cifs_mount failed w/return code = -13This line shows cifs_mount failing with code -13, which means that the credentials given were incorrect. cifs is a file system driver used to access SMB network shares from Linux, and you can use these error codes to determine a user’s network share activity. The following shows output from another memory sample in which a USB thumb drive was used:
<6> [  143.110316] usb 4-4: new SuperSpeed USB device number 4 using xhci_hcd
<6> [  143.126899] usb 4-4: New USB device found, idVendor=125f, idProduct=312b
<6> [  143.126908] usb 4-4: New USB device strings: Mfr=1,
Product=2, SerialNumber=3
<6> [  143.126913] usb 4-4: Product: ADATA USB Flash Drive
<6> [  143.126916] usb 4-4: Manufacturer: ADATA
<6> [  143.126920] usb 4-4: SerialNumber: 23719051000100F8
In this output, you can see the serial number, make, model, and other identifying characteristics. You also have the timestamp associated with the device being introduced to the computer.
When connecting to wireless networks, information about the connections is recorded as well:
<6> [   55.947702] wlan0: authenticate with 00:24:9d:c8:a5:42
<6> [   55.957212] wlan0: send auth to 00:24:9d:c8:a5:42 (try 1/3)
<6> [   55.962997] wlan0: authenticated
<6> [   55.963319] iwlwifi 0000:04:00.0 wlan0: disabling HT as WMM/QoS is
not supported by the AP
<6> [   55.963328] iwlwifi 0000:04:00.0 wlan0: disabling VHT as WMM/QoS is
not supported by the AP
<6> [   55.964447] wlan0: associate with 00:24:9d:c8:a5:42 (try 1/3)
<6> [   55.966767] wlan0: RX AssocResp from 00:24:9d:c8:a5:42
(capab=0x411 status=0 aid=5)
<6> [   55.970763] wlan0: associated
In this output, you can see that the computer authenticated to a wireless router with a MAC address of 00:24:9d:c8:a5:42. If you encounter a computer with many failed wireless authentication attempts, you can look for other artifacts of the person trying to illegally access wireless networks.
Loaded Kernel Modules
Loadable kernel modules (LKMs) enable code to be dynamically inserted into the running operating system. Kernel modules are ELF files and are normally stored with a .ko extension. They can contain hardware drivers, file system implementations, security extensions, and more. The kernel module facility is also often abused by kernel-level rootkits to take control of the operating system. In this section, you learn how to locate and extract kernel modules. Later in the book, you will see a number of malicious LKMs that hook a variety of operating system data structures.
Enumerating LKMs
The linux_lsmod plugin enumerates kernel modules by walking the global list stored within the modules variable. For each module, it then prints out the name and size, similar to the way lsmod lists module information on a live machine. The following shows a partial output of linux_lsmod against our Debian memory sample:
$ python vol.py --profile=LinuxDebian-3_2x64 -f debian.lime linux_lsmod
Volatility Foundation Volatility Framework 2.4
lime 17991
nfsd 216170
nfs 308313
nfs_acl 12511
auth_rpcgss 37143
fscache 36739
lockd 67306
sunrpc 173730
loop 22641
coretemp 12898
crc32c_intel 12747
snd_ens1371 23250
snd_ac97_codec 106942
snd_rawmidi 23060
snd_seq_device 13176
[snip]
In the output, you can see the operating system uses a number of kernel modules. If you want to determine the arguments passed to a particular module at load, you can run linux_lsmod with the -P/--params flag set. If you focus this on the output related to the lime module, you see the following:
$ python vol.py --profile=LinuxDebian-3_2x64 -f debian.lime linux_lsmod -P
Volatility Foundation Volatility Framework 2.4
lime 17991
        format=lime
        dio=Y
        path=debian.lime
[snip]
If you remember from Chapter 19, the parameters given to the module were format=lime path=debian.lime. You can see both of those parameters reflected in the output as well as the default Y choice for LiME’s dio parameter. Many modules, including rootkits, accept command-line parameters for options such as filename prefixes to hide, configuration files, output directories, and so on. Thus, being able to recover this information can be very valuable to your investigation.
Extracting Kernel Modules
When you find a malicious rootkit, you often want to extract it for further analysis. The linux_moddump plugin is capable of extracting the memory resident sections of a module and creating an ELF file that contains them. Unfortunately, after initially loading the LKM, the kernel discards the ELF header. Furthermore, it stores only minimal information about the sections and subsequently patches the symbol table with runtime data. So the linux_moddump plugin must work backward and find the section headers first to re-create an ELF header that resembles the original. It must then populate section attributes and fix the mangled symbol table entries.
The following output shows you how to use the linux_lsmod plugin with the -S/--sections option. The sections of the module are populated from the sect_attrs member of the structure:
$ python vol.py --profile=LinuxDebian-3_2x64 -f debian.lime linux_lsmod -S
Volatility Foundation Volatility Framework 2.4
lime 17991
        .note.gnu.build-id             0xffffffffa0392000
        .text                          0xffffffffa0391000
        .rodata                        0xffffffffa0392024
        .rodata.str1.1                 0xffffffffa0392034
        __param                        0xffffffffa0392058
        .data                          0xffffffffa0393000
        .gnu.linkonce.this_module      0xffffffffa0393010
        .bss                           0xffffffffa0393260
        .symtab                        0xffffffffa0030000
        .strtab                        0xffffffffa00303c0
[snip]
The output shows the sections of the module loaded into memory and the address at which they are loaded. linux_moddump uses this information to find each section header to rebuild the section table. It also uses the address of where the section is stored in memory to recover the raw section contents. Unfortunately, this information is not complete, so the plugin must fill in some of the fields with padding. For example, the kernel does not maintain the section alignment after loading a module; but from testing a variety of systems, it appears that sections within the same pages are contiguously mapped.
The following output shows you how to use the linux_moddump plugin to dump the LiME kernel module. The -r/--regex option is used to tell the plugin to dump modules with lime in the name. The –D/--dump option specifies the output directory:
$ python vol.py --profile=LinuxDebian-3_2x64 -f debian.lime
    linux_moddump -D dump -r lime
Wrote 16707 bytes to lime.0xffffffffa0391000.lkm
Now you can use the file utility to verify that you have acquired a valid ELF file. At this point, you can also run any tools that analyze ELF files, such as readelf. Examples of these commands are shown here:
$ file dump/lime.0xffffffffa0391000.lkm
dump/lime.0xffffffffa0391000.lkm: ELF 64-bit LSB relocatable, x86-64,
version 1 (SYSV), BuildID[sha1]=0xb123de5e1638741a7c58f007fd7ae9d341bd0201bf,
not stripped

$ readelf -s dump/lime.0xffffffffa0391000.lkm
Symbol table '.symtab' contains 40 entries:
   Num:    Value          Size Type    Bind   Vis      Ndx Name
    <snip>
    13: 0000000000000000   318 FUNC    GLOBAL DEFAULT    2 setup_tcp
    14: ffffffff810f8c3c     0 NOTYPE  GLOBAL DEFAULT  UND filp_open
    15: ffffffff810fa6a3     0 NOTYPE  GLOBAL DEFAULT  UND vfs_write
    16: 0000000000000028     8 OBJECT  GLOBAL DEFAULT    8 path
    17: 0000000000000000   584 OBJECT  GLOBAL DEFAULT    7 __this_module
    18: 0000000000000000     4 OBJECT  GLOBAL DEFAULT    6 dio
    19: 0000000000000208   187 FUNC    GLOBAL DEFAULT    2 setup_disk
    20: 0000000000000628     1 FUNC    GLOBAL DEFAULT    2 cleanup_module
    21: 000000000000038b   669 FUNC    GLOBAL DEFAULT    2 init_module
    22: 0000000000000304   113 FUNC    GLOBAL DEFAULT    2 write_vaddr_disk
    23: ffffffff81046a3d     0 NOTYPE  GLOBAL DEFAULT  UND __stack_chk_fail
    24: 0000000000000195   113 FUNC    GLOBAL DEFAULT    2 write_vaddr_tcp
    25: ffffffff811b001c     0 NOTYPE  GLOBAL DEFAULT  UND strncmp
    26: fffffffc81f034dee5     0 NOTYPE  GLOBAL DEFAULT  UND _cond_resched
    27: 000000000000013e    87 FUNC    GLOBAL DEFAULT    2 cleanup_tcp
    28: fffffffc81f027ed10     0 NOTYPE  GLOBAL DEFAULT  UND sock_sendmsg
    29: ffffffff811b2a37     0 NOTYPE  GLOBAL DEFAULT  UND sscanf
    30: fffffffc81f061caf0     0 NOTYPE  GLOBAL DEFAULT  UND param_ops_charp
    <snip>
Additionally, the LKM is created in a manner that allows for IDA Pro and other reversing tools to correctly analyze the file, as shown in Figure 23-2.

Figure 23-2: Loading the extracted LKM into IDA Pro
In Chapter 26 you learn how to find and analyze kernel rootkits. Part of this process is using linux_moddump to recover malicious LKMs to determine their effects on the system.
Summary
Because the kernel plays such an important role in the security and overall functionality of the system, you can frequently find valuable evidence in kernel memory. Understanding the layout of physical and virtual memory gives you the capability to associate addresses with specific hardware devices, loaded kernel modules, and so on. The kernel debug buffer provides information that can help you determine if (and when) removable media was inserted into a computer and which wireless networks a system joined. These details can help you identify how users exfiltrated data and what sites they physically visited with the computer system. You can also list and extract loaded kernel modules, which is a major step in malware analysis and rootkit investigations, as you will see in the upcoming chapters.