Companies are keen to measure the spending and value that customers like Mary are actually worth. Traditional methods of customer lifetime value (CLV) have to be augmented to measure engagement and word of mouth (WOM) values as well.
We have seen that customers today have more power than in the past because they have more information and control over the communications, but in return willingly give more data to companies. This chapter looks at value created both for customers and companies and how it can be capitalized for mutual benefit.
Traditionally, companies have attempted to measure value by assessing customer acquisition, retention, and loyalty through measures like customer equity and CLV. These in turn are based on measures like sales revenue, profitability, market share, and depend on the transactional nature of customer relationships.
In addition to transactional data, companies now have access to data streaming from social media, location data from sensors, digital data from browsing habits, and traditional market data. Real-time analytics combine traditional metrics and social data with data from multiple sources to yield marketing information. The various types of data and its measurement are summed up in Table 7.1.
Table 7.1 How different types of data contribute to customer value measurement
|
Transactional data |
What a customer is buying and at what time Measuring recency, frequency, and monetary value (RFM) Patterns of purchase Customer acquisition, customer activity, customer win-back Share of the wallet, CLV |
|
Location data |
Age, income, social status, leading to better market segmentation Microtargeting consumers |
|
Digital data |
Search engine data, browsing habits, e-mail |
|
Social data |
Analyses of posts on social media, tracking likes, dislikes, comments, brand shares Personal data for microtargeting Customer referrals, influence, engagement value Sentiment analysis |
|
Sensor data |
Weather, volumes, sales forecasting, in-store behavior of customers Geo-targeted advertising Product operating information from customer sites |
|
Marketing data |
Market share, sales growth, segmentwise sales analysis |
Traditional metrics are available faster, and moreover, the data can be analyzed better slicing and dicing it through better tools. New metrics can be developed by using the streaming data that helps in managerial decision making. Both traditional metrics and contemporary metrics are summed up in Figure 7.1. Companies can make dashboards for various functions and monitor data in real time.
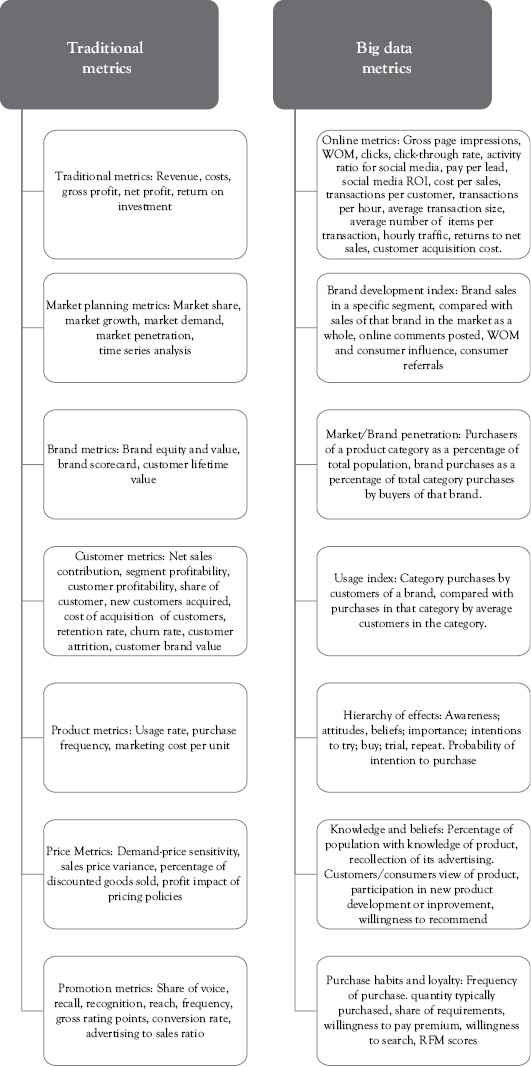
Figure 7.1 Traditional metrics and real-time data analytics
We, therefore, need better metrics to measure all these data that are available today. A big challenge is to measure social data, which is qualitative in nature but which holds the key to understanding consumer behavior.
Measuring Social Data
A big advancement in consumer data metrics is tracking social information that people willingly share on social media sites. This is the key to understand consumer engagement. Increasingly, social content measuring systems are becoming available for companies to track this vast and wild space. Some common tools to monitor social media involve tracking engagement, reach, and consumptions.
Engagement shows the number of people who are engaged with the brand’s online activities. This figure gives an indication whether the audience is actively involved with the brand or not and shows the following:
- The brand’s ability to capture users’ attention;
- Effectiveness and relevance of the brand’s content; and
- The number of people who see and share the content.
Engagement leads to increased brand awareness, because consumers’ actions appear in their social media posts, making the brand visible to their friends. Engagement also gives an indication about the types of content that the audience is interested in. This helps in creating such content that is liked by target customers, and also provides insights into the interests of consumers.
Engagement and engagement rate can be calculated as follows:
Engagement = likes (or website registrations) + comments + shares
Engagement rate = total engagement (likes + comments + shares)/total fans
Engagement rate is calculated by expressing the number of people who liked, commented, tweeted, shared, or clicked on a brand post as a percentage of the number of people who saw the post. It helps to measure a company’s effectiveness at engaging the audience. It shows the types of posts that are most likely to be shared or commented upon and the quality of content created.
Reach shows the number of unique people who have seen the content. There are three types of reach: organic, paid, and viral. Organic reach refers to the number of unique people who see the content on their own. Paid reach is the number of unique people who clicked on advertisements or paid content. Viral reach refers to the number of unique people who saw the post mentioned in a post published by a friend.
Measuring reach by type can help companies pinpoint the factors that contributed to content views. Organic reach is the result of increase in number of fans or their increased engagement. Viral reach shows whether the content interested the consumer enough to be shared by them. Paid reach shows how effective the ads are. Reach shows the brand’s effective audience and is a more accurate measure than views.
Impressions are the number of times the brand content is displayed and seen by consumers.
Organic impressions refer to the number of times the content was displayed in a user’s page. Paid impressions consist of the number of times the content was displayed as a result of online advertisements. Viral impressions show the number of times content was shared or commented upon by a friend: it shows liking, commenting, sharing, or answering a question or responding to an event. The key difference between impressions and reach is that impressions measure the number of times the content was displayed, while reach measures the number of unique people who saw the content.
Stories include updates from friends, including likes, engagement, sharing, joining, tagging, and so on.
Stories associated with a brand show how posts are effective in driving awareness for brand content.
Consumptions consist of clicks anywhere in the post. Clicks can be on links, photos, videos, and so on. Measuring the number of clicks on posts provides a complete view of engagement as it shows what users are interested in. The click-through rate for each post or content type allows a company to measure the frequency of engagement with its content. The people who click on any of the posts are called consumers. They can be segmented by the type of engagement action taken.
Sources are the locations of people who liked the brand or content or who registered on a website. Sources can be viewed on the brand’s page, ads, or posts.
These analytics help in the following ways:
- Measure the audience actually reached: Reach, which measures the unique number of people who saw the content, can give a good idea of the audience who saw the content.
- Analyze engaged users: Engaged users are the people who took action on the content. Companies should try to grow this audience.
- Create context for fan growth: New fan growth serves as a community health indicator and to organically increase audience size too.
- Identify engaged customers: Location metrics help to identify engaged customers. Their demographics provide precise information about them.
- Discover when customers are most active: When people interact with brands gives an indication to companies as to when is the best time to reach them. This helps to cater precisely to market needs.
However, the limitation of tracking social media by the above methods is that it measures audience reactions to content rather than marketing and sales. Post an interesting or funny video, for instance, and people will see it, share it, and rave about it—but will they buy the product the next time? Indeed, the usage of the word customers in the above context is wrong, since people who are engaged with brands online may, in fact, never buy the product. The above measures of engagement merely show whether the content posted by a company is liked by people or not. The only advantage that companies can gain out of such social media tracking is that the brand becomes known and may be considered if and when the person wants to buy the product. What is required is quantifying new visitors who selected the brand because of the content seen. It is here that big data analytics can help, as it goes beyond measuring the response to brand content.
Market Research and Big Data
Big data analysis consists of tracking much more than social media. It involves tracking data from diverse sources using advanced tools. Court, Gordon, and Perrey (2012) write that companies have to ask some basic questions so as to improve returns on marketing spending. These questions relate to the following:
- Finding the exact influences on consumers;
- Financial efficiency in marketing plans—how accurately are they hitting a small, moving target with highly focused messages;
- Monitoring how fast the organization is responding to customer comments; and
- Measuring the impact of multiple communication and marketing channels.
Because of data-based marketing, companies can quantify and measure—often in real time—the results and impact of their efforts. Earlier, managers had to wait for a few months to find out how their efforts impacted markets and consumers, which could only be known when the monthly or quarterly sales figures came in. Similarly, how consumers reacted to products could only be known through extensive surveys which not only took time but also suffered from researcher or consumer bias. Today, however, every action can be assessed almost immediately, as Nestlé’s DAT initiative shows (Exhibit 7.1). A product, its usage, or a promotion scheme can be tracked, for instance, by monitoring social media and tracking how many people are talking about it or sharing it with their friends. Similarly, by linking segmentation data with logistics and supply chains, a company can know how well different groups of customers are being served.
Nestlé’s Digital Acceleration and the Human Element
Nestlé is a global food company with over 2,000 brands, including such household names like KitKat and Nescafé. With such well-known brands, it faced the problem of tracking what consumers were saying about it: The task involved monitoring 170 million fans across social media sites. How could the company possibly track and respond to what these fans were posting about the company and, that too, all the time?
To do this, the company has set up a digital acceleration team (DAT) at its headquarters in Vevey, Switzerland, to monitor conversations about its products on social media. Online sentiment is tracked in real time on screens showing how people respond to its brands. It also trains its marketing leaders from around the world in an eight month program in digital and social media. Through an entrepreneurial and open-source setting, they learn to manage communities for the company’s global brands. After training and thought leadership, they go back to work in digital or traditional marketing, carrying what Pete Blackshaw, global head of digital marketing and social media at Nestlé, calls digital vitamins.
The DAT has four principles: listening, engaging, transforming, and inspiring. Using a social content management system with tools such as Buddy Media, Vitrue, or Wildfire, the company is able to monitor the wild space of social media. Apart from tracking brands, it engages in community management and content production. Through its training, the company produces next-generation brand leadership—global brand managers who understand both brand fundamentals
and digital engagement. DATs have been established in India, Italy, China, and other countries.
Tracking consumer digitally also helps in the following:
Publicity: The teams at DAT help generate publicity online. A French team member, for instance, developed an app that plays a cookery video when a package code is scanned. Perrier sales were helped by a video which became popular on YouTube, with the storyline: To save a melting world, a glamorous woman drinks Perrier.
Adaptive marketing: Adaptive marketing is using real-time signals to create and modify marketing inputs. Tracking consumers digitally helps in experimentation, quick execution, and changing gears to maximize marketing return on investment (ROI). Nestlé’s brands are thus changing from mass marketing approaches to social—they sense consumer sentiment and respond to it. The company realizes that consumers want to engage with brands on social platforms, and DAT helps in this.
Dealing with negative publicity: Digital acceleration helps to tackle negative comments posted by consumers. Nestlé has faced consumer anger for its use of palm oil (leading to destruction of rain forests) and its water bottling business (exploiting free goods), reports Reuters (Thomasson 2012). Ignoring such issues tends to make them larger: the press amplifies them, and they are shown in search results across the world. DAT monitors negative comments about the company’s brands as they are posted: the center’s screens turn red if a negative issue is emerging, alerting the teams to engage and respond when a high number of negative comments are being posted online.
Connecting internal social media: Nestlé has one of the largest internal social networks with 200,000 users. It has created communities such as Winning with Mobile and best online listening practices. Recruitment and relationship building are facilitated through such platforms. This also creates agility and flexibility in the system.
However, technology only goes thus far. Finally, it is human element that makes a difference. In 2015, Nestlé faced a disaster as its best selling noodles brand, Maggi, was found to contain excessive levels of harmful substances. The company failed to respond in the first few days and let the crisis balloon. As a consequence, the brand had to be withdrawn from the market, showing the human failure despite its data analysis capabilities.
To be effective, marketing metrics must meet the following three requirements:
- First, the ability to link a company’s internal operating system with streaming data from outside. This involves breaking silos and developing networks of influence and collaboration.
- Second, the need to use the present market research tools to develop new tools to meet the needs of high volume, high velocity, and high variety data.
- Third, the need to bridge the data creativity link so that human creativity continues to drive marketing with the appropriate data rather than reducing marketing to a mere set of numbers.
As we have mentioned earlier, this calls for complete transformation of the business model. Once they are geared toward making full use of data, they must develop marketing metrics which give quantitative indicators that help in achieving:
- Focus: Metrics serve to measure marketing and advertising objectives, and thereby provide the direction and focus needed on key performance criteria. While earlier, the focus had mostly been on financial results like sales and profitability, today it has shifted to consumer engagement, branding, and discovering drivers of consumer action.
- Better vision: Monitoring data gives better vision to companies, or provides them the ability to spot threats and opportunities faster.
- Better decisions: Tracking metrics helps in making better decisions. Managers need not rely on intuition or whims, but on firm evidence.
- Better performance: Big data drives profitability. Companies in the top third of their industry in the use of data-driven decision making were, on average, 5 percent more productive and 6 percent more profitable than their competitors, shows a research conducted by Andrew McAfee and Erik Brynjolfsson (2012).
Using big data metrics requires radical changes in the way companies are organized and managed. This change in thinking and approach has to percolate at all levels of organizations. Yoram Wind (2008) gives seven strategies that serve to increase the rigor and relevance of marketing research in times of big data.
- Bridge disciplinary silos: Big data marketing and metrics entail breaking down of disciplinary silos in organizations. Integrating functional departments is not only essential to deliver customer experience but also to measure marketing ROI. “Markets can be seen through either a behavioral or quantitative lens, but as with binocular vision, we gain more depth when we look through both,” writes Wind. There is need, therefore, to bridge the great divide between behavioral and quantitative approaches. Second, marketing and other disciplines too have to break down barriers between them. Technology experts, for instance, have to work with marketing managers to develop systems that serve one or the other objectives of serving customers. Third, sophisticated models of data-driven results must not obfuscate the need for creativity, intuition, and subjective judgment, so essentially required in marketing.
- Network orchestration: The shift toward network orchestration from traditional management thinking requires another big shift in approach: Managements have to develop capabilities to build and manage networks, called network orchestration. Instead of optimizing the company, managers have to think about optimizing both the company and its network, since competition is increasingly network against network. Further, instead of strong control systems that exist in hierarchal organizations, managers must learn to rely on empowered employees, partners, and customers.
- Customer managed relationships (CMR). Through traditional customer relationship management (CRM), companies try to make relationships with their customers. But the connected era requires a shift to CMR, that is, to encourage customers to develop their own relationships with companies through platforms that allow customers to engage with them. Sites that encourage customers to post reviews on hotels, movies, and travel do not focus on selling products, for instance, but give consumers power to publish their views and thereby get involved with the sites.
- Customer branding. Brand power is increasingly shifting into the hands of consumers. Companies have to let brands evolve through codeveloping, coproducing, and comarketing with their customers. This may be difficult for managers and companies who have the mindset of controlling their brands, but the trend is growing.
- Real-time analytics and metrics. New measures to track and evaluate investments in marketing are needed, and these are provided through analytics. Real-time data provides changes in consumer sentiment as it happens. Further, data analysis looks at drivers of consumer behavior and changes in RFM scores as they happen in real time.
- Adaptive experimentation: Adaptive experimentation combines research and action: Companies conduct marketing experiments and immediately incorporate the creative insights and perspectives generated into action.
- Challenge mental models: Finally, there is an urgent need to change old mental models for marketing. Empowered consumers have never existed before, so managers need to change mental models to comprehend and utilize this radical shift in marketplace.
The above shows a huge shift in thinking in company managements, which is essential if companies have to manage the many ways in which customers add value to them.
Some companies have indeed succeeded in breaking traditional marketing mindsets and are using data analytics creatively for many diverse tasks.
Target: An article in The New York Times (Duhigg 2012) shows how Target uses data. It records all consumer activity by an individual: using credit cards, coupons, surveys, refunds, calling the customer helpline, e-mail, and visits to the website, linked to demographic information such as age, family size, location, salary, and online behavior. Using easily available data, it can know about ethnicity, job history, magazines read, financial history, personal life, and topics that interest individuals. Using predictive analytics, it knows not just a person’s shopping habits but also what he or she is going to need next, developing a basis of efficient marketing and micro targeting.
eBay: eBay conducts a wide variety of activities such as machine learning, data mining, economics, user behavior analytics, information retrieval, and visualization using big data. Data from a wide variety are integrated: user, user behavior, transaction, items, feedback, and searches.
GE: GE uses big data analytics to predict the maintenance needs of its jet engines, turbines, and medical scanners. It is using operational data from sensors on its machinery and engines for pattern analysis.
Amazon: Amazon mastered the recommendation of books, toys, or kitchen utensils that their customers might be interested in. Other companies have followed suit, such as recommending music on Spotify, movies on Netflix, or pins on Pinterest.
Delta Airlines: Delta Airlines identified customers’ pain points: All airlines know a top concern for passengers is lost baggage. The company looked further into their data and created a solution that would remove the uncertainty of where a passenger’s bag might be. Customers can now snap a photo of their baggage tag using the Track My Bag feature on the Delta app and then keep tabs on their luggage as it makes its way to the final destination. Even if a bag does not make it on the intended flight, passengers save time tracking it down.
As shown by the aforesaid examples, leveraging big data capabilities can help to form instant strategy decision, spur innovation, inspire new product and services so on, and build competitive advantages besides building customer relationships. Capturing and measuring this value calls for new approaches that are described in the next section.
Measuring Customer Value
Modern times require that companies harness data from multiple sources and monitor them simultaneously, writes Kevin Lindsay (2014). The key performance indicators must be measured across multiple internal and external sources. For example, Lenovo analyzed consumer satisfaction to find out why people were phoning the call center. By analyzing data from six sources, the Web, postpurchase surveys, CRM system, call center, e-mail, and live chat, it could find out the issues that customers called for. This was rectified by providing better content on its website, and the company was able to reduce customer calls and dissatisfaction arising out of call waiting time.
All metrics have to be focused on deriving lifetime value. Roland Rust and his colleagues (2010) explain, “Companies must shift their focus from driving transactions to maximizing customer lifetime value.”
A number of metrics are drawn together into dashboards that give an integrated picture of marketing events as they happen. Real-time metrics can be monitored through dashboards, enabling the linking of marketing to other departments or activities. A customer’s decision journey, for instance, can be tracked by a dashboard that shows how he or she was influenced, then following the order within the company to logistics till it is received. This simple journey requires linking together data from multiple sources, but gives information on how quickly the company responds to customers and how satisfied they are. Finally, the impact of monitoring the consumer decision journey is measured on sales, profitability, and growth. In other words, marketing activities related to influencing consumers can be directly linked to profitability.
Customer Engagement Value
A method is needed to put a value to the many ways that customers add value to a firm or destroy value by posting negative comments and reviews. One measure is suggested by Kumar et al. (2010), which is the customer engagement value (CEV). According to the authors, CEV offers a complete measure of how much a customer contributes to the value of the firm in terms of four components:
- CLV: CLV is a commonly used indicator and is calculated as the sum of the present value of future profits generated from customers over their lifetime. It helps companies to estimate about the future profitability of individual customers and the products that must be launched to meet their needs as they move from one stage of their consumption to another. It also measures purchases made by individual consumers and provides stimulus for building loyalty and repeat purchases. Since CLV is the sum of purchases by consumers, it also provides opportunities for up-selling and cross-selling. The metrics used for CLV are share of the wallet and the present value of expected lifetime spends of customers acquired.
- Customer referral value (CRV): When customers influence their friends and family members through sharing of experiences and positive comments, they add value to the firm. Companies encourage such behavior by rewarding existing customers to bring in their friends and acquaintances through referral programs. CRV measures the value of such referrals by estimating the number of successful referrals, or new profitable customers that existing customers add. CRV is calculated as the number of customers acquired through referrals and their expected lifetime values.
- Customer influencer value (CIV): Consumers influence others either directly by persuading and converting acquaintances into customers or indirectly by persuading strangers to adopt products when they see someone using the product or brand. New products can get a boost by direct and indirect customer influence, which adds to a person’s CIV. Firms can estimate their CIV by quantifying the number of reviews posted, the number and lifetime value of customers acquired from influence, opinion leadership through the number of followers, and use of social media and blogs.
- Customer knowledge value (CKV): Another way that customers
add value to the company is by participating in knowledge development—that is, when they participate in developing new products or provide other kinds of feedback that helps company know insights into behavior or usage. For instance, market research becomes much easier when customers voluntarily share information, as opposed to undertaking expensive surveys. Brand communities encourage sharing of knowledge to those who participate in them through common problem solving and having product-related discussions. Ideas contributed by customers for improving existing products and service delivery also add value to firms. The metrics used for CKV are the number of meaningful interactions with the company, suggestions and participation in new product development by customers and its value.
In the era of the connected consumer, both brand awareness and brand image are a function of referrals, influence, and knowledge.
Calculating Customer Equity
Customer equity can be measured in several ways. The traditional measure is CLV, which gives the lifetime value of customers. But new methods are needed. The share of the wallet, voice of the customer (VOC), and WOM equity approaches are given below.
Customer Lifetime Value
CLV is the total combined expected CLVs of all of a company’s customers. It is calculated by estimating the expected contribution of customers over their expected life and discounting the values to a net present value and summing them up. It is shown mathematically as

where pt = price paid by customer, ct = cost of servicing customer,
i = discount rate, and AC = acquisition cost.
Share of the Wallet
Keiningham et al. (2011) give the concept of the share of the wallet, which calculates the percentage of a customer’s spending of a brand within a category of products.
Voice of the Customer
The VOC approach measures a customer’s feedback about his experiences with products or services. It gathers multisource information about consumer conversations about brands and products online, such as blogs, forums, wikis, and other spaces, which can be done through natural language analysis and text processing from social media channels. VOC analytics shows actionable insights on a dashboard. The VOC approach can give deep insights about customer preferences, their feedback, trends, and early warnings from social media conversations. It is based on three activities:
- Listen: Social conversations about the brand or company;
- Analyze: Identify root causes and sentiments; and
- Correlate: Combine with internal data and surveys to give feedback and actionable points.
WOM Equity
Bughin, Doogan, and Vetvik (2010) show that WOM equity should be calculated by companies. It is given by multiplying average sales impact of a brand message by the number of WOM messages. The sales impact is based on three things: what is said, who says it, and where it is said. Companies assign scores on the type of messages posted, the influence of the person who posts the message, and the context in which it is said. WOM equity measurement helps companies to test the effectiveness of how brand messages are created and shared.
By developing metrics for different aspects of engagement, firms arrive at a measure to estimate the sources of value of their connected customers: their profitability, the value of their referrals, influence, and the contribution they make toward improving existing products or ideas for new product development.
Newer metrics will be developed to measure customer value. “Measuring value in the era of the connected customer requires that we measure share of hearts, minds, and markets,” write Farris et al. (2006) in their book, Marketing Metrics: 50 + Metrics Every Executive Should Master. It involves measuring customer perceptions, market share, and competitive analysis. Transactional data, combined with market segment data, sensor data, and consumer data delivers a comprehensive dashboard that helps measure marketing ROI.