
CHAPTER
TWENTY
EMERGING MARKETS DEBT
Director
Merrill Lynch
Emerging markets are comprised of nations whose economies are viewed as developing, or emerging, from underdevelopment. It usually includes most or all of Africa, eastern Europe, Latin America, Russia, the Middle East, and Asia (excluding Japan). Additionally, some investors use credit rating as a criterion, viewing an investment-grade credit rating as an indication that the country has fully emerged. Some of these emerging economies are heavily dependent on commodity exports, whereas others have extensive service and manufacturing sectors. Emerging markets debt includes sovereign bonds and loans issued by governments, as well as fixed income securities issued by public and private companies in emerging market countries. The assets could be denominated in any currency. Many of these countries had defaulted on bank loans in the 1980s and began the 1990s by converting defaulted commercial bank loans to restructured sovereign bonds, known as Brady bonds. While the early to middle 1990s might be thought of as the era of defaulted loans to global restructurings, the late 1990s onward will be thought of as the era of defaulted bonds to new bond restructurings. We discuss the defaults, restructurings, and current status of the asset class.
THE DEBT UNIVERSE
Emerging markets tradable debt stock is over US$3 trillion. The tradable debt universe expanded throughout the 1990s, but the rate of growth of debt generally was slower than the annualized growth rate of the economies. This is partly due to a collective improvement in fiscal stances throughout emerging markets that led to a reduced need to borrow.
This chapter was prepared in 2005 and is reprinted from the seventh edition.
I would like to thank Ryan McDuffy and Manmohan Singh for their review and helpful comments.
Domestic versus External Debt
Domestic debt is issued locally under the local laws of the country in which it is issued, whereas external debt is issued externally under the laws of a foreign country. Domestic debt comprises 77% of the total emerging markets tradable debt universe. The lower liquidity, frequent investment restrictions, varied practices, and higher convertibility risk make trading in domestic bonds more difficult for foreign investors than trading in external bonds. As a result, most emerging market investments by foreign holders are concentrated in external debt.
Among external bonds, the majority are sovereign bonds. The outstanding face value of external sovereign bonds in the market has reached US$440 billion as of year end 2003, with the vast majority of growth through issuance of global bonds or Eurobonds, terms that are often used interchangeably.1 At the same time, the outstanding face value of sovereign Brady bonds has declined from US$170 billion to US$42 billion as a number of governments have either retired their more expensive Brady debt or defaulted.
Debt Stock by Region
Latin America and Asia continue to dominate the external tradable debt universe. Tradable debt excludes nontradable debt such as International Monetary Fund (IMF) loans but is not necessarily liquid debt. Tradable debt should not necessarily be considered debt qualifying for benchmark indexes because the latter has an additional requirement of liquidity for valuation purposes. Since 1999, the regional breakdown of outstanding debt has been relatively stable. Latin America now represents 48% of total debt outstanding; Asia, 25%; emerging Europe, 20%; and the Middle East and Africa, 7%. In the case of Latin America, high sovereign refinancing needs have resulted in higher levels of new issuance, and corporate borrowers continue to gain access to the international capital markets. In Asia, as countries have repaid emergency multilateral financing packages, they have issued increasing amounts of domestic bonds relative to external bonds, causing domestic debt to comprise 89% of the outstanding emerging Asian debt. In contrast, domestic debt is only 57% of the outstanding debt in Latin America. While the majority of external sovereign debt is from Latin America, domestic debt is large in both Latin America and Asia.
Diversification of Issuers
Since the early 1990s, there has been an expansion of the stock of external debt in terms of both the amount of debt per country and the number of countries issuing external debt. External debt issuance since 1996 has been running at an average rate of about US$70 billion annually compared with about US$30 billion during the early 1990s. Over half the issuance is sovereign debt. The increase in the number of issuing countries has been beneficial to investors seeking diversification whose investment performance is benchmarked against an index, because it has reduced the concentration of the largest countries in any of the major emerging market indexes. The major market indexes typically are comprised of outstanding external sovereign debt with sufficient liquidity to provide daily pricing. External bonds have few trading restrictions and therefore are of greatest interest to nonlocal investors. In contrast, local bonds in many countries have trading restrictions, preventing foreign investors from easily entering or exiting the market. In addition, sovereign bonds are more liquid than most corporate bonds and offer more accurate index valuation. In the last few years, investors have become increasingly interested in local currency investments, and such local market indexes are beginning to play a role in the asset class as well.
Since 1991 when the external debt market indexes began, the number of emerging market countries has increased from 4 to over 35. This was a result of large countries with bank loans converting those loans to bonds and smaller countries beginning to tap the external debt markets. For example, the Merrill Lynch Emerging Markets Sovereign Plus Index (IGOV) includes all emerging countries rated BBB+ or below and currently has a face value of about US$238 billion as of 2004. In this index, the five largest countries comprised 98% of the index in 1993 but only 66% over a decade later.
While 98% of the market capitalization at inception of the IGOV was concentrated in Latin America, over the last 12 years, eastern European, African, Middle Eastern, and Asian markets have gained market share. This has left Latin America with only 58% of both the face value and market capitalization of external debt qualifying for index inclusion. A similar diversification phenomenon is true of other major dealers’ external debt indexes.
Quality of Emerging Market Countries
Emerging markets as an asset class actually have improved in credit quality. It is now a diverse asset class ranging from investment-grade credits to defaulted debt. The asset class was created from weak economies that were struggling to improve after the 1980s. Many countries have pursued macroeconomic policies that allow them to better weather external shocks and reduce their sensitivity to changes in capital flows; their credit quality has improved as a result.
Despite the difficulties surrounding the Russian default in late 1998, there have been many more positive than negative ratings actions since 1998. Emerging market indexes retain many of the improved countries owing to their historical presence in the asset class. Thus the percentage of investment-grade bonds in the major benchmark indexes has risen from about 8% in 1997 to a much larger representation in the 25% to 50% range depending on the particular index. The average credit quality also rose a notch from BB–/Ba3 to BB/Ba2.
The Investor Base
As a result of the growth of emerging markets debt and excess historical returns, the profile of the emerging markets’ sovereign investor base has become more diverse. Ownership was once concentrated in the hands of a few creditor banks and dealers but now is distributed more widely through actively traded global bonds.
Thirty years ago, emerging markets debt was in the form of loans from commercial banks. In the 1980s, intermarket dealers traded participations in those loans. Originally, the principal nonbank investors were high-net-worth individuals from emerging markets countries. They were the first to realize that these countries had begun to “turn the corner,” and in the late 1980s, they began to repatriate their funds by buying distressed assets. This, in turn, triggered a steady recovery in asset values, which was further supported by the subsequent issuance of Brady bonds.
The high returns on these bonds increasingly attracted institutional interest. The first institutional investors were the more aggressive fund managers (hedge funds, global growth funds, dedicated emerging markets funds, etc.) and broker-dealers (including major Wall Street firms and several of the original lending banks that had participated in the Brady exchange). Soon after, “crossover” investors from the domestic high-yield bond market (where yields were no longer as attractive) began to view emerging markets as an asset class to include in their portfolios (see Exhibit 20–1).
EXHIBIT 20–1
Emerging Markets and U.S. High-Yield Spreads (Basis Points)
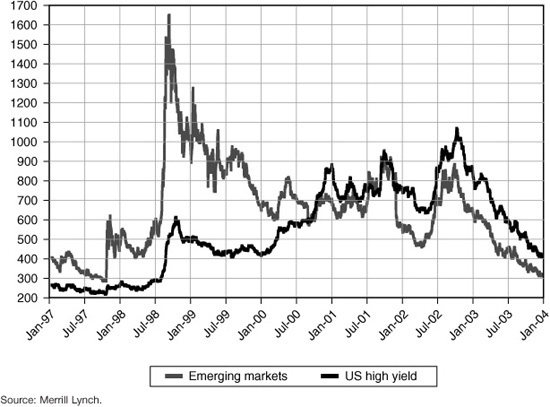
With the upgrade of Poland’s Brady bonds to investment-grade in 1996, U.S. corporate, Asian, and European investors became interested as well. The subsequent upgrades of Mexico and Korea to investment-grade in 2000 and 2002 upgraded the asset class still further, with substantial high-grade investors then comfortably crossing over into emerging markets debt. Higher returns play a key role as well. Emerging markets outperformed, with a 41% return in 1996, bringing in more investors.
After the Asian financial crisis of 1997 and the Russian debacle in the summer of 1998, capital flows to emerging markets diminished drastically. Investors quickly reduced their willingness to assume risk (flight to quality) and deserted higher-yielding assets for safer, more liquid bonds. The fear of contagion only worsened the financial crisis because developing countries were unable to raise new financing in the international capital markets. With global markets under severe pressure, the hedge-fund community collapsed and was forced to liquidate, resulting in massive price declines.
In succeeding years, however, the market has matured, as evidenced by the increase in the quality of the investor base and of the issuer base. Liquidity has improved, and volatility has declined. In addition, despite the size of Argentina’s default, most of the countries “decoupled” from contagion during the year prior to its collapse, lending confidence to investors that some crises can be avoided.
As U.S. interest rates reached 45-year lows toward the middle of the 2000 decade, demand for emerging markets assets appeared from more conservative investors. A broader range of insurance companies and pension funds, in search of higher yields and diversification, began investing in emerging markets. With relatively low financing costs and many newly formed hedge funds offering the potential of levered returns, the demand for assets grew even greater.
In addition, crossover investors are motivated by the composition of the indexes against which they are benchmarked. The increasing use of broader indexes that include the BBB or better emerging markets sovereign bonds, such as the Merrill Lynch U.S. Broad Market Index or the Lehman Aggregate or Universal indexes, has brought crossover investors into emerging markets.
Since the end of the stock market bubble in 2000, pension and insurance portfolio managers have sought greater diversification. This has taken the form of nontraditional investments, such as emerging markets debt and equity, hedge-fund investments, real estate, and commodities. The wider distribution of investors provides further support for emerging markets as an asset class.
EMERGING MARKETS DEBT PERFORMANCE HISTORY
Historical Returns
Emerging markets debt has produced one of the highest returns among major asset classes. The performance of the Merrill Lynch sovereign IGOV index since December 1991 is shown in Exhibit 20–2. For the first 12 years, cumulative returns for the asset class have totaled 368%, far above the average cumulative returns of 178% for U.S. high-yield bonds or 125% for U.S. Treasuries over the same time period. In comparison, cumulative returns of U.S. equities were approximately 106%, whereas emerging market equities posted a 6% decline. Over these 12 years, on an annualized basis, emerging markets debt has provided a 13.7% return compared with 8.9% for the U.S. high-yield market (see Exhibit 20–3).
EXHIBIT 20–2
Total Return of Merrill Lynch Emerging Market Index as a Percent of Original Investment
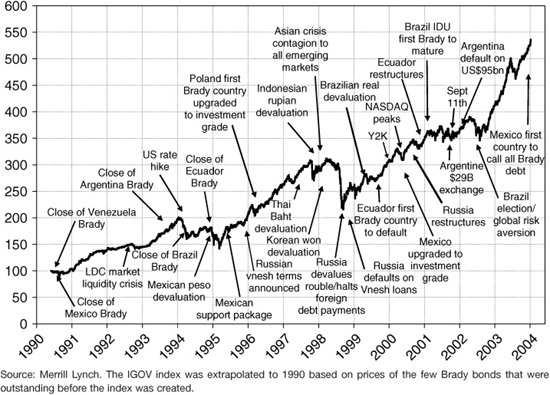
EXHIBIT 20–3
12-Year Total Return, Volatility, and Sharpe Ratio (Annualized)

A small part of this return is due to the Treasury rally. From the inception of the indexes, U.S. Treasury rates have fallen less than 300 basis points, or less than 25 basis points per year for the first 12 years. This accounts for about 1% of the annual return.2 The remainder of the return can be attributed to the coupon income and price appreciation (due to spread tightening and the steady aging of low-priced bonds as they accrete to par). The end of this period came with Treasury yields reaching historic lows and emerging markets spreads simultaneously touching historically tight levels, providing annualized returns that could not be replicated over the subsequent 12 years.
Volatility and Sharpe Ratios
Periodic crises in emerging markets have brought volatility along with high returns. Over the long term, while emerging markets debt has provided an annualized 13.7% return, it has come with a 16% annualized volatility (see Exhibit 20–4). Higher risk should come with a higher return. A risk-adjusted return measure, the Sharpe ratio, is used often for equity investments. It is measured as the ratio of the return in excess of the risk-free rate divided by the volatility.
EXHIBIT 20–4
12-Year Annualized Return versus Volatility
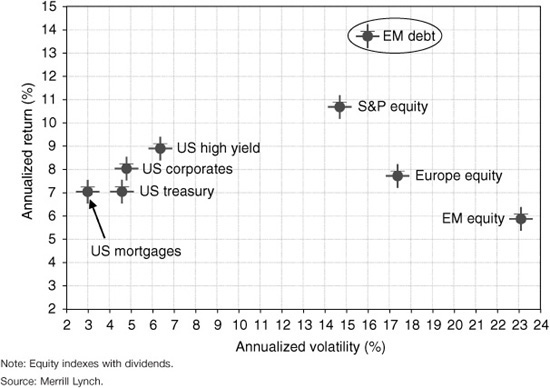
The Sharpe ratio for the last 12 years in emerging markets debt is about the same as that of U.S. Treasuries owing to the high emerging markets volatility. Mortgages have had the highest Sharpe ratio. From a Sharpe ratio perspective, emerging markets debt would have been a better investment than European or emerging markets equity, the latter two having historically high volatility and low returns.
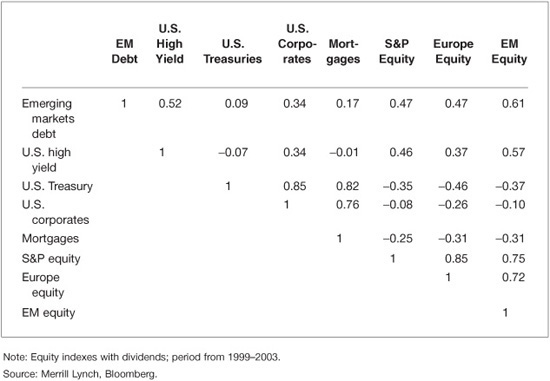
Correlation with Other Asset Classes
Emerging markets debt has had a weak correlation with U.S. Treasury bonds, as well as with U.S. corporate bonds and mortgages (see Exhibit 20–5). The highest correlation is with the U.S. high-yield market (0.52). Low correlations give emerging markets an important role in a global portfolio. Until late 1997, emerging markets debt was very highly correlated with U.S. Treasuries. But the flight to quality during the Russian debt crisis ended that relationship. Since the Russian crisis, emerging markets returns have been far less correlated with those of the U.S. Treasury market.
EXHIBIT 20–5
Intermarket Correlations after the Russian Crisis
Liquidity
Average trading volume of emerging markets debt is usually about US$16 billion per day. There have been exceptions, with a temporary decline in the year following the Russian crisis to only US$9 billion per day and another drop in 2002 when global equities declined and risk appetite was low.
Many high-yield bond portfolios include some emerging markets debt, and thus high-yield managers represent an important source of “crossover” investors. Important to many fund managers is the debt in benchmark indexes. While the Global Emerging Market External Sovereign Plus Debt Index (IP00) is less than half the size of the Global High Yield Index (HW00), the liquidity is better in emerging markets. There are fewer but larger issues in emerging markets debt indexes; the average issue size is over four times larger, making pricing more transparent and bid/ask spreads narrower. Thus emerging markets debt plays a key role in high-yield portfolios, offering greater liquidity when needed.
BRADY BONDS
In 1989, the Brady Plan was introduced, named after former U.S. Treasury Secretary Nicholas Brady. It provided debtor countries with debt relief through restructuring their commercial bank debt at lower interest rates or allowing them to write it down, enabling them to exchange that debt for tradable fixed income securities. In return, the developing countries agreed to adopt macroeconomic reforms. Banks were given the choice of mainly debt (face) or debt-service (interest) reduction options. By the late 1980s, many banks had provisioned as much as 60% of the face value of their commercial loans to less developed countries (LDCs). Since some commercial banks at that time held these assets at face value, an equal face exchange enabled these banks to participate in a restructuring in which the LDC obtained some formal debt relief.
The Brady Plan grew out of the LDC debt crisis of 1982–1988. In the early 1980s, sluggish growth of industrial countries, rising global interest rates, and falling commodity prices triggered a significant economic contraction in developing countries. As a consequence, isolated from the international capital markets and lacking the level of domestic savings needed to service external obligations, most developing countries began to experience severe debt-servicing problems. The first strategy adopted to address the crisis was a program of new lending by commercial banks and multilateral organizations combined with structural adjustment efforts by the debtor countries. By 1988, it had become clear that this strategy was less than successful; the LDCs were not emerging out of the debt crisis, and a new strategy involving “debt relief” was necessary.
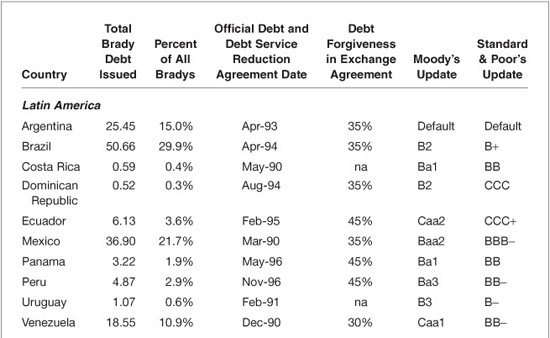
A total of 17 countries took advantage of the program from 1989 to 1997, issuing a cumulative face value of US$170 billion of Brady bonds.3 The majority of Brady debt was issued by Latin America, with Brazil, Mexico, Argentina, and Venezuela representing 78% of all issued Brady bonds (see Exhibit 20–6). Almost all countries with defaulted commercial bank debt from the 1980s exchanged that debt for Brady bonds or restructured loans. Since then, most countries have been able to improve their financing budget and subsequently have been able to raise more funds in the Eurobond market. The notable recent exceptions are Argentina, Ecuador, Ivory Coast, and Uruguay. The first three countries defaulted, whereas Uruguay conducted a successful restructuring of its debt at a time of distress without having to default. The well-known default of Russian restructured debt in 1998 was not issued under the Brady Plan but was noteworthy because of the short period that the restructured debt paid coupons (less than two years), the size of the default, and the disastrous impact it had on global markets.
EXHIBIT 20–6
Original Brady/Exchange Issue Amounts (US$ billion) and Multilateral Debt Relief Agreements with Commercial Banks

Types of Brady Bonds
The term Brady bond refers to a series of sovereign bonds issued by these developing countries in exchange for their rescheduled bank loans. The Brady market is unique in several respects. First, yields always have been higher than on non-Brady bonds. Second, some issues were extremely large and liquid, especially compared with typical sovereign Eurobonds. Third, since the goal of restructuring the debt was to give the sovereign debt service relief in the early years, no bond was a simple fixed-rate bullet bond with all principal paid in a single maturity year. Instead, every bond had at least several combinations of features, including step-up coupons, floating-rate coupons, amortizations, long grace periods before principal began to be repaid, capitalizations, and principal and interest collateral.
Typically, in a Brady exchange for the illiquid defaulted loans, the banks were given several options, one of which included an exchange of defaulted loans for partially collateralized “discount bonds,” also known as “principal-reduction bonds.” These bonds required 35% to 50% forgiveness on the face value of the defaulted loans, thus providing the sovereign with debt relief (in terms of the principal amount, or “stock of debt”). They offered a “market” coupon rate of LIBOR+13/16, although a true market coupon would have been hundreds of basis points higher. “Par bonds” were issued at “par,” in exchange for the original face value of the rescheduled loans, but carried a fixed, below-market interest rate. In addition, investors were given a “past-due-interest bond” whose face value was the amount of past-due interest that had accrued between the payment prior to default and the exchange date.
As each successive Brady exchange took place, the terms typically progressed more in favor of the sovereign. “Haircuts,” or forgiveness (the reference to the reduction of principal due to restructuring), crept higher, collateral decreased, and creative ways were used to implicitly reduce the past-due interest calculation.
The particular bond types were chosen by creditors to provide debt and debt-service relief to the sovereign issuer. During the negotiations, creditors were presented with a choice of possible debt restructurings and were given several months in which to choose. At the time of the presentation, all options were equally attractive and produced roughly the same net present value. In their selection, some creditors were constrained by their own internal accounting requirements, whereas others were able to select the bond that provided the highest present value. Typically, these decisions were influenced mainly by the expectation of the sovereign’s spread risk and movements in the U.S. Treasury market. A description of the types of Brady bonds that were issued can be found in the Appendix to this chapter.
Exchanges from defaults in the post-Brady era also have included significant haircuts. Investors have had fewer choices, and pressure to participate has been great for a variety of reasons addressed later. Exhibit 20–6 lists the Brady countries with their respective exchange dates, debt forgiveness, and current credit rating.
Brady Bond Valuation
Because almost all restructured bonds offered lower debt service in the early years, no Brady bond was a simple fixed-rate bullet bond with the principal paid entirely in a single maturity year. To account for the complicated features, emerging markets investors need to be more bond-structure-savvy than comparable investors in the high-grade or high-yield markets.
For example, a bond with collateral requires a somewhat different method of assessing value rather than merely calculating yield-to-maturity based on price. Investors value collateralized bonds by “stripping out” the collateral, giving rise to the terms stripped yield and stripped spread. Similarly, valuation of amortizing or capitalizing bonds requires a more sophisticated approach because the timing of any cash-flow is crucial in determining its value. A description of the most common methods for bond valuation can be found later in this chapter.
Retirement and Exchanges of Brady Bonds
Since the issuance of the first Brady bond in 1989, many countries have implemented economic reforms sufficiently to enable them to access the capital markets in the form of Eurobonds and global bonds, which are issued and sold to international investors. Simultaneously, many countries have made a concerted effort to retire their expensive Brady debt through various forms of buybacks. The Brady bonds that were retired through exchanges typically had lower coupons and lower prices but higher spreads than the Eurobonds that replaced them, thereby offering the sovereign net present value (NPV) savings, important economically as well as politically.
Most of the retirements were made possible by the regained confidence of the international capital markets. This enabled investors to exchange complicated structures of Brady bonds with a tainted history for clean, simple global bonds. After describing the main mechanisms for positive exchanges, we discuss in detail several distressed exchanges—as well as exchanges out of default—since 1999. The details of these exchanges are instructive in that they set precedents for future exchanges.
Public exchanges, which began on a small scale with Argentina in 1995 and on a much larger scale with Mexico in 1996, offered specific Eurobonds in exchange for one or more Brady bonds. Most of the exchanges, while keeping market capitalization fairly constant, replaced Brady bonds priced much below par with new Eurobonds priced close to par, resulting in smaller face of the new issue. These exchanges had the added benefit of reducing the total stock of debt (face) outstanding. The exchanges produced large multi-billion-dollar issues that are liquid and actively traded, led by the Brazil 2027, Mexico 2026, and Venezuela 2027.
Since issuance, sovereign issuers of Brady bonds have been able to retire Brady debt through several main approaches:
• The issuer may exercise the call option on the bond, as Mexico has done with all its Brady debt and Poland with much of it. All Brady bonds are callable at par, usually on coupon payment dates. If the bonds are called, they must be retired.
• The sovereign country may discreetly buy back their Brady bonds in the open market, as did Argentina, Brazil, Mexico, Panama, and Poland.
• A sovereign issuer may initiate a formal Brady exchange program, whereby a price or spread is preset, and bids are solicited for an exchange into a new Eurobond issue. In 1996, Mexico was the first sovereign country to participate in a large-scale Brady-to-Eurobond exchange. At that time, emerging markets were providing extremely high returns, spreads were consistently tightening, and investors were glad to have an opportunity to exchange their collateralized Mexican par and discount bonds for a noncollateralized global issue that would outperform if spreads continued to tighten. This set the tone for subsequent formal exchanges that included Argentina, Brazil, Mexico, Panama, Uruguay, Venezuela, and the Philippines.
• The issuer may offer a formal exchange into local debt. Argentina swapped numerous external bonds for local debt, with a commitment to pay the debt service from tax revenues.
• The sovereign may agree to a private exchange, whereby two to four holders of a sizable block of Brady bonds would agree to an exchange for a reopening of an existing sovereign Eurobond.
• The sovereign may accept Brady bonds as payment in certain privatizations, particularly in Brazil.
• The sovereign may default on the bonds (Argentina, Ecuador, Ivory Coast, and Russia, although the Russian default was on debt that was not technically part of the Brady Plan).
• The issuer pays amortizing principal on schedule. Most amortizing Brady bonds have been repaying large amounts of principal. In 2001, Brazil’s IDU (Interest Due and Unpaid) bond became the first Brady bond to actually mature.
This trend of replacing Brady bonds for global or Eurobonds has been favorable to investors because the new bonds are far less complex than the Brady bonds they replaced, thus appealing to a wider audience.
At the beginning of 2004, only about 25% of the original $170 billion Brady bonds remain outstanding. Simultaneously, most countries have issued global bonds and Eurobonds as one of their main sources of external funding, overtaking the Brady debt as the most liquid bonds in emerging markets debt.
DEFAULTS, EXCHANGES, RESTRUCTURINGS, WORKOUTS, AND LITIGATION
Successful Distressed Debt Exchanges
Any exchange in an emerging market can set a precedent for future exchanges. This includes both distressed debt, prior to and averting a default, as well as defaulted debt exchanges. Just as each new Brady exchange offered terms that may have been less beneficial to the bondholder, each successive defaulted global bond restructuring is likely to get similar or less favorable treatment than the restructurings before it. Below is a description of the major distressed and defaulted restructurings since 1999.
Pakistan, 1999: Orderly Exchange Avoided Default
Pakistan, which did not have Brady debt, was current on its external bonds prior to its 1999 voluntary exchange. At that time, it rescheduled over US$600 million in external global bonds. It exchanged three bonds maturing over the next three years for new securities maturing in six years. About 90% of the bonds were exchanged. Investors were concerned about Pakistan’s ability to make the next debt-service payment. The bond exchange was part of a larger restructuring of US$3 billion in debt, including that from government and development bank creditors, increasing the likelihood that bondholders would get paid. The bond offer prompted Standard & Poor’s to downgrade the nonexchanged bonds to a default rating (D) because the exchange prevents the existing debt from being repaid on time. It was the first time Standard & Poor’s had downgraded a country to the default level.
Ukraine, 2000, and Moldova, 2001: Avoided Default
Both the Ukraine and Moldova proposed a reasonable restructuring prior to payment default. Both countries had only a very small amount of global (non-Brady) debt, which was not widely held. Both countries were cash-poor, and investors were pessimistic regarding any solution to the sovereign crisis without international support, despite the fact that this support included the extension of external principal payments for several years.
Uruguay, 2003: Orderly Exchange Avoided Default
Uruguay was current on its debt service prior to its 2003 voluntary exchange, but there was great concern that the spillover effect from the contraction in neighboring Argentina was making it impossible for Uruguay to maintain its fiscal accounts because Uruguay’s primary trading partner is Argentina. Prior to Argentina’s default, Uruguay had an investment-grade rating. Uruguay exchanged US$4.9 billion of Brady and global debt for new securities that mature later and pay lower interest, stretching out debt payments. The exchange gave Uruguay a fiscal surplus and enabled it to draw on IMF loans, regaining investors’ confidence in its ability to pay debts and revive the economy. Over 95% of the eligible bonds were exchanged, one-third of which were issued under local law.
Standard & Poor’s called the swap a default and rated the nation’s long-term foreign currency debt at about five levels below investment-grade after investors received the new bonds. The rationale was that the new bonds, with both a longer maturity and a lower coupon, were worth less than the old bonds in NPV terms.
Unsuccessful Distressed Debt Exchange
Argentina, 2001: Exchanges Not Sufficient to Avoid Default
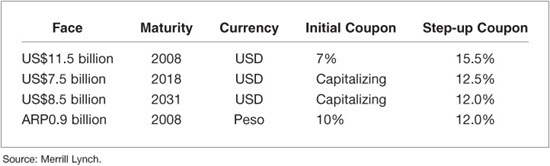
In the year preceding its December 2001 default, Argentina conducted two large exchanges of debt in an effort to reduce near-term debt service by extending maturities and lowering cash coupon rates. In June of 2001, Argentina conducted its “megaswap,” exchanging close to US$30 billion of local, external global and external Brady debt, much of it coming due in the near future. It swapped that debt for four external bonds, most of which paid no cash coupon for five years but instead capitalized and then stepped up to a high 12% coupon (Exhibit 20–7). Some investors, mostly local investors, hailed the exchange as the solution to Argentina’s debt problem. Others were less optimistic, fearing the country’s borrowing costs would soar after 2006.
EXHIBIT 20–7
Argentina’s “Mega” Exchange, June 2001
Argentine local banks and pension funds were active participants in that exchange. The attractive feature for Argentina was that it significantly reduced debt service for close to five years. Yet investor confidence did not rise sufficiently, and Argentina’s continued funding needs could not be sustained. In November it subsequently exchanged Brady and Eurobond debt for local loans. This exchange originally was only open to local investors, but participant restriction eventually was relaxed. The exchange was viewed as coercive; Standard & Poor’s downgraded all eligible bonds to a default rating (D). Within a month, the sovereign declared a moratorium on the payments of US$95 billion of external debt, the largest sovereign default in history.
Restructuring after a Default
Below is a summary of the large Russian and Ecuadorian defaults and subsequent restructurings, together with a description of the much larger and more complex Argentine default in late 2001.
Russia, Ecuador, Ivory Coast, and Argentina defaulted on their restructured debt in 1998, 1999, 2000 and 2001, respectively. Russia’s debt was not formally under the Brady Plan, but it was restructured debt that was current for only slightly over a year. Ecuador was the first country to default on Brady bonds. In 2000, both countries restructured their US$40 billion defaulted debt into US$27 billion of Eurobonds. Ivory Coast defaulted in 2000, but creditors did not vote to accelerate the bonds, likely because the size was small, as was their ability to pay.
Russia Defaulted Debt Characteristics
Russia defaulted on local debt and US$32 billion in two external debt obligations from the Soviet era Vnesheconombank, a loan and a bond, neither of which cross-defaulted to Russian federation external bonds. Russia did not default on any of its Russian-issued Eurobonds. The principal debt obligation was a participation loan that traded as low as $6.
Ecuador Defaulted Debt Characteristics
Ecuador was more diverse, with six bond issues totaling US$7.7 billion face. The PDIs (Past-Due Interest Brady bonds) were the only liquid, noncollateralized Brady bond. The Ecuador 2002 was an extremely illiquid global bond issued in 1997 and held primarily by banks. The only other global bond outstanding never traded. In the end, the two global bonds received preferential treatment, but the time frame in which investors could address inequities was too short to allow them to act on it. The “haircuts” for all but the IEB bond were determined in a consistent fashion—all cash-flows of defaulted debt of these bonds were discounted at 11.25% (the rate of the most recently issued fixed-rate Eurobond). Investors received new bonds whose face value was based on this NPV.
The IEBs (Interest Equalization Bonds) had differential treatment. Since over 50% of the IEBs were held by a single investor, in order to encourage participation in the exchange, the bond received better terms than the other Brady bonds. For the new bonds, nonfinancial terms were used as leverage to encourage participation. In addition, investors were caught by surprise with only about two weeks between the exchange offer announcement and the date in which to accept the offer. A minimum participation rate was specified. If there was a failure to meet the minimum participation rate, additional past-due interest would accrue, and the structure would no longer be viable. This forced investors to act rather than to argue over inequities.
In addition, if Ecuador defaults on this new debt, bondholders can revert to their original claims (higher face value) that existed before this exchange took place, thus offering further protection.
Argentina Defaulted Debt Characteristics
While the agreements of the Russian and Ecuadorian exchanges offer a guide to investors on how the next restructuring might unfold, the Argentine restructuring is more complex for several reasons. First, the size and disparity are enormous—US$95 billion total face defaulted external debt obligations cover over 80 individual external bond issues in eight legal jurisdictions and in multiple currencies. Second, there are many more disparate parties with their own agendas coming to the negotiating table. Many of the investors are original or early holders, who need a less negative return on their investments. They thus may push hard to get better terms than those of the recent Russian exchange. The Russian debt originated from Soviet loans and had a tumultuous history, having been through a default, a restructuring, and another default. Most of the debt had turned over and, at the time of the restructuring, was held by investors who bought it at extremely depressed prices. Restructured values in Argentina likely will be lower than those in Russia. A comparison of Russia, Ecuador, and Argentina’s debt ratios at the time of default is shown in Exhibit 20–8. Defaulted bonds do trade, although far less than paying bonds. A view of bond prices after default is shown in Exhibit 20–9. A description of the new bonds and the terms of the exchanges from defaulted debt to new bonds is found in Exhibits 20–10 and 20–11, which describe the important precedent-setting terms for future exchanges. An indication of spreads of new bonds after an exchange is given in Exhibit 20–12. At the end of 2003, Argentina owed multilaterals (such as the IMF and World Bank) US$30 billion and subsequent to the default had issued a sizable amount of senior local market U.S. dollar–denominated debt (over US$20 billion).
EXHIBIT 20–8
Status at the Time of Default (US$ billion)

EXHIBIT 20–9
Defaulted Bond Prices Immediately Following Default (Day 0 = Default Date)
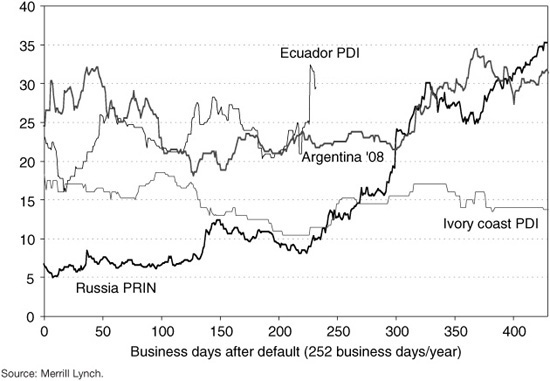
EXHIBIT 20–10
Description of Newly Restructured Bonds
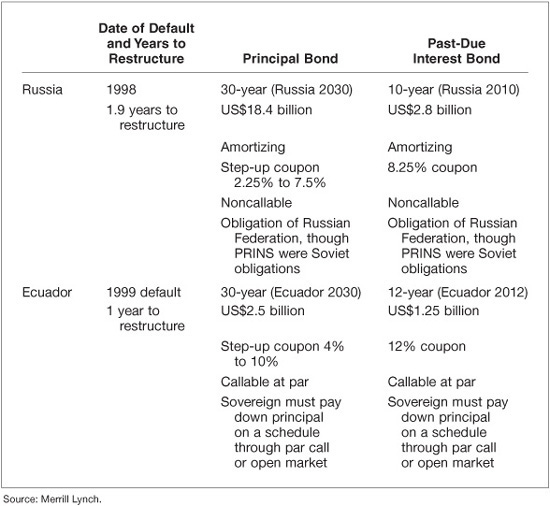
EXHIBIT 20–11
Summary of Terms of Ecuador and Russia Foregiveness and Features

EXHIBIT 20–12
Sovereign Spreads (Basis Points) Just after Issue

Exchanges typically have three components: principal, past-due interest, and cash. Principal often has a “haircut,” or reduction in face, and is replaced with a long bond. Past-due interest typically is treated better than principal, with part of it paid on exchange in the form of cash, little or no haircut, and with exchange bonds that are typically intermediate bonds rather than the longer principal bonds.
Because of its complexity and depth, the terms of the Argentine restructuring could be worse than in prior exchanges. As an example, Argentina suggested 75% forgiveness of debt, which was unprecedented by historical standards. Argentina also suggested total forgiveness of past-due interest. With an average coupon of 10% and likely three years between default and restructuring, investors who expected to get $30 face of an intermediate bond for every $100 face of defaulted debt immediately rejected the suggestion.
Several lawsuits were brought on the payment of the currently outstanding debt. This sovereign bankruptcy on bonded debt marked the first time many disparate foreign bondholders united in an organized committee in the United States and another in Europe, with strong objections to the framework proposed by Argentina.
Foreign and local investors have different objectives. Argentine pension funds were allowed and even encouraged to invest up to 50% of their assets in sovereign debt, thus ensuring large demand for the many global bonds that were issued in the 1990s. During most of that time, Argentina’s peso was pegged one-for-one with the U.S. dollar. One month before Argentina defaulted on its external debt, most of the pension fund holdings of external debt were exchanged for local loans that were senior to the external debt, although the coupons were lower and the maturities had been extended. The focus of the Argentine restructuring is equitable burden sharing.
The Role of the IMF
The Western nations established the International Monetary Fund (IMF) and the World Bank after World War II as “permanent machinery” to anchor the Bretton Woods system. When developing countries began experiencing debt problems in the late 1960s, the Paris Club was formed to restructure debt from export credit agencies. A decade later, the London Club was formed to deal with workouts of commercial bank debt. After the decade of the 1990s, during which countries had a significant amount of outstanding bonds rather than loans, restructuring defaulted debt required a new process. The IMF and the U.S. Treasury have played significant roles in proposing a permanent mechanism to deal with defaulted bonded debt.
A sovereign default can have global implications. Sovereigns issue their own currency and indirectly backstop the banking system. Sovereign debt is a more important asset in a country’s financial system than the debt of a company, and it plays an important role in the banking system. The IMF can provide a means of providing new money in the absence of any established or enforceable system of priorities. Historically, the condition for receiving IMF support is that a sovereign must not only adhere to IMF targets for inflation, fiscal deficits, and exchange-rate controls, but also the sovereign must repay the IMF. There has never been IMF debt forgiveness, except in the case of some highly indebted poor countries (HIPCs), such as Nicaragua or Rwanda.
Consider the case of a sovereign that is having a liquidity shortage, perhaps stemming from fears of the country’s solvency. In such a case, the IMF can offer credit, linking the financing to policy adjustments to address fears about solvency. When that support is sufficient, the sovereign can regain investor confidence (e.g., Brazil, Uruguay). At other times, when the support is insufficient or when there is no agreement by the sovereign, a default or moratorium on payments could occur (e.g., Argentina, Russia).
Distressed Debt Market-Related International Litigation
No Bankruptcy Court
There is no bankruptcy court for sovereign defaults, such as that for corporate defaults. Therefore, the outcome of most sovereign defaults is either the resumption of payments or, in most cases, a distressed exchange. The absence of a formal bankruptcy process clouds sovereign debt restructuring. There is a debate on reforming the international financial system, with a primary focus on the need for a sovereign debt-restructuring process that would limit the risk that litigation could disrupt or delay a debt restructuring. Yet, in many cases, progress is impeded by interference from “holdout” investors. These investors do not participate in the restructuring, yet will demand payment on the original contractual agreement or will negotiate a preferred settlement for themselves through litigation. These investors typically are distressed debt funds that have large enough positions and the means to engage attorneys to sue the sovereign and then to attach assets. Furthermore, no restructuring would be possible if too many creditors did not participate. Therefore, there is a need for making the sovereign debt-restructuring process swift and orderly, reducing the holdout risk. Without a process in place, there is a fear that concerned investors would be inclined to sell their bonds before the event of default, thus actually speeding the decline and preventing the sovereign from constructing a solution.
Pari-Passu Clauses and Sovereign Immunity
Investors have won judgments against a sovereign issuer in default. However, in contrast to corporate defaults, it is very difficult to attach the assets of a sovereign.
There is a more favorable legal climate in continental European law than that in Britain and the United States for attaching assets. In continental Europe, successful litigators have attached the Central Bank’s assets of a sovereign whose claims they are holding.4 In addition, central banks that are incorporated separately for commercial purposes do not enjoy immunity; only the sovereign does. The Foreign Sovereign Immunities Act of 1976 precludes a waiver of immunity of prejudgment attachment of the accounts of a foreign central bank. Since then, a number of common-law countries have adopted similar legislation on sovereign immunity. On the other hand, in continental Europe, foreign central banks generally are treated as entities separate from the foreign state, and as a consequence, the assets of central banks enjoy little or no protection. Deutsche Bundesbank, during one litigation case, considered amending the law (via Parliament) on the nonimmunity provided to a sovereign whose assets are deposited with a German bank.5
These laws have an impact on nonparticipants in distressed exchanges. Another avenue open to nonparticipants involves wire transfers. In the United States, an attachment order can only reach wire transfer either before it is initiated or after payment is completed. However, Europe does not have an equivalent law. A distressed investor was able to intercept payments from a sovereign on restructured debt to bondholders in Europe.6
Two Well-Known Holdout Cases Have Set Adversarial Precedents
Dart versus Brazil
The Dart family held US$1.4 billion principal claim of defaulted Brazilian loans before the Brady exchange in 1993, for which they had paid about 30 cents on the dollar. The face value-of-claim was US$2.2 billion of principal plus interest. In the litigation, there were no attachments or accelerated payments. The original debt instruments were securitized in a pass-through trust vehicle, and payment is being made in full by Brazil on the original maturity schedule.
Elliot Associates versus Peru
The practices of “vulture funds” that buy cheap sovereign debt in the secondary markets and then sue for full repayment plus interest came to international attention in the case of Peru. Elliot Associates LP, a New York–based hedge fund, purchased pre-Brady loans at a deep discount in 1996 and then actually took the government of Peru to court instead of opting for a restructuring agreement. It won the legal battle, and the Peruvian government eventually paid it more than US$58 million.
This incident is one of the few times a single bondholder has taken a government to court and collected complete repayment of defaulted debt. Elliot’s successful litigation was based on an interpretation of the pari-passu clause. Pari-passu means that unsecured creditors are ranked equally. Therefore, the argument goes, if nonholdouts get their (new) claim, holdouts also should get their original (full) claim. A claim is only as good as the claimant’s ability to collect. Unlike corporations, sovereigns generally do not have assets outside the country without sovereign immunity, and thus, even with a judgment, it is difficult to collect.
Elliot located what were technically and legally Peruvian assets in Belgium. This is where the clearing agent, Euroclear, is located and where Brady payments are transferred prior to crediting the bondholders. Elliot went to court to prevent Euroclear from crediting investors with any amounts originating from Peru before Peru paid the Brady bondholders.
Implications from These Cases Caused Ecuador to Be Cautious
As a result of the Elliot versus Peru case, Ecuador decided to become current on payments to the small fraction of original Brady holders who did not participate in the 2000 exchange. These and other litigations have enabled some holdouts to get paid. In some cases, these holdouts have sued for full payment on the nonrestructured debt even after a restructuring has taken place. Uruguay also chose to continue paying the small percentage of investors that did not participate in the exchange, although there was no default. Without the ability to develop a restructuring plan that would be approved by a supermajority of creditors binding on a minority, there is no way to fully protect a sovereign from the risk of holdout litigation.
Changing the Provisions of a Bond
To deal with the holdout problem and encourage maximum participation in an exchange, all contractual proposals seek to change the restructuring process by changing the provisions found in sovereign debt contracts, allowing a supermajority to vote on restructuring terms.
New York Law Documentation
A standard New York law contract requires the unanimous consent of all creditors to change “key financial terms” (payment dates and amounts). All other terms typically can be amended with the support of one-half or two-thirds of the outstanding bondholders. Some New York law bonds also require that 25% of the bondholders agree before litigation can be initiated.
English Law Documentation
A standard English law contract allows a supermajority of bondholders (typically 75%) present at a meeting that meets quorum requirements to amend all the bond’s terms, including the bond’s payment dates and amounts. Many English law bonds also have provisions that make it difficult for an individual bondholder to initiate litigation.
Collective Action Clauses
Collective action clauses (CACs) under New York law have begun to be included in many bonds since Mexico introduced them in 2003. A collective action clause defines how many bondholders are needed to agree on a change in the repayment terms of a bond, in order to effect the change and make it applicable for all bondholders. The CACs were introduced to deal with rogue creditors. CACs already exist in bonds sold under the laws of the United Kingdom.
The Mexican terms specify lower percentages required to change both financial and nonfinancial terms of the bonds. The typical structure allows 75% to 85% of bondholders to amend a bond’s financial terms, as long as no more than 10% of the bondholders object. Financial terms could include payment dates and amounts. The remaining nonfinancial terms could be amended only with the support of 75% of the bondholders. Also, certain provisions that relate to the ability of creditors to sue to collect on their bonds could not be amended at all.7
DERIVATIVES
In addition to cash bonds, active derivatives and repo markets in both Brady bonds and Eurobonds, have given institutional investors leverage and enhanced opportunities to express a view or take advantage of relative mispricings in the market.
Credit Default Swaps
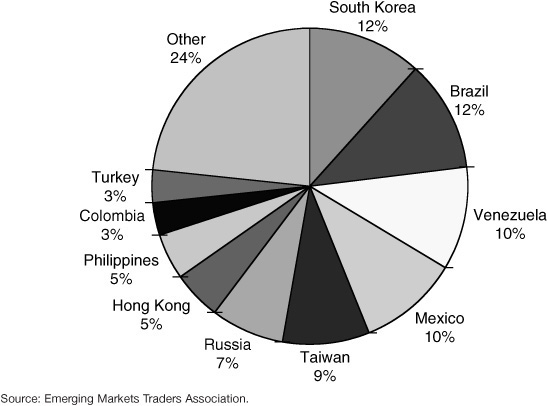
Emerging markets credit derivatives evolved alongside the rapid growth of the corporate credit derivatives market.8 Credit default swaps (CDS) have grown to play a major role in emerging markets investing and hedging. CDS exposure is similar to the exposure of a floating-rate note investment. Both bond spreads and CDS spreads relate to credit default risk. A CDS offers investors an alternative way of going long or short a particular credit. Exhibit 20–13 shows the distribution by country of the US$1 billion CDS that trade daily. South Korea and Brazil are by far the most actively traded countries.
EXHIBIT 20–13
Emerging Market Credit Default Swaps (Over US$1 Billion Volume per Day)
In some countries, a CDS offers opportunities to short the market that might otherwise not be possible because, for example, the available bonds have long maturities. Shorting a bond in many countries can be difficult or expensive owing to lack of liquidity or lack of a term repo market, but taking a short market position via a CDS is not only easier, but the cost is known. Companies with investments in emerging countries have used the sovereign CDS market extensively to hedge the overall sovereign risk or to determine what return they should target when lending to various private projects or valuing the purchase of a local asset.
Creating a long position via an emerging market CDS almost always offers higher returns than investing in a cash bond. Other uses are to obtain exposure to a maturity in which there is no cash bond, for leveraged investing, for trading strategies on a relative value or curve mispricing basis, and for risk management purposes for emerging market lenders or investors. Furthermore, CDS has offered the market a tool for assessing relative value among bonds.
A CDS is analogous to insurance on the price loss of an investment due to default. In a CDS of a given credit, counterparty A pays counterparty B a periodic payment (CDS spread), which can be thought of as an insurance premium. In exchange, party B agrees to pay par for one of the issuer’s eligible bonds should a default occur, which would be akin to making a claim on the insurance policy. The counterparties generally are referred to as the “protection buyer” (who pays a premium) and the “protection seller” (who makes the contingent default payment or buys the eligible bond for par in the event of default). The CDS contracts specify what credit events are considered default, for purposes of making the contingent claim, and what assets are deliverable for par. Dealers use documentation from the International Swap and Derivatives Association (ISDA).
CREDIT-LINKED NOTES (CLNs)
A credit-linked note (CLN) is a common emerging markets asset that offers investors credit exposure to an issuer in a structure resembling a synthetic corporate bond or loan but typically with a higher spread. Similar to a bond, a CLN allows an investor to take credit risk on a bond in return for payment of interest and repayment of par. A common structure is issuance by a special-purpose vehicle (SPV) that holds collateral securities financed through the issuance proceeds. The credit-derivative CLNs are created by embedding credit derivatives in an SPV.
The CLN has three main components: the SPV, the collateral, and the credit default swap. The issuance proceeds from the CLN are used by the SPV to purchase preagreed collateral to fund the CDS. The SPV simultaneously enters into a CDS with a highly rated swap counterparty (such as a dealer), whereby it sells credit protection in return for receiving an ongoing premium. The SPV grants a security interest in the collateral against the SPV’s future performance under the preceding default swap. The SPV also may need to enter into an interest-rate swap (or a cross-currency swap) to reduce interest-rate risk and to tailor the required cash-flows of the note. The package is a CLN that performs similarly to a sovereign bond. CLNs are bought by investors who appreciate the increase in yield versus a sovereign bond and do not need liquidity.
Credit Exposure of the Investor
An investor in a CLN has exposure to the CDS reference issuer, credit risk associated with the collateral securities, and counterparty risk associated with the protection buyer or swap counterparty. However, to the extent that the preagreed collateral is highly rated and also that the swap counterparty is highly rated, most of the emphasis is on the credit risk of the CDS.
Repos
Emerging markets debt tends to be more technically driven than other low-quality markets because of the large issue sizes and liquidity. It is one of the few bond markets in which investors can take either long or short positions. As such, the emerging market repo market developed depth long before the high-grade repo market. When financing rates were high, in the 5% to 7% range, it was common to be able to finance or borrow the more liquid bonds for three- or six-month terms, with financing desks providing liquidity as they traded the financing curve. Bonds that were in high demand from investors’ short positions could be borrowed at rates hundreds of basis points below general collateral financing rates. This provided an opportunity for a repo desk to profit from part of the spread of the special rate of the borrowed collateral. Low financing rates close to 1% diminish the activity and liquidity of the emerging market repos.
VALUATION METHODS
Zero Spread
The common approach to valuation in emerging markets is to spread off the zero-coupon curve Every bond’s cash-flows are modeled, with projections of future coupons on floating-rate bonds based on the forward LIBOR curve. After the cashflows are projected, each resulting risky, noncollateralized cash-flow is discounted by a zero-coupon Treasury rate plus a spread. This spread is the “spread over the curve” or “stripped spread.” Dealers vary according to the particular Treasury curve they use, and many investors now use the spread over the zero-coupon curve implied by the swap curve. This spread is often called spread over swaps.
Modified Cash-Flow
The modified cash-flow (MCF) method offers a way to account for the rolling interest guarantee (RIG) of a bond with interest collateral. The interest payments in these bonds are partially collateralized by amounts sufficient to cover a specified number of coupon payments. The interest guarantee is characterized as a rolling interest guarantee because the guarantee “rolls” forward to the subsequent interest period if not used.
Although the interest collateral does not currently cover the later coupons, these coupons still benefit from the RIG as each interest payment is made. The objective of the MCF approach is to simulate the rolling nature of the interest collateral as each successive coupon is paid. For example, if two semiannual coupons were guaranteed, a coupon that was due in five years would have sovereign risk for the first four years but would have the AA-rated collateral risk during the fifth year.
To reflect this and measure sovereign risk only, the coupons are modified through a continuous manner of discounting and moving forward each coupon by the specified number of periods in which the coupon would be guaranteed if the collateral rolled. This effectively simulates the process of selling each coupon for its present value as soon as each successive interest payment becomes guaranteed.
In this example, at the end of year four, the tenth coupon could be sold at a discount with no sovereign risk. The set of proceeds generated from the sales represents the modified cash-flows. The investor can now calculate an internal rate of return on a collateralized Brady bond using the MCF and a stripped price. The stripped price is the price of the bond less the present value of its principal collateral (discounted at the U.S. Treasury STRIP rate) and the present value of its interest guarantee (discounted using the swap curve to reflect the AA-rated collateral). In the preceding example, the first two guaranteed coupons are discounted to the settlement date and subtracted from both the price and the cash-flows. The stripped yield and stripped spread (the spread over the U.S. Treasury zero-coupon curve) are perceived as a representation of the market’s view of that country’s level of sovereign risk. Using these calculated risk values, an investor is able to identify relative value between collateralized Brady bonds and noncollateralized bonds.
Valuing Floating-Rate Bonds
Unlike most corporate bonds, many Brady bonds pay floating-rate coupons that reset at six-month LIBOR plus a constant spread for some or all the coupon periods. To value these bonds, investors project coupon cash-flows that are based on forward LIBOR. These forward rates are derived from the LIBOR swap curve or the Eurodollar futures curve. As U.S. Treasury rates rise or fall, forward LIBOR rates also rise and fall. Thus floating-rate bonds are significantly less sensitive to interest-rate movements in the U.S. market than are fixed-rate bonds.
Embedded Options
Aside from the par-call feature of all Brady bonds, certain par and discount bonds carried value recovery rights (VRRs) or warrants. VRRs give bondholders the opportunity to “recapture” some of the debt and debt-service reduction provided as a result of the exchange if future economic performance and the debt-servicing capacity of the sovereign debtor improve. The rights are a mechanism by which the issuing country shares with its creditors a portion of the incremental revenue generated by, for example, a consistent increase in oil prices (Mexico, Venezuela, Nigeria) or the sovereign’s GDP (Bulgaria). Often, these warrants are linked to indexes of oil export prices, the country’s oil export receipts (e.g., Mexico, Venezuela, and Nigeria), or the level of a terms-of-trade index (e.g. Uruguay). Mexican VRRs paid holders for over two years due to the high price of oil.
CONCLUSION
The Brady restructurings of the 1990s transformed illiquid commercial bank loans into liquid, globally traded bonds. The issuance of Brady bonds transformed emerging markets debt into an asset class in its own right.
As the asset class has evolved, defaults have occurred on external bonds since 1999, and the restructurings of those defaulted bonds have not been part of the Brady program. However, the concept has been similar in its efforts to forgive debt and reduce debt service going forward, which provides the sovereign an opportunity to rebuild its economy.
Emerging markets debt has evolved into a sophisticated market with global investors ranging from pension funds to hedge funds. It has grown tremendously over the last 12 years as it has opened its doors to international investment. While it has had well-known market shocks, it has weathered each of them as investors return to the market for its generous returns compared with other asset classes. Emerging markets debt has taken its place as a viable asset class, with product choices as extensive as those in the corporate debt markets.
APPENDIX 20
Types of Brady Bonds
COLLATERALIZED BRADY BONDS
Two principal bonds, pars and discounts, were 25- to 30-year registered bullet bonds and were the largest, most common assets, representing over half the issued Brady market. Issue size ranged from US$90 million to US$22.4 billion and, in some cases, was larger than the most liquid U.S. Treasury securities. Par bonds were issued at “par,” in exchange for the original face value of the rescheduled loans, but carried a fixed, below-market interest rate.
Discount bonds, on the other hand, carried a floating interest rate and were exchanged for fewer bonds than the original loan amount but with a higher coupon. At the time of the exchange offers, the par and discount options offered about the same net present value. Most of the par and discount bonds have been retired.
Pars and discounts generally had principal secured by U.S. Treasury zero-coupon bonds,9 which were funded originally by a combination of International Monetary Fund (IMF) and World Bank loans and the country’s own reserves. In addition, the interest portion of the pars and discounts was partially collateralized by securities rated at least AA, to cover some of the interest (usually 12 months) on the outstanding principal. The interest guarantee is characterized as a rolling interest guarantee (RIG) because the guarantee rolls forward to the subsequent interest period if not used. Both the interest and principal collateral are maintained by an assigned collateral agent and held in escrow at the Federal Reserve Bank of New York. In the event the country misses an interest payment, the trustee pays the investors out of the interest collateral until the guarantee has been exhausted. Bondholders do not have recourse to the principal collateral until maturity.
NONCOLLATERALIZED BRADY BONDS
The types of bonds included in a given plan were determined during the debt restructuring negotiations between a consortium of creditors and the debtor country. The bonds often have varying coupon schedules and amortizations and sometimes include capitalization of interest. The bonds often were of large issue sizes and typically were referred to by name rather than by coupon and maturity, neither of which was constant throughout the life of the bond.
The most liquid emerging market bond10 has been the Brazil C-bond, a capitalization bond that paid a portion of the coupon in cash and the remainder of the coupon in more bonds. It was issued in 1994 and did not start amortizing for 10 years. Most of the floating-rate bonds that also had long grace periods, in which no amortization payments were scheduled, have passed the grace period. Amortizations can pay down over 10 years.
As a result of the frequent capitalization or amortization, each bond carries with it a factor reflecting the proportion of the original face (excluding retired bonds) still outstanding. When purchasing a bond, face value of the purchase is referred to in terms of the original face value of the purchase at the time of issue, but the price is referred to in terms of the current face. Thus the factor is needed to determine the proceeds, as well as the interest payments.
For example, a purchase of US$10 million of a 7% bond and a factor of 0.6 and a quoted price of $80 on a coupon date would cost US$4.8 million and would pay the investor an interest payment of 7% on US$6 million bonds, or US$420,000 per year. Almost all the floating-rate amortizing bonds currently outstanding have no interest collateral. The most liquid ones are debt-conversion bonds (DCBs), new-money bonds (NMBs), eligible interest bonds (EIs), interest arrears bonds (IABs), front-loaded interest-reduction bonds (FLIRBs), past-due-interest bonds (PDIs), and floating-rate past-due-interest bonds (FRBs).