
CHAPTER
FORTY-NINE
INTRODUCTION TO BOND PORTFOLIO MANAGEMENT
Head of the Taxable Bond Group
The Vanguard Group, Inc.
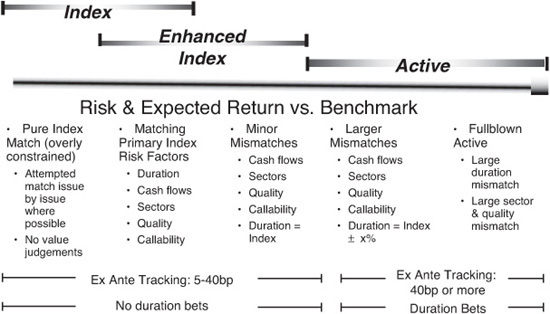
Traditional bond management can be likened to a sailing regatta. The index is the lead boat, since it doesn’t have to contend with expenses and transaction costs, and all managers (including index fund managers) are the other boats, trying to make up the distance and pass the index boat—or at least keep pace with it. Strategies that may be used to make up the difference and pass the index lead boat comprise a wide spectrum of styles and approaches. Exhibit 49–1 displays the major elements of these approaches.
EXHIBIT 49–1
Traditional Bond Management Risk Sprectrum
In this chapter, we’ll examine this spectrum, investigating the pros and cons of matching—and mismatching—bond indexes, and comparing ways of constructing bond portfolios. We’ll look closely at the factors to consider when matching a bond index’s risk factors, as well as the methods that may provide an edge over an index.
OVERVIEW OF TRADITIONAL BOND MANAGEMENT
Although bond portfolio management can be complicated, choosing an investment approach starts with a fairly simple question: How much risk would you like to take?
Pure Bond Index Matching
Pure bond indexing offers the lowest risk (and lowest expected return) approach to bond management versus a specific benchmark. This approach essentially guarantees that returns will lag behind the index by the cost difference (expenses plus transaction costs). Pure bond index matching attempts to fully replicate the index by owning all of the bonds in the index in the same proportion as the index. In the bond market, however, this approach is difficult to accomplish and costly to implement. Many bonds in the index were issued years ago, and are illiquid. Also, many bonds were issued at a time when interest rates were significantly different from current rates. Today’s bond holders may be unwilling to incur a gain or loss by selling their bonds to an index fund.
On December 31, 2010, the Barclays Capital Aggregate Bond Index contained more than 8,200 different issues, including more than 190 Treasury issues, 940 federal agency issues, 4,200 credit (corporate and non-U.S. government) issues, 120 asset-backed issues, 1,550 commercial mortgage-backed securities, and 1,200 broadly categorized mortgage issues (essentially hundreds of thousands of mortgage pools). In the Treasury market, matching an index, security by security, is feasible, although not desirable (for reasons we’ll cover later). However, full replication cannot be reasonably implemented in the agency, mortgage, or corporate bond markets. Thousands of agency and corporate issues are locked away in long-term bond portfolios and must be purchased from the investors who own them—often at a large premium. For this reason, full replication of a broad bond index is inefficient, if not impossible. And, as you’ll see, it’s also unnecessary.
Enhanced Indexing: Matching Primary Risk Factors
This approach involves investing in a large sample of bonds so that the portfolio’s risk factors match the index’s risk factors. The result is a portfolio that will have higher average monthly tracking differences (standard deviation of tracking differences) than the full-replication approach. But, it can be implemented and maintained at a much lower cost. This lower cost results in net investment performance that is much closer to the index. Returning to the regatta analogy, the portfolio boat stays on the same “tack” as the index boat, but “trims its sails” to run more efficiently. Staying on the same tack means that the sails are set to take the portfolio boat in the same direction as the index boat, and are exposed to the same winds and elements. By trimming the sails, the little details of the portfolio boat’s sail position and shape result in better performance and more efficient execution than the index boat. The risk factors that need to be matched are duration, cash-flow distribution, sector, quality, and call exposure (more on this later). This approach is considered a form of enhanced indexing because the return is enhanced relative to the full replication indexing approach (more on this later as well).
Enhanced Indexing: Minor Risk Factor Mismatches
This approach allows for minor mismatches in the risk factors (except duration) to tilt the portfolio in favor of particular areas of relative value, such as certain sectors, credit ratings, term structure, call risk, or other factors. Because the mismatches (and impact on tracking) are very small, this is still considered enhanced indexing. These additional enhancements are essentially sail-trimming strategies.
Active Management: Larger Risk Factor Mismatches
This is a conservative approach to active management. The manager will make larger mismatches in the risk factors in an attempt to add greater value. This approach may also make small duration bets. In most cases, the management fee and transaction costs are significantly higher than for pure or enhanced indexing, yet the net investment return is usually lower. These additional costs are the reason a typical index portfolio often outperforms the average active manager in performance universes. Typically, the manager will moderately change tack to seek greater “winds” (for example, longer than benchmark duration to add value from expected lower interest rates) to overcome the strategy’s higher cost. As a result, manager risk increases the likelihood that the portfolio will deviate from the market return and structure.
Active Management: Full-Blown Active
This is an aggressive active style in which large duration and sector bets are made, and significant variation from the index can occur. Above-average performance consistency is difficult to find among the managers that employ this approach. As a result, investors who choose this management style need to look deeper than recent performance to distinguish the good from the bad. This approach may involve a significant changing of course relative to the index boat, and may risk significant tracking and portfolio structure variations. Of course, the goal of this riskier strategy is to provide a return that is higher than that of the index.
OVERVIEW OF THE CORE/SATELLITE APPROACH
Although these traditional approaches are alive and well, many investment managers have moved a few steps beyond this conventional model and are building portfolios with a conservative, low-cost (often index-based) core, and satellites that may encompass a variety of active strategies. As shown in Exhibit 49–2, a core portfolio is typically managed against a broad, liquid benchmark within a tight risk budget, generally under 40 basis points ex-ante tracking standard deviation versus the benchmark. As we’ll see, there are several ways to build the core and the satellite portions of such portfolios.
EXHIBIT 49–2
Core/Satellite Risk Spectrum
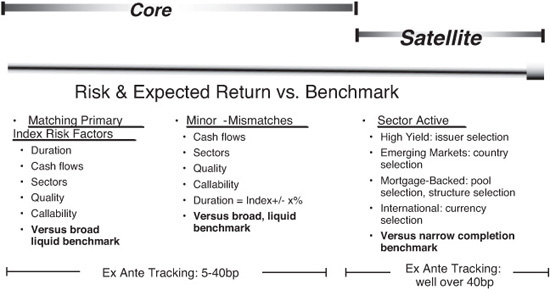
Risk-Factor Matching
In this strategy, the manager creates a broadly diversified portfolio that closely replicates primary index risk factors such as portfolio duration, key rate durations, sectors, quality, and callability. The ex-ante tracking error is expected to be below 20 basis points. Since this high-quality, liquid bond market is assumed to be efficiently priced, the expected opportunity to outperform the index is very limited. Therefore, the objective is to match and replicate the risks, and generate the returns, of the target benchmark at the lowest possible cost (management fee and transaction costs).
Minor Mismatching
Here, the manager is given a larger risk budget (20 to 40 basis points) to mismatch relative to a broad liquid benchmark’s characteristics such as key rate durations, sector and quality weightings, and even overall portfolio duration, to a limited extent. The expectation is that the manager will add value relative to that broad benchmark. As a result of this expected added value, the manager would also have a higher fee structure.
The Satellite Investments
The satellite portion focuses on the less-liquid sectors that have lower correlations with the broad liquid core. This manager is given a smaller pool of assets and a much larger risk budget relative to the narrow benchmark. This bigger risk budget provides an opportunity for the manager to take meaningful selection, sector, and quality risk relative to the benchmark, with the expectation of adding considerable value.
Examples of such narrow, less-liquid markets include high-yield and emerging market bonds. In the high-yield market, issuer and sector selection are the primary determinants of added value versus the benchmark. Within the emerging bond market, country selection is a driving force in adding value. In many cases, the mortgage-backed market (agency and particularly nonagency) is viewed as a satellite market because of the many structural complexities based on interest-rate volatility risk and credit risk in the nonagency market. Securities exposed to non-U.S. currencies may be considered satellites, as could inflation-protected securities.
A key requirement of the satellite component is that it acts as a diversifier and that it has a higher expected return due to its illiquidity and lower credit quality.
WHY CHOOSE INDEXING?
As we’ve demonstrated, indexing plays a major role in bond management. Some managers may use indexing for part of a portfolio; for other managers, it may serve as the approach for an entire portfolio. So why is indexing an effective method of bond investing? Put simply, bond indexing, which has proven its mettle over the past two decades, offers broad diversification and low costs. Low costs are vital to bond indexing because lower costs mean tighter tracking of an index. This, in turn, means that an index portfolio will provide competitive performance that is consistent with the market—or market segment—that it tracks. And it means that nonindex (that is, higher-cost) portfolios will have difficulty beating the index portfolio. Finally, indexing provides a major psychological benefit: It allows investors to focus on asset allocation—or, in the case of the core/satellite approach, on selecting the best investment managers.
Broad Diversification
Broad bond index portfolios provide excellent diversification. The Barclays Capital Aggregate Bond Index, which is designed to capture the entire U.S. investment-grade bond market, had over 8,200 issues and more than $15 trillion in market value as of December 31, 2010. A large bond index portfolio designed to replicate this Index may have 1,000 to 3,000 or more issues, resulting in significant issuer diversification benefits. Most active portfolios have much heavier specific issuer concentrations, resulting in significant exposure to issuer event (credit) risk.
In addition, an index portfolio designed to match the Barclays Capital Aggregate Bond Index will have exposure to not only Treasury and agency sectors, but also to mortgages, industrials, electric and telephone utilities, finance, dollar-denominated non-U.S., and asset-backed sectors. Such a portfolio will also have broad exposure to the yield-curve with holdings from one year to more than 30 years to maturity. These sources of diversification result in a portfolio with lower risk for a given level of return than is available from less diversified portfolios.
Low Cost
As we’ve mentioned, the primary reason for an index fund’s competitive performance is lower cost. This lower cost takes two forms: (1) lower management fees, and (2) lower transaction costs associated with lower portfolio turnover rates. This lower cost advantage is durable and predictable—year after year. Morningstar president Don Phillips summarizes the impact of higher costs this way: “If you pay the executive at Sara Lee more, it doesn’t make the cheesecake less good. But with mutual funds (investment management), it comes directly out of the batter.” It sure does!
Competitive Performance
Since index portfolios have lower management fees and lower transaction costs (resulting from significantly lower portfolio turnover), it’s not surprising that they usually outperform the average active portfolio in most universes. After all, a broad index, by design, is a representation of the whole pie of investment alternatives. As a result, the sum of all active managers should equal the index in composition. Also, the sum of the investment performance of all active managers (grossed up for the higher management fees and transaction costs) should also equal the index in performance. In the mutual fund market, where the bond index expense ratio advantage is about 0.8% per year, the Barclays Capital Aggregate Bond Index (adjusted for an estimated 20 basis point expense ratio) outperformed more than 49% of its Lipper Group over three years, 60% over five years, and 71% over ten years ended December 31, 2010.
Consistent Relative Performance
Exhibit 49–3 shows the performance for the Barclays Aggregate Bond Index (adjusted for an estimated 20 basis point expense ratio) against its Lipper universe (Intermediate Investment-Grade) for calendar years starting in 1994.
EXHIBIT 49–3
Annual Performance Relative Consistency Analysis—versus Lipper Intermediate Investment-Grade

The only years that this portfolio outperformed less than 50% of the universe were 2003, 2009, and 2010. The 2003 “underperformance” was due primarily to the poor performance of the mortgage-backed securities sector, which suffered at the hands of heavy refinancing activity. In 2009 and 2010, Lipper funds were overweighted to credit amid a significant credit rebound following the 2008 credit crisis and recession. In the other years, the portfolio outperformed between 64% and 92% of the competition in its maturity and quality categories. Over the full ten years, the average was a remarkable 71%. The primary reason for this consistent outperformance was the index portfolio’s significantly lower expenses and transaction costs.
Market Performance Predictability
A properly managed broad bond index portfolio can be assured of performing in line with the market as a whole. Regardless of the market’s direction, the investor can be assured the performance of a diversified broad bond index portfolio will follow along.
A Time-Tested Track Record
Bond index portfolios have been successfully managed (that is, close tracking to the benchmark) since the early 1980s—through rising and falling interest rate cycles, as well as periods when credit-spreads widened and narrowed. Through all these market changes, bond indexing has proven to provide a more-than-competitive return with low to moderate risk.
Perhaps the most significant benefit of indexing is that it enables investors to concentrate on more important decisions—namely, the proper allocation of assets. Often, time and effort are wasted in the hope of adding 20 to 40 basis points to the very efficiently priced bond portion of a portfolio, while existing misallocation of assets to stocks or international investments results in hundreds of basis points of underperformance for the entire portfolio. Indexing the core portion of the portfolio that represents the highly liquid markets helps facilitate more effective use of limited decision-making resources available to most investors. For those using a core/satellite approach, indexing provides an opportunity to focus on selecting the best managers for the satellites.
WHICH INDEX SHOULD BE USED?
Once you’ve decided on an indexing approach to bond management, you should focus on the next important question: Which index? A bond index is defined by a set of rules (that is, characteristics) that are then applied to all issues in the marketplace. The rules include maturity, size, sector, and quality characteristics. The issues that fit the rules are then combined, as if in a portfolio, with each issue’s weight determined by its relative market value outstanding.
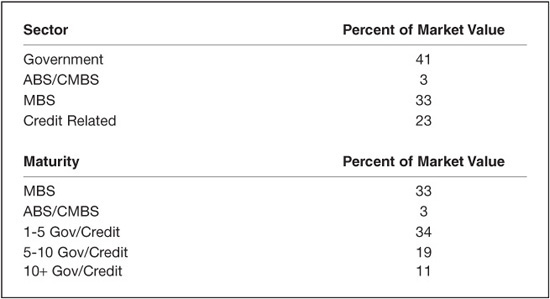
Generally, the broader the index, the better the benchmark. An index we’ve discussed, the Barclays Capital Aggregate Bond Index, is the broadest U.S. bond index. (It’s essentially identical to the Citigroup Broad Investment-Grade Index and the Merrill Lynch Domestic Master Index.) As we’ve mentioned, on December 31, 2010 the Barclays Capital Aggregate Bond Index consisted of more than 8,200 issues, representing a market value of more than $15 trillion. The composition of the Index, illustrated in Exhibit 49–4, was 41% government (U.S. Treasury and agency) bonds, 23% credit-related (corporate and non-U.S. government) bonds, 3% asset-backed bonds and commercial mortgage-backed bonds, and 33% mortgage-backed securities. The option-adjusted duration—a number that reflects the possibility of bonds being called by the issuer—was in the intermediate duration range, at 5.0, with an average maturity of 7.1 years, making it the broadest domestic intermediate investment-grade index available. Sub-indices of the Barclays Capital Aggregate Bond Index can be created to capture that result in different risk/return profiles. For example, a credit index may appeal to those who seek higher yields from the spread sectors, or a 1-to-5-year government/credit index would better serve those who are seeking a short-duration portfolio.
EXHIBIT 49–4
Barclays Capital Aggregate Bond Index Composition (as of 12/31/2010)
An important part of choosing an index is understanding the risks that are involved in the bond market’s various segments. Chief among these risks are market value risk and income risk, although the degree to which they apply to a given part of the bond market can vary widely.
Market Value Risk
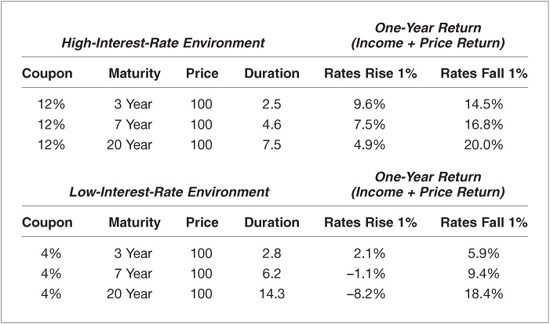
Generally, the longer a bond portfolio’s maturity, the higher is its yield. (This assumes a normally sloped yield-curve.) The total return of a bond is made up of the coupon (or income) component and the principal (or price change) component. Since the yield-curve, which impacts the principal component of total return, is likely to shift, the longer-term bond portfolio will not necessarily have a higher total return. Exhibit 49–5 shows the one-year total return of different maturity securities in both high-rate and low-rate environments. Clearly, as the maturity or duration of the portfolio lengthens, market value risk rises. In addition, the lower the interest-rate environment, the greater the market value risk, especially for the intermediate-term and long-term portfolios. This is the result of two factors: the portfolio’s duration increases as interest rates decrease, and the portfolio’s lower yield-to-maturity provides less of a cushion to offset principal losses. Therefore, for investors who are risk-averse in terms of their principal, the short-term or intermediate-term index may be more appropriate than the long-term index.
EXHIBIT 49–5
Market Value Risk: One-Year Rates of Return in High and Low Interest Rate Environments
Income Risk
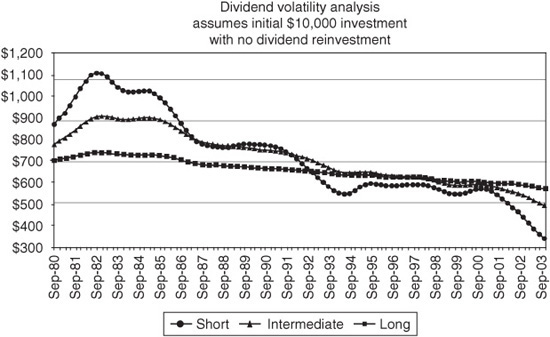
Many investors invest for income. They spend only the income that their investment distributes, and they avoid dipping into their principal. Foundations and retirees invest for a stable—and hopefully growing—income stream that they can depend on for current and future consumption. Exhibit 49–6 shows the income stream from a hypothetical $10,000 investment in short-term (three-year), intermediate-term (seven-year), and long-term (20-year) mutual funds during the 25 years of declining interest rates from 1980 to the mid-2000s, assuming equivalent growth rates for the portfolios. It’s obvious that if stability and durability of income are the primary concerns, the long-term portfolio is the least risky, and the short-term portfolio the most risky.
Liability Framework Risk
Pension funds and financial institutions invest to finance future liabilities. Long-term liabilities require investments in long-term assets to minimize risk, resulting in both a portfolio and a liability stream that are equally sensitive to interest-rate changes. A portfolio that invests in short-term bonds may look less risky on an absolute-return basis, but it is actually much riskier when the portfolio market value is compared to the present value of the pension liability. (The difference is the surplus or deficit.) This is because of the short-term portfolio’s mismatch with its long-term liabilities. The surplus risk will be minimized on a fully funded plan when the duration of the portfolio is matched (or immunized) to the duration of the liability.
Exhibit 49–7 contains a summary comparison showing that the investment with the lowest market value risk has the highest income or liability risk. Likewise, the investment with the highest market value risk has the lowest income or liability risk. Clearly, the risk framework chosen depends on whether the investment objective is principal preservation or income durability.
EXHIBIT 49–7
Bond Market Risk Summary

PRIMARY BOND INDEXING RISK FACTORS
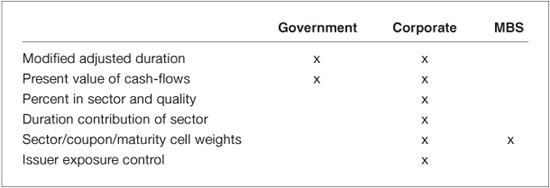
As effective as indexing is as a bond management tool, it doesn’t eliminate the risks of bond investing by any means. Successful indexing requires matching the primary risk factors of the benchmark index in a credit-diversified portfolio. This doesn’t mean an index manager must fully replicate an index. Rather, it means that the manager must understand the risk factors and how they’re measured. Exhibit 49–8 lists the primary risk factors that apply to the government, corporate, and mortgage sectors; the following paragraphs explain each primary risk factor.
EXHIBIT 49–8
Primary Bond Index Matching Factors
Portfolio Modified Adjusted Duration
The modified adjusted duration (or option-adjusted modified duration) is a simple, single measure of the portfolio’s interest-rate risk (see Exhibit 49–9). It’s a great place to start, but is entirely too rough of a measure to adequately track an index. Duration is the average time to receipt of the present value of the bond cash-flows. The portfolio duration will give the manager a rough approximation of the price change observed if interest rates rise or fall (in a parallel fashion) immediately by 1%. If rates rise by 1%, a five-year duration portfolio will experience a 5% decline in value [(+1% yield change) × (portfolio duration of 5 years) × (–1)]. If the yield-curve does not move in a parallel fashion, the duration is of limited value. For obvious reasons, it’s important to match the duration of the portfolio to the duration of the benchmark index.
EXHIBIT 49–9
Key Rate Duration Distribution Analysis for Barclays Capital Aggregate Bond Index (as of 12/31/2010)
Key Rate Durations
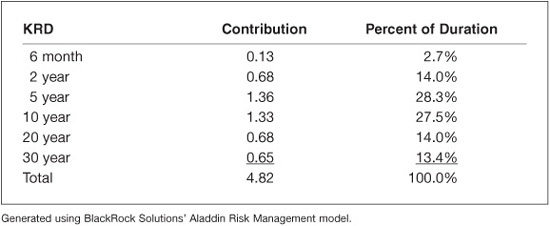
A more accurate way to capture yield-curve risk is by matching the key rate durations (known as KRDs) of the index. Yield-curve changes are composed of parallel shifts, curve twists (for example, short rates down, intermediate rates unchanged, long rates up), and curve butterfly movements (for example, short and long rates down, intermediate rates up). By breaking down the index (and portfolio) into a stream of future payments and discounting each payment to the present value and summing these values, one calculates the index (and portfolio) market value. By matching the percent of the portfolio’s present value that comes due at certain intervals in time (that is, KRDs) with that of the benchmark index, the portfolio will be largely protected from tracking errors (versus the benchmark) associated with yield-curve changes. Since the portfolio duration is equal to the benchmark index duration, this method will guard against parallel changes in yield. Since all points in time (KRDs) are closely matched in percent, any local term structure movements (non-parallel changes) will not affect tracking because these yield change risks are essentially immunized. For callable securities, the cash-flows need to be distributed to the KRDs in accordance with the probability of call. A 10-year bond that is highly likely to be called in three years should have cash-flows that are allocated primarily to the three-year KRD.
Percent in Sector and Quality
The yield of the index is largely replicated by matching the percentage weight in the various sectors and qualities, assuming that the replicating portfolio fully accounts for all maturity categories. Matching duration contribution of sectors and qualities, without matching the portfolio percentage weight exposed to the sectors and qualities, may expose the portfolio to significant tracking risk during periods of extreme duress. This is due to the default risk that can reduce the value of all of an issuer’s bonds by a given magnitude, regardless of the maturity.
Duration Contribution of Sector
An effective way of protecting a portfolio from tracking differences associated with changes in sector spreads (industry risk) is to match the amount of the index duration that comes from the various sectors (see Exhibit 49–10). (This can be done without excessively constraining the process, subject to managing the market weights, as we’ve described earlier.) If this can be accomplished, a given change in sector spreads will have an equal impact on the portfolio and the index.
EXHIBIT 49–10
Sector and Quality Distribution Analysis for Barclays Capital Bond Index (as of 12/31/2010)

Duration Contribution of Quality
Similarly, the most effective way to protect a portfolio from tracking differences related to changes in quality spreads (leverage/economic risk) is to match the amount of the index duration that comes from the various quality categories. This is particularly important in the lower-rated categories, which are characterized by larger spread changes.
Sector/Coupon/Maturity Cell Weights
The call exposure of an index is difficult to replicate. By itself, the convexity value (convexity measures how a bond’s duration changes as yield levels change) is inadequate since it measures expected changes in duration over a small change in yield levels. In addition, the change in convexity can be very different as yield levels change. Managers who attempt to match only the index convexity value often find themselves having to buy or sell highly illiquid callable securities to stay matched and, in the process, generating excessive transaction costs. A better method of matching the call exposure is to match the sector, coupon, and maturity weights of the callable sectors. By matching these weights, the convexity of the index should be matched. In addition, as rates change, the changes in call exposure (convexity) of the portfolio will be matched to the index, requiring little or no rebalancing.
In the mortgage market, call (prepayment) risk is significant. The volatility in the option-adjusted duration of the Barclays Capital Mortgage Index, which measures the extent of the call exposure of the mortgage market, between 1991 and 2010 is shown in Exhibit 49–11. The graph also shows, over the same 20-year period, the Mortgage Bankers Refinancing Index (inverted), which measures the extent of mortgage refinancing occurring in the market. Clearly, the greater the refinancing activity, the shorter the index duration due to the greater likelihood that the higher coupons (issues priced above par) will be refinanced with lower coupon securities. For this reason, matching the coupon distribution of the mortgage index is critical. The best risk management is accomplished by matching the index weights in a multidimensional matrix of the maturity (balloon, 15-year, 30-year), sector (FNMA, FHLMC, GNMA), coupon (0.5% increments), and seasoning (new, moderate, and seasoned). This level of detail is easily accomplished in a large portfolio (more than $1 billion in assets), but more difficult in smaller portfolios.
EXHIBIT 49–11
Mortgage Call Exposure Analysis

The FNMA and FHLMC’s government-sponsored enterprises (GSE) disclosures of additional pool detail, such as FICO scores and average loan balances, result in further division of mortgage pricing of specified pools from “to be announced” (TBA) mortgage pricing.
Issuer Exposure
If the major risk factors described above are matched but with a limited number of issuers, one significant risk remains, but it can still be diversified away. Event risk—a risk widely watched during periods of significant corporate leveraging events (leveraged buyouts, LBOs) or during periods of significant economic stress—needs to be measured and controlled. Issuer exposure, like exposure to sector and quality, must first be measured in percentage terms versus the issuer weight in the index, because periods of serious economic distress can cause bond prices, regardless of maturity, to drop precipitously. However, setting market value limits without regard to issuer duration risk and issuer index weights is not adequate. Spreads widen immediately after a negative credit event. Therefore, an additional measure of the issuer event risk impact on a portfolio is the impact on portfolio market value of that spread widening. This can be measured by calculating how much of the portfolio duration (duration contribution) comes from the holdings in each issuer. This calculation should also be figured for the index. The basis-point impact on tracking of a spread-widening event will be the spread change (of the issuer) multiplied by the difference in duration contribution (portfolio – index) multiplied by (–1). Exhibit 49–12 provides an example of this analysis. Issuer XXX Corp has an equal percent weight to the index, but its duration contribution is 0.16 greater. If an event occurred that would widen XXX Corp spreads by 100 basis points, the portfolio would suffer an unfavorable tracking difference of 16 basis points versus the index (100 basis point spread change × 0.16 duration contribution overweight × 1). If the same 100-basis-point widening were to occur to XYZ Corp bonds, the tracking difference would be a favorable 8 basis points even though the percent weight is matched to the index. For effective index fund management, duration contribution exposure limits (versus the index) need to be set at the issuer level.
EXHIBIT 49–12
Issuer Exposure Comparison (Percent of Market Value versus Duration Contribution)

ENHANCING BOND INDEXING
In sailing, speed comes from paying close attention to the details, not simply from watching the wind. And in bond management, the return versus the benchmark is a function of more than just interest-rate maneuvering. Portfolio managers can trim their portfolio sails to compete more efficiently in the investment management race. Some trimming strategies include lower costs, issue selection, yield-curve positioning, sector and quality positioning, and call-exposure positioning.
Why Enhancements Are Necessary
Since the index does not incur expenses or transaction costs, enhancements are needed just to provide a net return equal to the index. Operating expenses provide a significant headwind, but transaction costs associated with portfolio growth are a major contributor to return shortfalls.
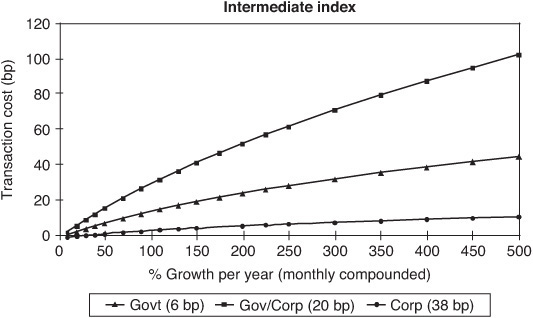
Exhibit 49–13 shows the transaction costs and resulting tracking error associated with single contribution growth and compares it with multiple contribution growth. In this example, the single contribution portfolio has a tracking error of 18 basis points associated with investing net cash-flow. In the multiple-contribution portfolio, the tracking error is significantly higher, at 41 basis points, even though the amount of transaction costs ($450,000) is identical. Therefore, portfolios with high growth rates will suffer additional negative tracking errors. So, enhancements are necessary simply to stay equal to a no-growth or slow-growth portfolio. Exhibit 49–14 shows, in graphical form, the cumulative adverse tracking impact resulting from portfolio growth for Treasury, government/corporate, and corporate portfolios. The greater the growth rate—and/or the less liquid the market—the greater the adverse impact on tracking error.
EXHIBIT 49–13
Single Contribution versus Multiple Contributions
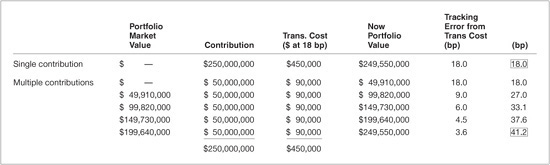
EXHIBIT 49–14
Why Enhancements Are Necessary: Return Impact of Transaction Costs over One Year
Lower-Cost Enhancements
One of the simplest, yet most overlooked, forms of enhancement is keeping costs low. Expenses/management fees and transaction costs have a significant impact on portfolio performance.
Active managers work hard—and usually unsuccessfully—to add an incremental 25 to 50 basis points per year to portfolio gross returns. Yet in the mutual fund arena, the average bond fund expense ratio is 50 to 80 basis points greater than that of the lowest-cost index portfolio. As a result, net returns of the high-expense-ratio funds are significantly lower. Even in the indexing arena, expenses vary by large margins. An investor can enhance returns simply by shopping around for the index fund with the lowest expenses, provided the net return is competitive with other index funds. For a plan sponsor with external index fund managers, having the current fund manager and one or two other reputable index fund managers rebid the business every few years will help ensure expenses are as low as possible.
Transaction costs are the other major cost factor. Since bond index funds have low annual turnover (about 40%) versus active portfolios (generally greater than 100%), transaction costs are significantly lower for index portfolios. In addition, electronic trading platforms, which enable managers to increase price competition among dealers, further reduce the transaction-cost impact. It’s imperative to include a number of brokers in the bidding process. For rapidly growing portfolios, where most of the transactions are offerings, an effective competitive trading process is essential. An efficient system of comparing the relative value of real-time offerings of target issuers and issues from many different brokers will yield significant transaction cost savings and, as a result, further enhance returns.
Issue Selection Enhancements
For U.S. Treasury securities, the primary tool for selecting cheap bonds is comparing actual bond prices to the theoretical “fitted” price. The theoretical curve minimizes the pricing errors of all Treasury issues in the market, subject to various curve-smoothing rules. Each actual bond’s yield is then compared to the bond’s fitted yield, which is calculated using the theoretical curve. Bonds yielding more than the fitted yield are cheap; those yielding less are rich. Also useful is an analysis of the recent history of the bond yield versus the fitted yield. This analysis will indicate whether a cheap bond has been getting cheaper or richer.
Corporate issue selection enhancements come primarily from staying clear of deteriorating credits and owning improving credits. The greater the manager’s confidence in the ability of the firm’s credit analyst to add value via issuer selection, the larger the maximum issuer exposure limit. (See “Primary Bond Indexing Risk Factors—Issuer Exposure” in this chapter.) If the manager does not believe the firm’s credit analysts can add value through issuer selection, the diversification among issuers must be greater.
Yield-Curve Enhancements
Various maturities along the term structure are consistently overvalued or undervalued. For example, the 10-year and 30-year Treasury regions tend to be consistently overvalued, due to the liquidity preference of those regions. Strategies that overweight the undervalued maturities and underweight the overvalued maturities, while keeping the same general term structure exposure, have tended to outperform the index. This is similar to looking for the maturities that have the more favorable “rolldown” characteristics—that is, the near-term passage of time may result in the bond rolling down the yield-curve. As a result, the security trades at a lower yield and has more opportunity for price appreciation. Cheap parts of the curve tend to have favorable roll down, while rich parts of the curve (for example, the 30-year area) tend to have little or no roll-down opportunities.
Sector/Quality Enhancements
Sector and quality enhancements take two primary forms: (1) ongoing yield tilt toward short duration corporates, and (2) periodic, minor overweighting or underweighting of sectors or qualities.
The yield-tilt enhancement (also called “corporate substitution”) strategy recognizes that the best yield spread per unit of duration risk is available in short-term (under 5-year) corporates. A strategy that underweights 1–5-year government bonds and overweights 1–5-year corporates has tended to increase the yield of the portfolio with a less-than-commensurate increase in risk—except during periods of severe economic stress. Exhibit 49–15 shows the rolling 12-month return difference between the Barclays Capital 1–5 Year Corporate Index and the Barclays Capital 1–5 Year Treasury Index.
EXHIBIT 49–15
Barclays 1–5 Year Corporate versus Barclays 1–5 Year Treasury Index: Rolling 12-Month Total Return Difference
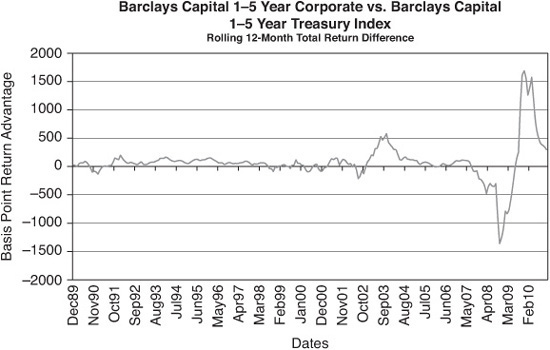
The persistent return enhancement is obvious for all periods over the last 15 years except for the brief spread-widening periods of 1990, 1998, 2000, and 2002, and a very significant widening in 2008. An economic downturn that results in significant downgrades from investment-grade to high-yield or leads to significant defaults would prove disastrous to this strategy.
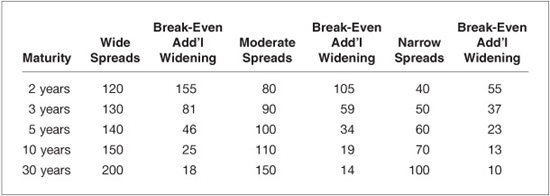
The strategy has proven effective primarily because the yield advantage of a broadly diversified portfolio of short-term corporates requires a significant corporate spread-widening move over a one-year period for short-term corporates to perform as poorly as short-term Treasuries. Exhibit 49–16 shows the spread increases that would be required to break-even with equal-risk Treasury securities over a one-year holding period. With the passage of time, the duration of corporate bonds shortens, and the yield spread over comparable Treasury securities generally narrows. These risk- reducing and return-enhancing forces, when combined with the yield-spread advantage, provide compelling reasons to overweight short corporates using a broadly diversified credit portfolio. Even at narrow spreads, significant protection is available in maturities under five years. Over the next year, a diversified two-year corporate portfolio with a yield spread of 40 basis points can widen by another 55 basis points versus a comparable duration Treasury portfolio security before it performs as poorly as the comparable Treasury portfolio. Clearly, as the maturities increase, the spread-widening protection decreases.
EXHIBIT 49–16
Break-Even Spread Widening Analysis: Corporates versus Treasuries (Assumes One-year Holding Period)
The risks involved in the strategy are recessionary spread widening risk and issuer default risk. The recessionary spread widening risk tends to be short-lived and quickly overcome by the increased yield advantage of the strategy. The issuer default risk can be minimized by broad issuer diversification (50 or more issuers), by limiting the strategy to A-rated and higher issuers, and by experienced credit analyst oversight.
The periodic overweighting or underweighting of sectors and qualities is a scaled-back version of active “sector rotation.” This can be implemented on a cost-effective basis by allowing new cash-flow (net new portfolio growth) to facilitate the mismatching. For example, if spreads are narrow going into the fourth quarter and the manager expects some widening, new money may be invested in Treasury securities to a moderate degree, resulting in a modest reduction in the corporate exposure versus the index. Once the corporate spread widening materializes, Treasury securities (with low transaction costs) can be sold and corporates overweighted. Expected first quarter asset growth will eventually bring the corporate weighting back in line with the index. A strategy of outright selling of corporates to buy Treasury securities is always difficult to justify because of the higher corporate transaction costs involved, not to mention the yield “penalty” associated with Treasury securities.
Call Exposure Enhancements
The option-adjusted duration of a callable bond is the average of the model duration, if rates rise and fall marginally. These durations under rising and falling rates can be quite different for bonds trading at a price where the bond changes from trading to maturity, to trading to call (or vice versa). The result is a situation where the bond’s actual performance could be significantly different than expected given its beginning-of-period option-adjusted duration.
Generally, the greater the expected yield change, the greater is the desire for more call protection. For premium callable bonds (bonds trading to call), the empirical duration (observed price sensitivity) tends to be less than the option-adjusted duration, resulting in underperformance during periods when rates are falling. For discount callable bonds (bonds trading to maturity), the empirical duration tends to be greater than the option-adjusted duration, resulting in underperformance in rising-rate environments. Any large deviations from the index exposure to call risk should recognize the potential significant tracking implications and the market directionality of the bet.
MEASURING SUCCESS
Of course, you can’t manage what you can’t measure. Managers understand this, but often find themselves without the proper measurement tools. Specifically, they lack accurate ways to gauge the extent of their bets, and the value added or lost from these bets. We’ve already covered measuring the extent of the bets in this chapter’s sections on risk factors and enhancements. In this section, we’ll explore how to measure whether any value has been added—and, if so, where the added value came from.
Outperform Adjusted Index Returns
Returning to the sailing theme, it’s always critical to understand how the portfolio boat is faring against the index boat. Is the portfolio gaining any ground on the index? To evaluate relative performance, the portfolio returns must be adjusted for pricing, expenses, and transaction costs for growth and rebalancing. Pricing is a key consideration, especially in enhanced indexing, where deviations versus the index are small and pricing errors can hide valuable information. If a Barclays Capital Aggregate Bond Index is used as the benchmark, the portfolio needs to be repriced with Barclays prices. Small differences in either the pricing time or the pricing matrix may result in significant differences (among pricing services) in periodic returns over short measurement periods. Over longer periods, these pricing differences will wash away. For value-added measurement purposes, though, periodic pricing accuracy is critical.
Since the index does not have transaction costs associated with asset growth, principal reinvestment, or income reinvestment, accurate adjustments to portfolio returns are needed to account for these differences. A simple way is to maintain a trading log with implied transaction costs as a percentage of total portfolio assets. The periodic summation of these implied costs provides a good estimate of tracking error drag associated with growth and income reinvestment.
Finally, an adjustment for expenses is required. As we discussed earlier, keeping expenses low is a simple way to enhance returns. Nevertheless, portfolio returns should be “grossed up” by these expenses to keep the portfolio on an equal footing with the index for measurement purposes.
Exhibit 49–17 shows the monthly adjusted tracking of a large bond index mutual fund, which in this example is managed against the Barclays Capital Aggregate Bond Index. If the enhancement sources are many and of a controlled nature, it’s expected that the average tracking difference will be small and usually positive. During periods of extreme market stress or spread volatility (for example, the 2008 credit crisis), the enhancement strategies are likely to result in increased tracking differences. As shown in the exhibit, the monthly tracking differences during this experience were small (between +13 basis points and –4 basis points) and mostly positive. Exhibit 49–18 shows a rolling 12-month summation of the monthly adjusted tracking differences. An enhanced indexing strategy that has good risk management and diversified enhancements should be able to consistently outperform the index during most periods. Falling below the index return over the 12 months would most likely be the result either of not matching the index risk properly, of enhancement strategies that were not adequately diversified, or of significant market stresses (three or more standard deviation events) adversely affecting the enhancement strategies.
EXHIBIT 49–17
Consistent Positive Tracking: Bond Index Portfolio versus Barclays Capital Aggregate Index Monthly Adjusted Tracking Difference

EXHIBIT 49–18
Consistent Positive Tracking: Bond Index Portfolio versus Barclays Index Trailing 12-Month Total Adjusted Tracking Difference

Low and Stable Monthly Tracking Differences
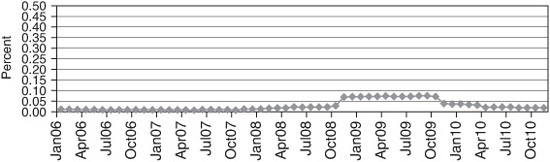
The other measure of indexing success is how closely the portfolio is exposed to the same risk factors as the index. This can be measured by evaluating the rolling 12-month standard deviation of adjusted tracking differences of the portfolio versus the index. Exhibit 49–19 uses the same bond index mutual fund example used in Exhibit 49–18, managed against the Barclays Capital Aggregate Bond Index. If a portfolio is properly exposed to the index risk factors, the standard deviation will be low and stable over most periods, as we see. Periods of excessive market stress and spread volatility may result in higher standard deviations of tracking differences. However, the increases should be roughly proportional to the spread volatility increase or explainable by idiosyncratic credit risk (sample risk).
EXHIBIT 49–19
Tight Tracking Standard Deviations Bond Index Portfolio versus Barclays Capital Index—Trailing 12-Month Standard Deviation of Adjusted Tracking Difference
Consistent Positive Information Ratios
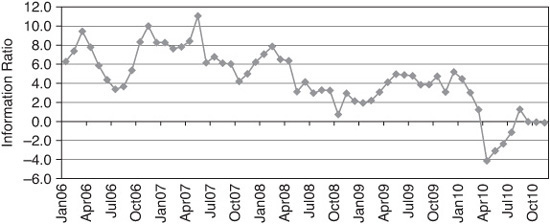
The information ratio is a good way to evaluate enhanced indexing success. This measures the amount of value added versus the index relative to the risk taken. It can be calculated by dividing the trailing 12-month tracking difference (adjusted for expenses, pricing, and transaction costs of growth) by the annualized trailing 12-month standard deviation of monthly adjusted tracking errors. An effective and diversified enhanced indexing strategy should keep this ratio in the range of 1 to 3 over most periods. Exhibit 49–20 shows a consistent positive information ratio from the same mutual fund example we used in the past few exhibits.
EXHIBIT 49–20
Consistent Positive Information Ratio Bond Index Portfolio versus Barclays Capital Aggregate Index Trailing 12-Month Information Ratio
Detailed Performance Attribution
A manager needs excellent performance attribution tools to accurately measure the success of risk factor management and the enhancement strategies. The performance attribution analysis should attribute tracking error to term structure factors, sector bets, quality bets, and issue selection across sectors and qualities.
The term structure attribution should be analyzed at the portfolio level versus the index. The sector and quality attribution (allocation and issue selection) should be analyzed at the sector and subsector levels (detailed sector and maturity categories) with the ability to drill down to issue-level detail. Issue performance should be risk-adjusted (versus Treasury equivalent returns) with subsector, sector, and portfolio returns rolled up from the security level. This level of attribution will provide the manager with the tools to measure, with precision, the risk matching and return enhancing strategies. The result: winning the race against both the index and most managers.
KEY POINTS
• Full replication of a broad bond index is inefficient, if not impossible.
• Active bond managers intentionally position the portfolio with mismatches in risk factors in an attempt to add value above the index return.
• The core/satellite approach often uses low cost index strategies for the core portfolio and a variety of higher cost active strategies for the satellite strategies.
• The satellite portion of a portfolio focuses on the less liquid sectors which are expected to have lower correlations with the broad liquid core and where issue selection is expected to add value.
• Reasons to index bond include broad diversification, low cost, competitive performance, consistent relative performance, market performance predictability, and a time-tested record of success.
• In selecting an index for a given risk level, generally a broader index (sectors, maturities, issuers, etc.) is better than a narrow index.
• Subindices of a broad index can be created to capture different risk/return profiles (e.g., varying durations, varying credit exposures, etc.).
• For investors who are risk-averse (regarding possible loss of principal), a short-term or intermediate-term index is more appropriate than a long-term index.
• If stability and durability of income are the primary concerns, the long-term portfolio is the least risky, and the short-term portfolio the most risky.
• The primary bond index risk factors are portfolio adjusted duration, portfolio key rate duration exposures, portfolio sector and quality exposures (in percent and contribution to duration), mortgage coupon and maturity exposures, and issuer diversification.
• Since index returns are not adjusted to expenses and transactions costs, enhancements are needed just to provide a net return equal to the index.
• Return enhancements to help offset index portfolio management and transaction costs include lowering management and operating costs, issue selection strategies, yield-curve strategies, sector/quality strategies, and optimal call exposure strategies.
• Measuring success entails evaluating value added relative to a benchmark in the context of risk assumed relative to the benchmark.