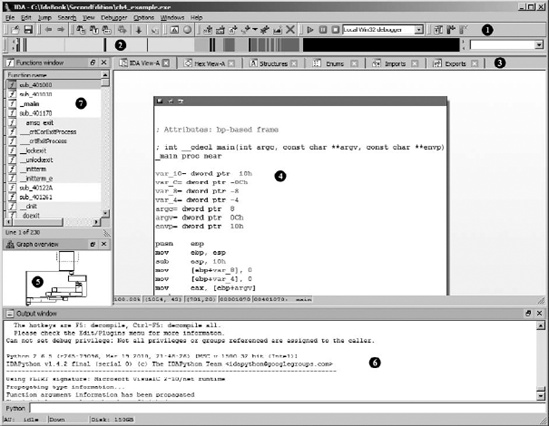
Given the amount of time you are likely to spend staring at your IDA desktop, you will want to spend some time familiarizing yourself with its various components. Figure 4-9 shows an overview of a default IDA desktop. The behavior of the desktop during file analysis is discussed in the following section.
Areas of interest in this introductory view include the following:
The toolbar area
 contains tools corresponding to the most commonly used IDA operations. Toolbars are added to and removed from the desktop using the View ▸ Toolbars command. Using drag-and-drop, you can reposition each of the toolbars to suit your needs. Figure 4-9 shows IDA’s basic mode toolbar with a single row of tool buttons. An advanced mode toolbar is available using View ▸ Toolbars ▸ Advanced mode. The Advanced mode toolbars contain three full rows of tool buttons.
The horizontal color band is IDA’s overview navigator
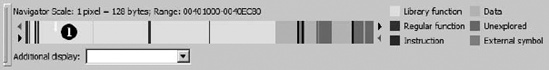
 , also called the navigation band. The navigation band presents a linear view of the address space of the loaded file. By default, the entire address range of the binary is represented. You can zoom in and out of the address range by right-clicking anywhere within the navigation band and selecting one of the available zoom options. Different colors represent different types of file content, such as data or code. A small current position indicator (yellow by default) points at the navigation band address that corresponds to the current address range being displayed in the disassembly window. Hovering the mouse cursor over any portion of the navigation band yields a tool tip that describes that location in the binary. Clicking the navigation band jumps the disassembly view to the selected location within the binary. The colors used in the navigation band can be customized using the Options ▸ Colors command. Dragging the navigation band away from the IDA desktop yields a detached Overview Navigator, as shown in Figure 4-10. Also shown in Figure 4-10 is the current position indicator (the half-length, downward-facing arrow to the left of location ) and a color key identifying the file content by functional groups.
Coming back to Figure 4-9, tabs
 are provided for each of the currently open data displays. Data displays contain information extracted from the binary and represent the various views into the database. The majority of your analysis work is likely to take place through interaction with the available data displays. Figure 4-9 shows three of the available data displays: IDA-View, Functions, and Graph Overview. Additional data displays are available via the View ▸ Open Subviews menu, and this menu is also used to restore any displays that have been closed, whether on purpose or inadvertently.
The disassembly view
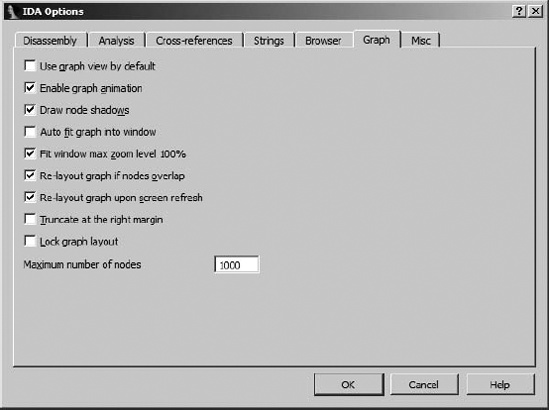
 is the primary data display. Two display styles are available for the disassembly view: graph view (default) and listing view. In graph view, IDA displays a flowchart-style graph of a single function at any given time. When this is combined with the graph overview, you can gain an understanding of the flow of the function using a visual breakdown of the function’s structure. When the IDA-View window is active, the spacebar toggles between graph view–style and listing-style displays. If you wish to make listing view your default, you must uncheck Use graph view by default on the Graph tab via the Options ▸ General menu, as shown in Figure 4-11.
In graph view, it is seldom possible to fit the entire graph of a function into the display area at one time. The graph overview
 , present only when graph view is active, provides a zoomed-out snapshot of the basic graph structure. A dotted rectangle indicates the current display within the graph view. Clicking within the graph overview repositions the graph view accordingly.
The Output window
 is where you can expect to find any informational messages generated by IDA. Here you will find status messages concerning the progress of the file-analysis phase, along with any error messages resulting from user-requested operations. The Output window roughly equates to a console output device.
The Functions window
 rounds out the default IDA display windows and will be discussed further in Chapter 5.