CHAPTER 4
Collaborate to Set Priorities
Focus on the highest-impact opportunities and align stakeholders behind your product’s goals.
What you’ll learn in this chapter
1 Your role as a product manager in evaluating and driving alignment of product priorities and the frequent challenges you will face.
2 Techniques you can use for collaboratively prioritizing product initiatives, whatever your company culture, while balancing the need for speed and precision.
3 How to approach the incremental optimization of existing features using user-behavior feedback loops through split-testing.
Why Product Prioritization Is Hard
If there is one responsibility that keeps product managers on their toes more than any other, it is deciding what to prioritize. Deciding what to build—and, critically, what not to build—is arguably the most important role you, as a product manager, will play in driving value for your company. Building the wrong thing can be incredibly costly, not just in time and resources but in opportunity cost. Your credibility, as well as team morale, will be negatively affected if you work on initiatives (regardless of origin) that have marginal value to the business and your customers, fail to challenge rationale and assumptions, or gather insufficient data to inform prioritization decisions.
Yet failure, at some level, is inevitable.
Prioritization is about striking a balance between two competing needs. Yes, you want always to be building, always to be shipping, and always to be learning. But you also need to gather and use the best information you can get ahold of to make sure your team focuses on what is most important.
Failure is okay if you could not have anticipated it. It is not okay if you did not do the hard work up front to evaluate a proposed project or feature carefully.
Here are the most common challenges you might face as you navigate prioritization, with tips for making the journey smoother.
1. Process Is the Easy Bit; People Are the Hard Bit
Throughout your organization, you will have many stakeholders who have an opinion on what you should build next. They all consider themselves experts—and they all are, within their respective domains. Your user experience team might see ways to enhance the product flow to improve customer satisfaction; a business lead might see opportunities to increase customer acquisition and revenue; a founder might imagine dozens of potential new features that, if implemented, take the product closer to realizing his or her vision; the sales team might request short-term features as demanded by a big prospective customer they want to land; and an engineering lead might see ways to rework some core technology, so it scales and performs better.
They all feel emotionally attached to their ideas—and have a sense of urgency about them. And all think that the company does not appreciate and act on their ideas fast enough.
The answer is to see prioritization as a collaboration, not simply a process. Give your team, stakeholders, and even your customers the opportunity to provide input and influence decisions in two discrete ways:
1. Discuss user, business, and product goals (not features) and their relative importance—Stakeholders will need to agree on the vision and objectives of the product before they ever agree on projects and features. Get senior stakeholders in alignment and be explicit on low-priority (or no-priority) goals.
2. Gather features and enhancement ideas—View ideas as mere candidates and never evaluate an idea in isolation from others. Document the idea, why it is being proposed, and any supporting evidence.
Do each step separately. By first aligning on goals, you can set the context in which to make feature level decisions. Prioritize ideas relative to one another to determine which are more likely than others to advance your goals. If you receive further stakeholder pushback, then the question becomes “Have the goals changed?” rather than “Which is the more important feature?”
Later in this chapter, I will introduce frameworks you can use to manage your prioritization process, but don’t use them in a silo. Instead, collaborate and be transparent. Don’t sacrifice progress trying to get unilateral buy-in, however; you will rarely—perhaps never—reach a unanimous consensus. Stakeholder groups have far too distinct and conflicting goals.
2. Saying No Is Unpleasant
Product managers want to please both stakeholders and customers, and each group can sometimes be convincing, or even forceful, in their demands. Perhaps they’ve put a lot into thinking about and communicating their ideas. The absence of a solution might cause them more pain; for instance, a lack of tools or features makes their job a lot more difficult. Saying no to their request might feel, to them, like a personal rejection, because emotions invariably get involved.
By definition, however, prioritizing an item of work over other work is a zero-sum game due to limited resources. Saying “yes” to more than the team can do sets you up to miss expectations—either something you promised to someone else earlier will get bumped, or the new request won’t be worked on anytime soon. Whatever you do, you’re going to upset somebody.
![]() See Chapter 1 for more ways to handle stakeholder ideas, including nice ways to say no.
See Chapter 1 for more ways to handle stakeholder ideas, including nice ways to say no.
Recognizing what not to prioritize is as important as knowing what to prioritize. If the work you’ve planned doesn’t make sense in the broader context of your strategy and goals, then don’t work on it. Furthermore, don’t let inertia allow you to continue to work on something that no longer makes sense. When necessary, it’s better to bravely cancel a project.
3. There Is Never Enough Data
You can’t always be entirely confident that you are setting the right priorities. Even if you do have lots of data, you may have conflicting input from customers, stakeholders, your team, and your research.
If you’re endlessly collecting more data to inform choices or win over stakeholder objections, you’re experiencing analysis paralysis. Recognize that the mere act of analyzing a potential project is to prioritize working on it. Approach prioritization as an ongoing task. Set the expectation with your team and stakeholders up front that you will frequently revisit priorities as you continually gather new data. Blend techniques that you can implement quickly and collaboratively, with more detailed analyses of customer needs and business opportunities as needed.
Your objective should be to seek proof points so you can confirm priorities with supporting data, research, and tests. Focus on learning and tweak priorities as you discover new information. But never prioritize a project without some convincing evidence that it may be valuable to customers and your business.
Second, break larger projects into smaller ones. Because prioritization is about making progress toward goals, focus on the critical part of each initiative first. The Pareto Principle3 suggests that 20 percent of the effort is likely to generate 80 percent of the benefit toward your goal. It is better to stop working on a priority once you’ve done enough to deliver on the highest-impact components and then move onto what’s next on the list. You can always return to it later if you think there are additional business opportunities to capture.
![]() You can read more about validation and prototyping in Chapter 5.
You can read more about validation and prototyping in Chapter 5.
Finally, do not forget your project list is just a list of candidates—a set of hypotheses about what might advance your product goals. It should not be interpreted as a list of commitments. Conduct validation, including prototyping and launching a small increment of the broader feature set first. Be prepared to eliminate a priority that has turned out to be less promising.
4. Dealing with the Loudest Voices in the Room
Perhaps a senior leader is asserting their opinions as truth, prescribing priorities without providing context and data, and not understanding the consequences for other potential projects. Or maybe a strong type A personality has debated others into a corner, presenting the illusion of having achieved consensus. While you must win over stakeholders, their opinion is still just one among many; and though they’re experts, gut feelings are not a good way to prioritize work.
Sometimes it is okay to give in if, in the long run, it will build trust and the idea seems solid enough. But if it is a recurring issue, giving in can undermine the quality of the product and set the precedent that this is how the company sets priorities.
There is no simple approach to this issue. Each situation is different given individual personalities and leadership styles (for example, you may feel overwhelmed if the challenging individual is senior to you); however, here are a few methods you can try:
• Bring data—Negotiate more time to complete and share some analysis before declaring the project a priority. The act of presenting objective, challenging insights might be enough for the stakeholder to change their mind; but even if they do not, the decision can be taken with a greater understanding of the risks.
• Include resourcing, dependencies, and consequences in the conversation—They may change their mind once they learn that the cost is too high or that another critical project will be delayed to pursue theirs instead.
• Return the conversation to goals and objectives—If goals have changed, that needs to be reflected in the overall priorities, not just in the priorities for this project; in other words, such change would likely impact projects. Reinforcing the currently agreed overall goals might be enough to convince them to deprioritize the request.
• Reiterate what is in the plan—Busy stakeholders often forget what is already being worked on. Issues that arose earlier and are now being addressed by the development team are considered resolved in the mind of the stakeholder, so they move onto new issues. Remind them that you’re working on what were previously agreed to be the topmost priorities. Be specific (list the specific initiatives you’re working on, for example) and tell them that there is no excess capacity—if necessary, show them how each person on the team is currently allocated—and, to switch priorities, a tradeoff would have to be made.
The longer-term solution is to structure a methodical and transparent prioritization process. Doing so puts you in the driver’s seat—you provide data, prepare recommendations, and invite input. You will build trust through transparency and, perhaps, see most of your recommendations adopted. At the same time, stakeholders feel they can strongly influence outcomes and that you are open to their input. Use one of the techniques discussed later in this chapter to formalize how goal-driven prioritization occurs.
![]() See the section on product governance in Chapter 2.
See the section on product governance in Chapter 2.
5. Disruptions out of Nowhere Always Jump to Priority Number One
Perhaps a product outage requires all hands on deck to address. Maybe a key customer is insisting on specific features. Or sales may ask for something that’s likely to help them land a big client.
For the unavoidable disruptions, plan to make slower progress against priorities. Surface the issue and show the impact. If it happens consistently, then you may have a dire quality issue. Or it may simply be that urgent issues keep jumping the queue whether or not they are actually important.
For example, in sales-led organizations, especially those selling to large enterprise companies, stakeholders may escalate urgent requests to land a large client, effectively sidestepping the prioritization process. Try not to react to incoming requests from sales or customers; instead, escalate the issue to your product leadership. This may be challenging. If so, remind them that you’re developing a solution to be used by many customers, not just one. If you hear the same request frequently, however, that is indeed cause to consider the item for prioritization.
What matters in determining priorities is understanding the core of what customers need (value), how they want to use your product (usability), and what you can reasonably build (deliverability).
Techniques to Make Product Prioritization Easier
No prioritization approach works consistently across all organizations, given their different sizes, product lifecycle stages, decision-making structures, and cultures. Even within one company, a single methodology may not be suitable for the full range of initiatives under consideration. How, for instance, can you prioritize an initiative that is innovative and strategic but has a high risk of failure, an unknown scope, and a payback period well into the future against others that are well defined and of easily quantified business value?
The best techniques work top-down: they provide context and assessment criteria by prioritizing high-level customer and business goals first. You then map feature level details to these goals and evaluate their importance based on where the most value will be created. This approach is also highly adaptable. Top-level goals should change infrequently and be clearly visible to product managers and their teams. That way, product managers are empowered to move to the next priority should one that appeared promising turn out not to be so.
If your organization does not already have a standard prioritization approach, then select from the many techniques available and adapt them to suit your situation. Use them consistently so you can make relative assessments among options and refresh (rather than reinvent) your priorities regularly. I recommend you use several complementary methods concurrently—looking at your priorities from different angles will give you a better perspective.
Ultimately, regardless of which methodology you use, what matters is that you collaborate and discuss the priorities. You and stakeholders must agree on
1. the process for making prioritization decisions,
2. the overall goals and criteria to make evaluations, and
3. your rationale for and assessment of the initiatives that you believe will have most impact on those goals.
Your objective is to develop a plan that will allow your team to focus on the essential work and to leave other initiatives out of scope (for now). Your plan will be one your stakeholders can buy into even if they don’t necessarily agree with everything.
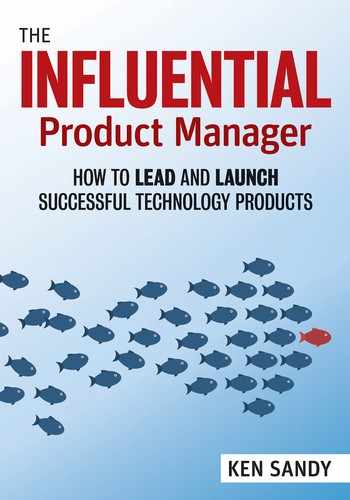
Referring to Figure 4.1, you can categorize prioritization techniques into four groups:
Quantitative methods attempt to convert goals, project impact, and effort into numbers and calculate a set of ranked priorities. They can also be used to determine whether a project is financially viable or not.
Qualitative methods try to frame business goals and customer needs, using the collective wisdom of your team, stakeholders, and customers to identify priorities most likely to achieve those goals. The accuracy of qualitative methods is not necessarily lower than that of quantitative methods; a set of assumptions converted into numbers are still assumptions and can give a false sense of precision.
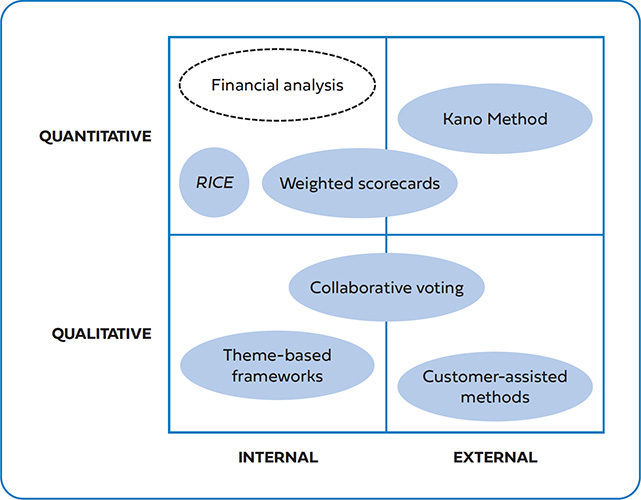
FIGURE 4.1 Example collaborative prioritization techniques
You can further categorize these methods into the dominant set of inputs that go into the prioritization process. Internal approaches rely more on the data and perspectives already found within a company. They might include business goals, product performance data, stakeholder opinions, and existing-customer insights. Internal approaches are best when you already have a lot of knowledge to digest and to use to drive decisions. However, internal approaches might miss crucial new market information and are subject to groupthink bias.
External approaches leverage input from customers directly—helping determine needs, as well as areas of satisfaction and dissatisfaction, and getting buy-in and participation in ranking priorities. External approaches are best if you have little existing data, are in the early stages of your product development lifecycle, or want to add the voice of the customer into a prioritization process that otherwise might favor short-term business goals. Be sure, however, that you don’t have just a few key customers determining feature-level requirements.
Some prioritization techniques are far more time- and resource-intensive than others. For example, financial analysis and the Kano Method require extensive data-gathering—the former involves modeling; the latter, interviewing many customers. Simpler techniques such as weighted scorecards or theme-based frameworks, although inappropriate for making major investment decisions, can be quickly completed and frequently updated. Simpler techniques are also useful in getting alignment or revealing any misalignment. Here’s why:
1. Within a stakeholder group, there tends to be more agreement than not on the critical priorities. (Although there may be disagreement on less critical priorities, these initiatives won’t be worked on soon anyway.)
2. You will more quickly discover any dispute on overall goals and evaluation criteria—and without agreement on these, you cannot determine feature-level priorities anyway.
While there are hundreds of methods and adaptations, I’ve chosen a few to include here because they are particularly effective based on their structure and creativity and because they demonstrate the full spectrum of quantitative and qualitative prioritization techniques. Some are simple and useful in guiding you on the direction you should take; others are more complex (and therefore time-consuming) and robust enough to determine major investments.
Weighted Scorecards (Quantitative-Internal)
Weighted scorecards accelerate goal-driven prioritization as a counterbalance to purely intuitive decisions that might otherwise prevail when there’s a lack of time, limited data, or a “loud voice” in the room. Scorecards align stakeholders on overall goals, their relative importance, and the features likely to be of more benefit than others. They make assessment criteria explicit—forcing a discussion on the criteria rather than a debate on pet features. While you generate the framework internally, you can validate scorecards with trusted customers for additional confidence.
1. Agree on the scoring criteria to use—First, establish a set of evaluation criteria to use to score your features. Here are examples of commonly considered criteria:
![]() Improve customer satisfaction (add features, improve user experience).
Improve customer satisfaction (add features, improve user experience).
![]() Drive revenue (ARPU).
Drive revenue (ARPU).
![]() Accelerate growth (increase market share, scale).
Accelerate growth (increase market share, scale).
![]() Develop new markets (add segments, geographies).
Develop new markets (add segments, geographies).
![]() Enhance customer conversion or retention.
Enhance customer conversion or retention.
![]() Lower costs (enhance operational productivity).
Lower costs (enhance operational productivity).
Although scorecards have the benefit of being able to include everyone’s suggestions, as a general rule, a few criteria are better than many. Avoid expressing criteria in terms of business benefits alone. You, as the voice of the customer, must advocate for purely customer-centric goals to be included as part of the overall criteria. Similarly, include operational criteria (such as productivity improvements achieved through evolving the tools to manage and support your product). Because these criteria are often not as visible to stakeholders, they can be overlooked or undervalued. Even if their weighting is low, there is a good chance a few key improvements will result in their scoring high enough for inclusion in the overall priorities list.
Once you have agreed with stakeholders on the proposed criteria, determine together the relative weight (in importance) of each. The sum of the weights of all criteria should equal 100 percent. For example, as illustrated by Figure 4.2, together with your stakeholders, you might determine criteria number one to be 40 percent of the overall importance, with another four goals ranking between 10 to 25 percent of the total weighting each.
2. Identify feature candidates to evaluate against the criteria—Create a list of ideas including your research, those you have gathered in brainstorming and by interviewing stakeholders. Stakeholders may wish to include 10 to 20 features each, but it is not possible to understand and evaluate so many items simultaneously. A too-long list may cause the process to get bogged down with debates over rankings of marginal project ideas that have too little data to inform a decision.
You must balance efficiency with the desire to reassure stakeholders that their ideas have been considered. To do so, try asking stakeholders to provide you with a full list but to force-rank their top three for evaluation. Once this exercise is done a few times, you can slate the next tiers of priorities for later consideration.
You may choose to perform this exercise with stakeholders individually first (on their list only). Then, once individual consolidations are done, it should be easier to combine scorecards. If items appear multiple times, you can easily spot where stakeholders share a point of view (such as a project that is consistently ranked high by multiple stakeholders) and where there may be misalignment (such as the same project appearing in multiple lists but with wildly different scores for the criteria).
3. Enter the features, along with the criteria and their weights, in a spreadsheet—A simple spreadsheet will allow you to make and calculate scores and to rank and fine-tune results with decision-makers. To populate the spreadsheet, gather all of your feature candidates. You may need to add a brief two-sentence description of each feature to ensure a shared understanding of what each is to achieve. Then list your features in the rows and your criteria and weights in the columns.
4. Score feature impact on each criterion—Give each criterion a rank anywhere from 0 (no impact) to 100 (very high impact), using multiples of 10. Rankings need not be highly accurate but should be debated objectively, using rationale and data (if you have it), to surface disagreements.
You will unlikely reach a firm consensus on scores—look for those scores with the largest variance and difference of opinions that, if changed, might drive a different outcome in the ranks. Debate those more rigorously.
In Figure 4.2, feature 1 clearly improves revenue and growth, with less impact on other areas. The weighted impact is (80 χ 40 percent) + (0 χ 20 percent) + (50 χ 10 percent) + (80 × 25 percent) + (10 × 15 percent) = 59.
5. Estimate cost for each feature—Costs come in three categories: implementation, operational cost, and risk. A simple “T-shirt size” evaluation (S, M, L, XL, XXL) is all you require at this point. Add this as another column next to your score, for an overall perspective of impact versus effort/risk. Draw a hard line, shading lower-priority features as out of scope, because higher priorities already exceed available resourcing.
In Figure 4.2, you may notice that features 2 and 3 require lower effort than feature 1 and have a combined impact of 99. These may, therefore, be better candidates to work on before working on feature 1.
6. Bring stakeholders together to discuss—Rather than argue each feature’s merits, debate the overall goals and the relative contribution of each initiative toward those goals. You are likely to uncover missing criteria, particularly those of less vocal stakeholders who (once they realize how projects become priorities) will now push for their objectives. Scorecards also show stakeholders that you are seriously considering their needs but that there may be competing priorities that take precedence.
Some issues with scorecards:
• Although they appear to be quantitative, weights and scores can be easily biased. Scorecards are not a useful tool in environments where priorities are primarily influenced through lobbying or for those who are not open to challenging their strongly-held opinions. It is too easy to game the scoring to get the outcomes they want.
Scorecards Can Be Easily Biased
My manager was in charge of prioritization for all the product initiatives across the company. He built a spreadsheet that allowed us to line up all the projects we could do inside the rows—about 50 in all. In each column, we placed the top-level business criteria, including revenue, customer satisfaction, cost reduction, and stability. Then using a scale of 1 to 5, we rated the impact we thought each project would make against each criterion.
We also added a “level of effort” (LOE), which told us roughly how many resources each project would take to be implemented. This scoring methodology allowed us to use business criteria to rank projects—the more impact across more business criteria, the higher a project would automatically rank. Projects that impacted only one measure, or those that impacted several measures but did so only weakly, naturally fell down the list.
Did it work? Well, almost. For the first time, we had a clearer understanding of which initiatives would be more likely to produce the desired business outcomes. And since, with limited resources, there were way too many projects on the list to possibly do them all, it made it easier to decide what not to do.
It also proved still too subjective to be used alone—just by changing a couple of the 1-to-5 rankings, you could force a project to rank higher on the list. Occasionally stakeholders pushed for a number to be higher as a way to get something done earlier.
• External customer perspectives and risks are not always fully considered.
• If you have too many criteria, you might end up with a product plan with many fragmented features that does not deliver a single coherent product vision.
Because of these significant limitations, do not “outsource” your prioritization solely to weighted scorecards—use them to anchor discussion and drive alignment. They are but one input in deciding prioritization.
Theme-Based Frameworks (Qualitative-Internal)
Focusing on themes rather than projects elevates prioritization discussions—they become more strategic with greater emphasis on the business outcomes. Among the benefits, theme-based frameworks do the following:
• Enable you to debate goals, results, and metrics rather than ideas.
• Substantially reduce the number of items to prioritize. It’s easier to force-rank five themes than rank dozens of projects with wildly different benefits.
• Naturally align with resource allocations. For example, you can staff a team for each theme to ensure a dedicated and focused effort on each.
• Allow for concurrent work on several key themes. More important themes receive more of the available resources. However, some resources can be made available to less critical themes to allow them to make some progress rather than none.
• Empower teams and product managers with the flexibility to adjust prioritization decisions within a theme as they validate and learn—that way, they are always working on the priority most likely to advance that theme.
• Naturally lead to hold teams accountable to key performance indicators (KPIs), objectives-and-key-results (OKRs), and product performance metrics, and not just to project execution.
Theme-based prioritization is best when managing an overall product portfolio. If you are in charge of a smaller product area, you might be assigned a theme with goals that are more or less set. In that case, themes are helpful for putting your work in context so you can support overall company goals and understand resource constraints.
A theme can be any strategic imperative for your product. Here are some ways to come up with your own themes:
• See the overall criteria under weighted scorecards (above).
• Use the customer funnels outlined in Chapter 11. Each stage (acquisition, conversion, activation, retention, upsell) can be a theme.
• Overall product initiatives can be themes, each perhaps separately staffed. Examples include growth, onboarding, business tools, community development, internationalization, discovery and search, personalization, scale and speed, and technical debt removal. Each theme must also include a set of accountable business metrics.
• Customer segments can be themes (if you have different products for each). Include a set of priorities advancing each segments’ needs, with resources allocated in proportion to potential growth and value.
• If you set quarterly business goals or use OKRs, the objectives (not key results) might provide a good set of themes if they don’t change too frequently.
In the online resources at http://www.influentialpm.com, you will find a theme-based prioritization framework with an example.
McAllister’s Framework
Perhaps the best-known, theme-based methodology for prioritization is that proposed by Ian McAllister, former head of product for Airbnb.4 McAllister’s framework is best used at a larger company where teams can be dedicated against individual themes:
1. Identify and prioritize themes, not projects—Create a list of themes and force-rank the top three. Rank them according to greatest need, given your product’s lifecycle stage, and how they align with companywide goals.
2. Sequence and resource your themes—For the few themes you’ll be focusing on now, roughly allocate resources, time, or both. Do this before you discuss features or specific initiatives. While you should provide a recommendation as a starting point, it is essential to get buy-in from managers and stakeholders to reaffirm that these are the right themes and that time and resources are correctly allocated.
3. Map projects to themes—Take your potential project list and map each project as a candidate under one of the themes. (Even if a project impacts several themes, allocate it under the one with which it is primarily associated so as not to complicate the process.) Themes that have not had much previous attention are likely to have few associated projects so you may need to brainstorm to add more ideas.
4. Estimate potential impact and cost—For each project, assign an order of magnitude (0 through 10) or T-shirt size. Impact is the level at which you believe you will advance the theme; cost is a high-level estimate (SWAG) for development effort.
5. Prioritize projects within each theme—With your team, decide on which projects to tackle first, based on their impact and effort. Do not reconsolidate your projects into a single list but keep them separate under each theme. Allow teams to revisit their lists to ensure they are working on those projects presenting greatest opportunity.
When using McAllister’s framework, I recommend you do the following:
• Define a quantifiable metric for each theme in step 1. That way, each theme can be described in terms of its business outcome, and you can measure team accountability.
• Draw a hard line to scope out projects under each theme that won’t be worked on due to higher priorities and limited resources. Keep visibility on what you are saying no to. Should a higher-potential idea turn out to be less promising, you can always move another project up above the line.
• Measure how much of your allocated resources end up working on each theme (rather than on other priorities). Exclude overheads like meetings, but do include being pulled into other teams to help and working on projects or bugs not aligned with advancing the theme. Regularly (perhaps monthly) review results with stakeholders. You may find that the allocated resources are incorrect and need to be shifted or that more discipline is required to stick to the allocations. Without this step, you are in danger of making less progress on the theme than expected (and disappointing stakeholders through no fault of your own).

Making Engineering Effort Estimates
Few things can create friction more easily than asking a development team to estimate the required “effort” for a project with nothing more than a two-line description to go on. And who can blame them? You are essentially asking them to provide an estimate for a project entirely lacking in scope.
Some companies have successfully moved away from this practice, instead emphasizing time to discover and validate scope and using roadmaps with only vague timelines.
If you must ask engineering for estimates to help you prioritize work, here are some tips to make this process more successful:
• Keep estimation relative, perhaps by using T-shirt sizing, and avoid using developer months or dates.
• Pick the initiative with the best-known scope, or one that has already been delivered, and assign a size to it first. Then compare and score each additional initiative in relation to it.
• Add a risk column to your assessment, including cost risk, scope risk, and feasibility risk. This additional factor provides an outlet for engineering to express uncertainty. You can then choose to prioritize lower-risk choices or, better still, to prioritize discovery and research of high-risk items to uncover any surprises early.
• Never let estimates be used for any other purpose, especially to imply developer commitments. You’ll never get them to engage with you again.
• Use “effort” estimates sparingly as the key determiner of priorities. If you focus on only the low-cost, low-risk initiatives, you will end up with a pretty mediocre product. Sometimes, you should prioritize exploration of a high-effort initiative. You are likely to drive the highest value by doing the hard stuff that others are not.
Feature Buckets
Adam Nash’s feature buckets5 is a favorite among startups and one of the most straightforward theme-based frameworks to use. Simply breakdown feature ideas into one of four buckets. Regularly including something from each bucket in releases leads to a well-rounded product and helps avoid focusing on customer requests to the exclusion of longer-term innovation. Features don’t have to fit into only one bucket—they may fit several. Here are some feature buckets recommended by Nash:
• Metrics movers—This bucket includes features that focus on stated business and product metrics. A prerequisite is that you have established a defined customer funnel and value-based metrics for evaluating features (Chapter 11).
• Customer requests—Includes features and incremental enhancements that customers are directly asking for. These may be gathered from customer feedback or requested by sales. Prioritization might be by revenue opportunity or whether they keep an important customer satisfied.
• Delighters—Innovations that are internally generated based on insights or differentiating ideas. Customers are not asking for them but will be pleasantly surprised if you deliver them.
• Strategics—Features related to learning or long-term future goals. Some teams combine this category with the former one, as Nash defines the strategic bucket as often the first step toward discovering innovations. If your company is poor at experimenting with new ideas, however, keep the two buckets separate.
To build on Nash’s framework, one additional bucket I recommend is this:
• Enhancers—A constant set of improvements to the health of the underlying technology or to eliminate minor usability irritants. Gradually work down a list of reported bugs or design issues. Without this category, you may overlook the collective impact of a lot of small wins.
Although from one release to the next you may emphasize one bucket over another, track what you do from each bucket over time. This will help determine a rough “portfolio investment.” If you see too little investment in any one bucket, it might be time to raise its profile.
Collaborative Voting (Qualitative-Blended)
Use collaborative voting techniques with internal stakeholders, customers, or both (but not at the same time). The premise is quite simple: the collective wisdom of a group of experts is likely to be a good indication of actual priorities. These techniques are best deployed to get consensus in a fast-paced, highly transparent organization where you must reach decisions quickly but can revisit them as needed and as more is learned.
Don’t assign priorities strictly according to what players vote for (as this nullifies your role as product manager). Instead, use these collaborative methods to encourage participants to consider and explain their rationales for trade-offs. Their justifications will, in turn, inform your prioritization.
When running a collaborative process, be sure to avoid creating biases. For example, this can happen when junior employees just go along with the viewpoints of their seniors or stay silent rather than express a different point of view and risk conflict. Set the expectation that the process be democratic and safe. Consider, as well, staggering the voting to leave those most senior to vote last.
The KJ Method
The KJ Method, also known as an affinity diagram, was developed by Jiro Kawakita in the 1960s. It identifies and groups similar needs, building perspective as to where the best opportunities lie. The process starts with free subjective opinions from individual stakeholders and ends with objectivity and consensus through group voting and sharing of explicit rationale.
This method can be used for any level of prioritization, from high-level themes to granular priorities within a specific product area, and, as such, it is an excellent method for any level of product manager to reach consensus with their teams and stakeholders. It is also an excellent generative brainstorming framework. You should facilitate the process, as follows, being careful to move deliberately through each step to be confident of the outcome:
1. Recruit a diverse group—Bring together people from different parts of the organization, various informed advisors, or even disparate customer types. They don’t all have to be senior stakeholders or experts but should have a wide variety of perspectives.
2. Pose the focus question—Depending on what you are trying to drive ideation and prioritization, write and communicate an overarching question to anchor the process. Here are a few examples:
![]() “What are users coming to our product for?”
“What are users coming to our product for?”
![]() “Where are users struggling to use our product as it is today?”
“Where are users struggling to use our product as it is today?”
![]() “How could we increase user engagement?”
“How could we increase user engagement?”
![]() “What tools and systems would make us a more efficient organization?”
“What tools and systems would make us a more efficient organization?”
Write your focus question at the top of a whiteboard.
3. Have everyone put answers onto sticky notes—Start with individual brainstorming where participants write ideas, opinions, and (if possible) rationale onto sticky notes. Have each member work alone and in silence to write as many as possible. Don’t allow sharing, critique, or debate at this point.
4. Share and place sticky notes—Have each participant read out their answers and place them up on the whiteboard. Go around the room, with each participant selecting one answer to present on each turn until all responses are exhausted. Some details to consider:
![]() Participants can place their answers anywhere on the whiteboard (but you’ll start to notice they tend to put them near similar ideas).
Participants can place their answers anywhere on the whiteboard (but you’ll start to notice they tend to put them near similar ideas).
![]() If a participant has an idea that’s identical to one already on the whiteboard, invite them to put it on the whiteboard immediately, next to the same idea, rather than discarding it.
If a participant has an idea that’s identical to one already on the whiteboard, invite them to put it on the whiteboard immediately, next to the same idea, rather than discarding it.
![]() As participants hear other suggestions, they will be prompted to come up with additional ideas. They can add to their list at any time (and put additional sticky notes up on the whiteboard when it is their turn again).
As participants hear other suggestions, they will be prompted to come up with additional ideas. They can add to their list at any time (and put additional sticky notes up on the whiteboard when it is their turn again).
5. Group and name similar items—Have participants move around the sticky notes, placing them near others. They can move anybody’s sticky note, not just their own. Ask them to explain their rationale for moving each note, using phrases such as the following:
![]() “This is the same as....”
“This is the same as....”
![]() “This achieves a similar goal to....”
“This achieves a similar goal to....”
![]() “I see a group of....”
“I see a group of....”
Ask participants to suggest names for each group and add these names to the whiteboard, drawing a circle around each group of related sticky notes. Welcome disagreement, and combine or create new groups as needed. This is a valuable step, because everyone gets to hear what each stakeholder values and thinks.
6. Vote for groups—Have each participant vote for those groups of ideas (not individual ideas) that they believe are most important in addressing the focus question. You might give them a limit of around three to five votes, which they can cast in any way. A stakeholder may place all their votes in one area, excluding all others, showing that they feel the issue is critical in addressing the focus question. At other times, two stakeholders may disagree. At this stage of the process, critique is encouraged. Invite healthy, constructive conflict—have them debate the issues.
7. Rank the groups—Rank the groups by the number of votes. Participants can combine similar groups—provided groups remain granular enough to be useful to your later prioritization—adding their votes. If groups are excessively combined, stakeholders are likely trying to keep too much on the table and you will not be able to exclude enough ideas from scope. Keep going until several top-priority groups have emerged and lower priorities are clear or have been discarded.
8. Communicate outcomes—After the session, thank participants and send out a summary of the results. Develop a priority list that aligns as much as possible with the key groups that were identified. Some ideas may be flagged for “further discovery” (those that need customer validation and prototyping first); others may be flagged as impractical due to constraints such as resources and feasibility. Emphasize the groups that emerged, as this shows that you have integrated participant feedback.
Buy a Feature
Luke Hohmann (author of Innovation Games6) codified the buy-a-feature method that converts feature prioritization into “currency.” It is played like a game, either individually or in small groups (of four to six). Players can spend on desired features and explain their reasoning. The game also helps emphasize that you can have only a limited number of priorities. This is useful if you are under pressure to commit to more than your team can reasonably work on. Follow these steps to use the buy-a-feature method:
1. Create feature cards—Name and describe the benefits of each feature on a separate card.
2. Price features—On each card, write a rough cost based on the feature’s complexity, risk, and effort. A feature that is twice as complicated as another feature should be double the cost.
3. Assign a total budget for each player to spend—Use monopoly money or make your own.
Each player’s total budget should not allow an individual player to buy more than a third of the features (as you want them to make difficult decisions). Furthermore, one player should not be able to buy any one large feature. Players can spend all of their individual money on a couple of small items or pool their resources to purchase a larger feature.
4. Describe the game—Explain to players that they will use their budget to buy features important to them. Lay out the feature cards on a table and briefly review each, drawing attention to the cost.
5. Take turns buying features—As players buy features, take their money and ask them to explain why they’re buying it. (Alternatively, have everyone place their money at once, and then discuss the overall results.)
Let players self-manage, with a moderator writing down comments, rationale, and arguments that each player made about why their items are most important to them.
Some features might be so costly that they will only be funded if several players negotiate with one another. Encourage such collaboration: stakeholders might reach a compromise that satisfies your needs without your needing to mediate.
One option to the game is to tie each feature’s price to a rough estimate of the required development effort. The combined player budget becomes your total available development resources. While this option is not necessary to make the game work, it is useful if you are getting resistance to using false currency (as it may be considered too abstract).
You will find an excellent set of templates for this game online at UX for the Masses (http://www.uxforthemasses.com/). You may also want to research a similar method called the hundred-dollar test.
The Kano Method (Quantitative-External)
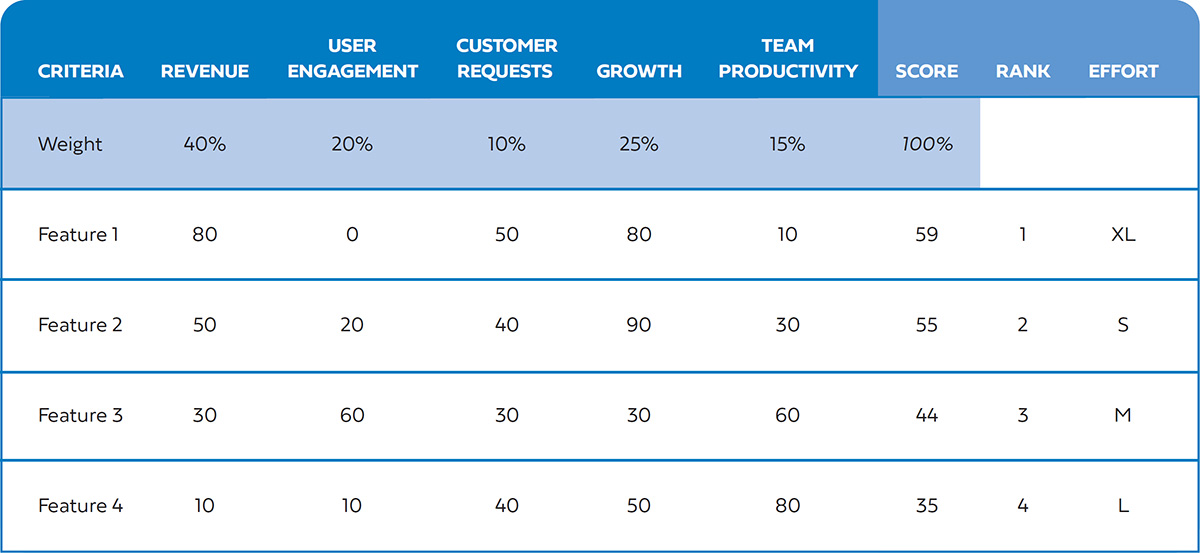
Developed in 1984 by Professor Noriaki Kano, the Kano Method7 surveys and understands customer needs, and then ranks features by how much they will increase satisfaction. As illustrated in Figure 4.3, features are naturally grouped into five categories, according to levels of potential satisfaction and their current functionality:
FIGURE 4.3 The Kano Method groupings
1. Performance needs (P)—These are the requirements customers more easily articulate; they are top-of-mind. They are what customers naturally always want more of and what competitors work to get ahead of your product on. Customers will use these needs to compare competitor options. The more you invest in making these features better, the more customer satisfaction increases linearly. Kano originally called these “one-dimensionals.”
2. Delighters (D)—These are innovations that significantly improve customer satisfaction in a pleasantly unexpected way. It’s rare that customers specifically request these features; instead, the features are derived by observing unsolved customer problems. Even a small investment in delighters can increase customer satisfaction exponentially. They are what sets a product apart, although their absence won’t reduce customer satisfaction. Kano originally called these “attractives.”
3. Basic needs (B)—These are requirements that customers expect and take for granted. Even when the features are done well, customers remain neutral about them, but when they’re done poorly, customers become very dissatisfied. Overlooking sufficient investment in basic needs can destroy customer satisfaction. However, all that’s required is adequate investment, as you’ll never create satisfaction; you can only disappoint.
Your product has to work, at least, at a minimum-quality level. Basic needs features are the price of entry—the greater the quality of competitors’ alternatives, the higher the bar should go for basic needs. Kano originally called these features “must-bes.” They are also known as “threshold features” (baseline features that have a binary effect on satisfaction—that is, if the features are not there, customers are not satisfied).
4. Indifferent features (I)—These are attributes that will neither improve nor decrease satisfaction. While customers may be indifferent to the investment, these requirements (such as automating business processes or improving back-end technologies) may still interest the company. A flaw in the Kano model is that it exclusively drives prioritization from the viewpoint of customer satisfaction. In practice, you must complement it with other prioritization techniques to capture initiatives that provide value to your business but not directly to customers.
5. Reverse features (R)—For completeness, Kano included a fifth category. Theoretically, a feature can have a high level of investment or achievement but result in customer dissatisfaction. Removal or reduction increases satisfaction. Typical examples include secondary features that interfere with the product’s primary features (perhaps adding confusion and friction).
Over time, delighters will shift into the performance category, and performance needs will become basic needs. When you (or a competitor) wow the customer with an innovative feature, you set new expectations. The market gets used to a certain level of functionality and expects other alternatives to follow suit. Your innovation becomes commoditized.
There is plenty of literature on how to conduct a Kano analysis. Advanced Kano analysis requires you to carefully develop questions, survey customer segments separately, and take into account the variation in answers from customers. (For example, it can be challenging to reconcile why some customers rank a feature as a basic need and others as a performance need.)
The Kano Method does an excellent job in predicting what customers will value in your product and is especially useful when balancing your requirements portfolio between adding new features and improving existing functionality. However, note the following:
• It can be very time-consuming.
• It is based on emotionally biased responses, which are not always reliable because customers don’t always know what they need.
• It can’t tell you why a feature is considered “bad” or what you should change to make it better—it can only show you the areas to focus on.
At http://www.influentialpm.com, I provide a simplified “quick and dirty” Kano analysis approach and an example.
Customer-Assisted Methods (Qualitative-External)
Customer-assisted methods structure the gathering of priorities directly from customers. Unlike the Kano Method, these methods tend to be quicker in gauging customer preferences and their underlying rationale, but they are less accurate. They are excellent techniques to complement internal and quantitative analyses as they can be repeated frequently and used for prioritization decisions, right down to the feature level. They are frequently used in user experience research.
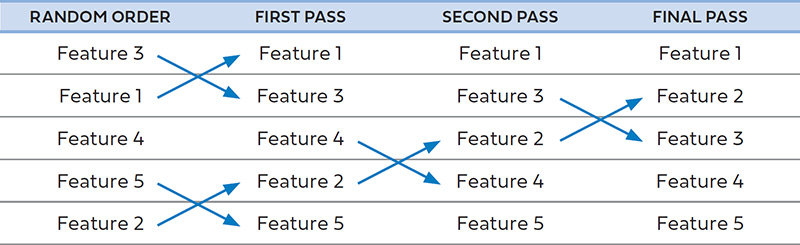
Bubble Sort
Provided your list of possible feature priorities is not extensive, list them in random order and have customers compare adjacent ideas in pairs, row by row. For each pair, they should decide which is more important. If the second option in the pair is more appealing, the order is swapped. Repeat the process until the user believes all priorities are correctly ranked.
In each step, only ever rank adjacent options—not those above or below the two under consideration. This reduces each prioritization decision to a binary “yes” or “no.” As illustrated by the example in Figure 4.4, after many small decisions you will arrive at an overall priority across all options. The disadvantage is that the rationale behind each decision might not be apparent, so have the participant verbalize these as they go.
Innovation Games
These methodologies, from Luke Hohmann (author of Innovation Games), create a gamified environment to engage customers (but can also be used with stakeholders). The two games I have found most useful are prune-the-product-tree and speedboat (sometimes called sailboat). There are many resources describing these techniques and dozens of variations.
Speedboat is a particularly interesting approach since it focuses on what users don’t like, rather than what users want, in a product. This game is useful if you are facing unsatisfied customers who are highly critical of your product’s limitations. Their demands might even overwhelm you; asking them to provide feedback on priorities just creates a tirade of frustration, full of emotion and despair. (We’ve all been there.)
Although customers may have many complaints about a product, they’re rarely out to destroy it or you. But asking for only what they want to change isn’t helpful. By gamifying negative feedback, you can get a good sense of which issues are of most importance—namely, those that have customers considering abandoning your product. Speedboat forces customers to prioritize the least-liked features or most significant limitations of a product in a constructive, controlled way.
Ask customers: “What anchors do we need to remove to make the speedboat (product) go faster?”
1. Draw a boat on a whiteboard or large piece of paper—Tell your customers that, as a speedboat, it should be going much faster. It is currently doing 30 miles per hour. It could be doing 80 or more. The speedboat is your product. What are the anchors?
2. Have customers write features or issues they’re not happy with on sticky notes—Make it clear that the issues have to be very specific. Ask them to expand on generic answers (for example, rather than just saying the product isn’t “intuitive,” ask them to specify why and where in the product they have run into a lack of usability). Post their completed notes below the boat and draw a line from each note to the boat as an “anchor.”
3. Identify the heaviest anchors—Ask customers to estimate how much faster you could be going by addressing each anchor (for example, 5mph, 10mph or 30mph). Place the heavier anchors, the ones slowing you down the most, lower down. Each anchor gives you a measure of customer “pain” for prioritization and improvement. Lighter anchors can be ignored; heavy anchors need attention.
4. Put it in writing—Record the outcomes, making sure to note the heaviest and the lightest anchors. By putting it in writing, you can avoid revisiting trivial issues and focus on the big issues. But you’d better do something about the issues you’ve noted if you are to maintain credibility.
An enhancement to the game is to add propellers (the positives in the product, also written on sticky notes). Figure 4.5 shows a simple template you can use, also downloadable online at http://www.influentialpm.com.
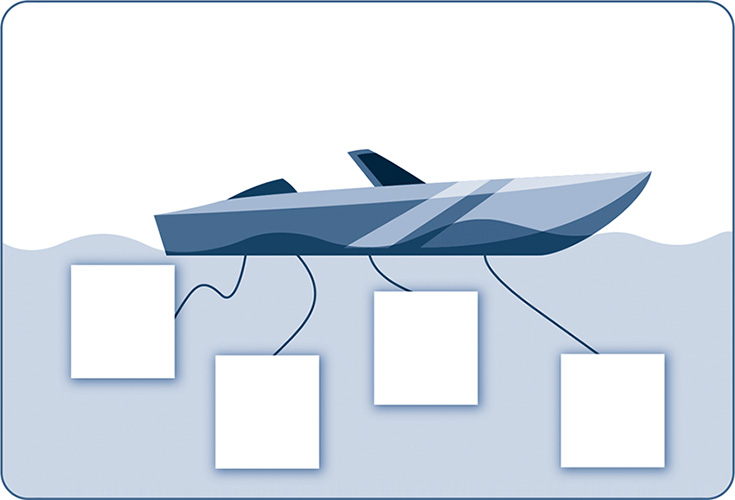
FIGURE 4.5 Speedboat game template
Five Whys
Customers and stakeholders often request specific features for reasons that are hard to determine. Use this technique to establish a root cause and its relative importance to other issues. Ask why—up to five times in succession:
• Why is this a problem? In what situations has this problem arisen?
• Why is this important to you (or whoever is requesting this)? What is the expected business outcome?
• Why is this an issue now? How have you worked around the problem before?
• What has shifted in your business priorities that makes addressing this goal important now, and why has that shift happened?
• Given we’re working on X, why is it important we stop that work and pursue this instead?
Asking the five whys is also an excellent team retrospective technique. When something goes wrong internally—say, a product feature, a project, your processes, or communication fails—use it to get to the root cause issue and identify areas for future team and organizational improvement.
Optimizing on Customer and Business Outcomes
Many companies overemphasize new feature development as a way to continually deliver customers value. These companies tend to have the following characteristics:
• They have a backlog of hundreds of ideas they intend to get to eventually.
• After a product release, they start working on secondary, nice-to-have features that got cut from scope.
• They rarely revisit a feature once it’s initially launched—tending instead to start working on the next project immediately—regardless of whether the launched feature is succeeding or not.
Yes, you should ensure delivery against the long-term vision of the product by adding new features or major enhancements to existing features. However, you must simultaneously ensure existing features are performing optimally. Striking the right balance between these competing demands (adding new features or optimizing existing features) can be challenging. If you fill up your schedule with new feature development, you will potentially miss generating impressive business results for relatively little effort by optimizing existing features. On an ongoing basis, endeavor to budget some portion of your team’s time for optimization and quick-wins.
The prioritization techniques we’ve discussed so far in this chapter provide excellent ways to choose among substantially sized projects (those likely to take several development cycles and those demanding disciplined assessment and up-front validation). But they are less effective at surfacing the many micro-projects that may incrementally improve features already available to users.
A prioritization methodology should not be used alone to identify and rank such initiatives. Instead, use an experimental methodology to brainstorm ideas, quickly implement a lightweight solution, and test on a small scale against clearly defined metrics. If the outcomes are positive, you can roll out your improvement to your whole user base.
The Little Things Matter
Over the years, I have observed some outsized gains in improving outcomes from simple ideas and concepts. Here are notable examples:
• Investing in SEO, such as writing better copy on 10,000 “long-tail” pages of the website, resulted in a 30 percent increase in overall qualified traffic coming from search queries. Even though any one page didn’t have the volume to be of interest, in aggregate, they generated a significant lift.
• Reducing the file size of assets (images and videos) and using a third-party service to deliver scaled-down levels of fidelity appropriate for the user’s device and internet speed sped the site up and drove a 20 percent increase in the conversion rate (from free to paid user).
• The discovery rate of a new feature was low (less than 5 percent of users interacted with it). Rather than remove it, we brainstormed ways to make it more prominent in navigation—resulting in significant uptake and higher overall customer satisfaction.
• Sending an email with a discount to users who had an item in their cart but hadn’t checked out (cart abandonment) resulted in a 10 percent increase in purchase completion.
• Of five possible calls-to-action (CTA) on a key page of the website, heatmap analysis revealed only one mattered. This was a link to “learn more.” We realized we were trying to get users to purchase before they were ready. Counterintuitively, adding more information on the page and placing the purchase CTA later improved outcomes.
• A growth team ran 51 small tests in 90 days across an (admittedly highly unoptimized) online learning subscription-based website and drove the conversion rate up by 43 percent. Most tests failed, but the collective wins added up mightily.
Incremental optimizations tend to exhibit one or more of the following traits:
• They can be implemented relatively quickly.
• On their own, they are each too small in effort to justify the overhead of extensive up-front research, prioritization, and debate.
• They are among many potential ideas to test, and it is unclear which will be winners.
• As a group, they require resourcing over time to gradually improve an existing product’s performance (that is, they are not a “project” but a series of iterations).
• On their own, they may not make a large difference, but as a group, they can add up to a lot.
The most popular technique for finding which incremental changes work is A¡B or split testing. It is well understood in concept but often misapplied. You can only use it once you have a baseline experience from which to iterate and test against and an active user base using your service to gather statistically significant data from.
To run A|B testing effectively, use the guidelines that follow.
1. Determine Your Desired and Measurable Outcomes
Don’t try random ideas. Narrowly focus and align your team by declaring precisely what overall business or customer outcomes you are striving for. Here are some examples:
• A series of landing-page optimizations might each improve customer conversion by a small fraction of a percent; but collectively their impact may be hugely valuable.
• A page or feature in your product has a particularly alarming abandonment rate, and you want to see if you can reduce it.
• You have a hypothesis that increased sales might offset a discount on the current price.
• A recently launched feature has lower engagement than expected. You wish to improve its discovery by finding the most effective places to promote it.
• You wish to find which email content and subject lines drive the highest open rates and click-through rates back into your service.
Set a KPI/metric by which you will determine overall success. You will likely also have several secondary metrics, which are easier or quicker to measure and are leading indicators of movement toward your overall goal. Measure the existing experience to create a baseline. Ideally, you will hold back a group of users who don’t receive any enhancements to compare against and determine a definitive overall result.
![]() In Chapter 6 I introduce a specification template. Use it to thoroughly document an experiment note for each split test to capture your hypothesis and the precise metric (and existing baseline) you aim to move.
In Chapter 6 I introduce a specification template. Use it to thoroughly document an experiment note for each split test to capture your hypothesis and the precise metric (and existing baseline) you aim to move.
Also identify counter-metrics, which you don’t want to see negatively affected. For example, if your overall goal is to increase your effectiveness to drive visitors to become paying customers, your primary metric is likely conversion rate. Counter-metrics (that you don’t want to see get worse) might include average order value (AOV), customer satisfaction, and refunds.
2. Gather and Prioritize Ideas
With the goal in mind, develop ideas for testing and convert them into an ordered backlog. Here are two of the most effective techniques for doing this:
1. Identify companies that are good at achieving goals similar to yours (not just competitors). Research their products for ideas, taking careful note of small details and features that might be good tactics.
2. Using the KJ method, bring together a cross-functional group to brainstorm ideas that can be built within a short timeframe. Walk through your goals and share examples. As ideas are generated, anything that might be too much effort can be a candidate for your larger product roadmap; alternatively, encourage the team to break the idea down further.
Capture the hypothesis behind each idea—the “why” something might work, in addition to the “what” (such as a whiteboard, wireframe sketch). For example, a hypothesis might be, “If we invite users to submit their email addresses, they’ll be more likely to transact later as we can market the service’s value proposition to them through email.”
![]() Refer to earlier in this chapter and to Chapter 8 for tips on making high-level developer estimates.
Refer to earlier in this chapter and to Chapter 8 for tips on making high-level developer estimates.
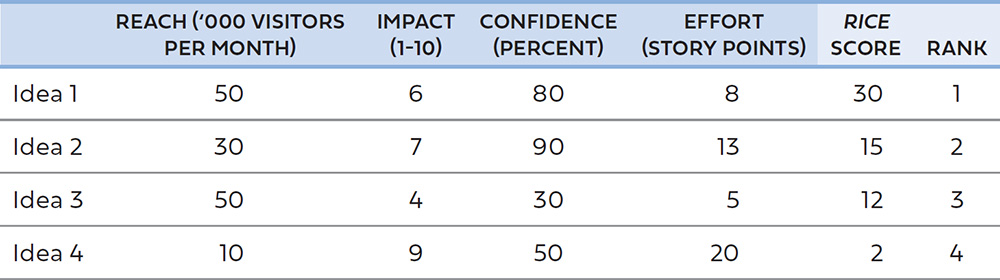
Roughly prioritize ideas according to what you and your team believe are likely to have the highest impact for the least effort. One tool, which is popular with growth teams and will help you decide which optimization tests are likely to have the greatest impact prioritize, is called RICE (Reach, Impact, Confidence, Effort/Ease).
To score an idea, you must first assign a percent, ratio, or number to each of the four attributes based on available data or, if data is unavailable, your best guess or team consensus.
• Reach—How many users you would affect with the improvement idea in a given period. If you are optimizing a website, use the pageviews or visitors per month. Clearly, low-traffic parts of your site should receive a lower reach score.
• Impact—An estimate of how much the idea will improve your goal when a user encounters it. A 0-to-10 scale is fine. If you don’t have definitive research or strong conviction (such as seeing the improvement idea already in use by other services), the collective opinion of the team will suffice.
• Confidence—Given the available data, intuition, and past experience, what is the percentage of confidence that the idea can be executed and will have the estimated impact. Agree not to be too conservative, so that ideas are not all rated low simply because you’re working with such little information. Most ideas should spread across the 30 to 80 percent range.
• Effort (or Ease)—Another scale of your choosing that corresponds roughly to developer effort. If you use T-shirt sizing, convert sizes into numerals, or use a rough estimate of developer weeks, or you can use story points to estimate a score.
Each percent, ratio, or number is a relative measure comparing each idea to your other ideas. Precision is not required, just consistency.
Once you have assigned a number for each attribute, an idea’s RICE score equals
![]()
As illustrated in Table 4.1, the higher the RICE score, the greater the idea’s overall contribution and, therefore, priority. For example, idea 1 is clearly a winner because it reaches a wide audience within your userbase, you are fairly confident it will work, and development effort is relatively low. Despite its high impact potential, idea 4’s RICE score is much, much lower because it reaches a fraction of your audience and effort is substantive.
TABLE 4.1 Example RICE prioritization matrix
Encourage the generation and implementation of tweaks (low-impact, high-confidence, low-effort) and of bigger swings (high-impact, low-confidence, medium- to high-effort). Tweaks add up over time, each moving the dial by a tiny fraction, but collectively they produce material business outcomes. Simple changes such as calls to action, the positioning of buttons, and value-proposition messaging can have a powerful impact on metrics.
However, while bigger swings might have scores for lower confidence and higher effort, if they happen to work their overall impact can be dramatic. Many teams get stuck iterating around a local “optimum”—when a radical change can break open new possibilities for outsized, unexpected results. For example, eliminating entire steps or features in your product might mean simplifying functionality resulting in increased goal completion of your primary use case; or sending one richly personalized email per week might work better than sending a dozen basic templated emails.
3. Execute Your Experiments
Only one idea should be run on each “surface area” at a time. A surface area is each unique flow or section of your product. For example, if you are testing to improve conversion, you can run a different test for every entry point of your product (up to the checkout page, the point of conversion).
Randomly assign users to at least two test cells—a control and a variant—to allow for all other factors and to eliminate the risk of correlation appearing as causation. Your control is usually your existing baseline experience; whereas your variant is identical in every aspect except for the single change you are testing.
Seemingly small considerations can reduce the effectiveness of your test. For example, if you direct all users from a particular geography or channel into the new experience (a supposedly easy way to run an A|B test), you have not controlled for the fact that those users may exhibit different behaviors than your broader user base. Likewise, if the user can opt in or out of either experience, then your results may be skewed as more enthusiastic users may select to try your new offering.
You can run A|B testing on a concurrent basis (where users are randomly assigned to receive one of the two experiences.) You can also run tests using a time basis (where all users are sent to a new experience for a short period, after which the test ends). However, you must not do anything to change the mix of users during a time-based test (such as launching a marketing program that brings in many less-qualified visitors.)
If you don’t have an A|B testing platform, invest in a third-party tool. To speed up your ability to test, you need to be able to swap out different user experiences easily and to track and reliably report on all the data necessary. If you are working on a multi-platform product, you will need to test mobile and desktop applications independently.
You must wait until you receive enough user interaction to declare the test either way with statistical significance. Depending on the reach and impact, tests can range from hours to weeks. Frequentist inference is more accurate but takes longer to reach high confidence. Bayesian inference is quicker and requires less time and volume but is directionally useful (for example, you may know your test resulted in a positive outcome even though you aren’t able to determine the exact increase on your KPIs). Your data science teams can help you decide which is right for you.
Rapid Testing of Call-to-Action Messaging
Viral growth was a critical part of our user-acquisition strategy for our mobile application. users were prompted to send a SMS invitation to friends and family with a short default message and a download link. The conversion rate for signing up new members from these messages was about 5 percent.
We tested hundreds of variants in message text. The results were not obvious: the best-performing message—“Send Free SMS I Use [URL]”—had more than double the rate (9.9 percent) of the lowest performer—“FREE SMS [URL] “—at 4.4 percent.
Can you see any difference? Perhaps the capital letters seemed unnatural and too spammy to recipients. Maybe the word “I” turned the first invitation into a more personal one. Whatever the reason, only testing could have uncovered it, along with the tremendous difference in business outcomes.
A multivariate test allows you to run more variants concurrently, such as an A|B|C test. As you add more test cells, the number of users in each cell is reduced, which may increase the time you must test to get statistically significant results.
A 50/50 split test will be the fastest to run. However, to manage risk, you can easily limit the number of users who will be subjected to the new experience—depending on the speed at which you need to learn. This means you won’t be putting your day-to-day business at risk if you adversely affect users. If an idea looks promising, you can gradually roll out the change to more users, to verify that the beneficial outcomes are sustained.
4. Use Cohort Analysis to Track Long-Term Impacts
While some metrics will be immediately measurable, others will require you to track users over a longer time. For example, while an increase in conversion might be immediately obvious, effects on customer retention take time to evaluate, as the changes are only measurable over time.
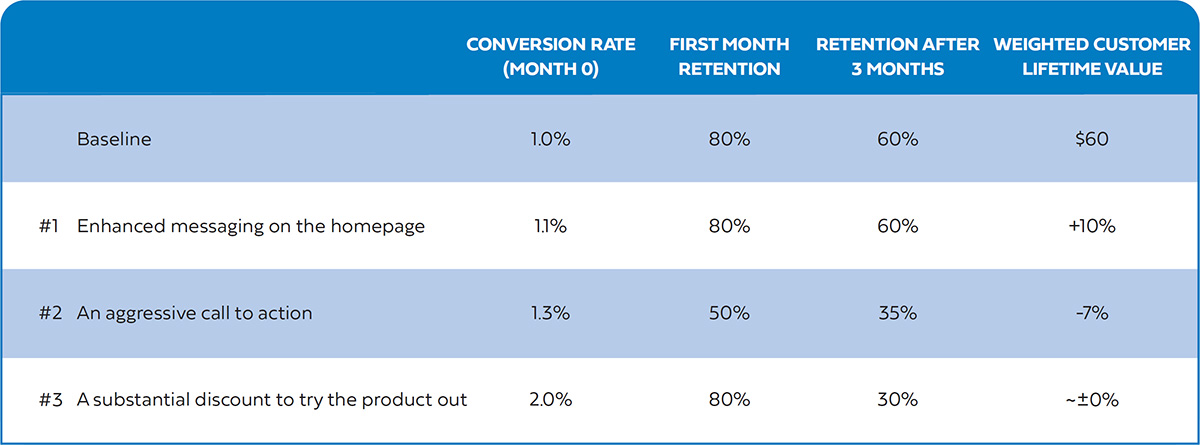
In Figure 4.6, Test #1 seemed immediately promising. But it was only later validated that the counter-metric (customer retention rate) was unaffected. It improved overall customer lifetime value (LTV) by 10 percent over the baseline.
Test #2 initially looked even more promising, but after a while, it became clear that the aggressive call to action possibly misled customers, which resulted in high churn in the first month. Test #3 was a surprise. After investigation, the discount proved a good way to get people to trial the product, but once pricing returned to previous levels, these users canceled (resulting in a net neutral effect overall).
5. Encourage a Culture of Experimentation
In baseball, the “batting average” is calculated by the number of hits a batter has divided by the number of “at-bats.” Even the top 100 batting averages are between 0.309 and 0.366.8 In A|B testing, just as in baseball, most of the time your tests will fail or make a seemingly marginal difference. If they are not failing, then you’re not testing big enough ideas!
You need to be willing to implement multiple ideas that might be discarded. Some users might be unhappy with receiving a new experience. If you become invested in a pet idea, you might keep trying to make it work long after it is clear it will not. Or maybe your team or management is intolerant of “mistakes.”
But tests fail. This must not be perceived as an error of judgment; otherwise, you will try out only the safest ideas. If you are faced with this problem, start small, making basic, noncontroversial changes to the experience and sharing positive results to gain momentum and to encourage a culture of experimentation—then gradually try out bigger and bolder ideas.
Fear of Failure: Radical Tests vs. Tweaks
A product manager was assigned a team and the goal of optimizing conversion rates for our subscription education product.
Over the course of three months, she toiled away, running A|B tests on the homepage to drive up performance. The team tested different messaging, layouts, and even gave away some free content—but, unfortunately, each test generated only marginal results. Conversion rose from 1.00 percent to 1.05 percent—barely enough to justify the investment we were making in her engineering team.
The team had been trying only “safe” ideas—minimal tweaks and design changes. They worried that we would blame them if any idea had a strongly negative result, even though only a small percentage of users were ever exposed to an idea before it was proven effective. They felt we expected every idea to work.
I reset the expectations with the team and encouraged them to embrace potential failure. Either an idea should work spectacularly or fail miserably—either was fine so long as we learned from it.
After that point, they tried radically different ideas, including a longer service trial, highly personalized pages, sending more email in the first few days to educate users about the service, and changed pricing options. The results were much more promising.