The Logic Model
The more complex the initiative, the more useful it is for the IAP to employ visual elements in order to depict how all the parts will unfold. It is difficult to keep track of many simultaneously occurring elements when they are presented in a purely descriptive format, but if they are all charted out graphically, the reader can understand—literally at a glance—many complex concepts and their interactions. Timelines, as mentioned, are one means of illustration. They offer the great virtue of depicting chronology, so that the reader can understand change over time. However, the timeline alone is rarely sufficient. It is one-dimensional, which forces everything to fit onto a single line; it is also linear, whereas certain components of an initiative, such as evaluation and strategic communications, tend to cut across different parts of the initiative. It is therefore usually handy to borrow a tool from the evaluation literature—the logic model—to illustrate the IAP.
The logic model can be constructed in a number of ways, but in its most basic form, it is a variation on the classic flow chart so beloved of manufacturing engineers. A simple logic model can be conceptualized as having five columns:
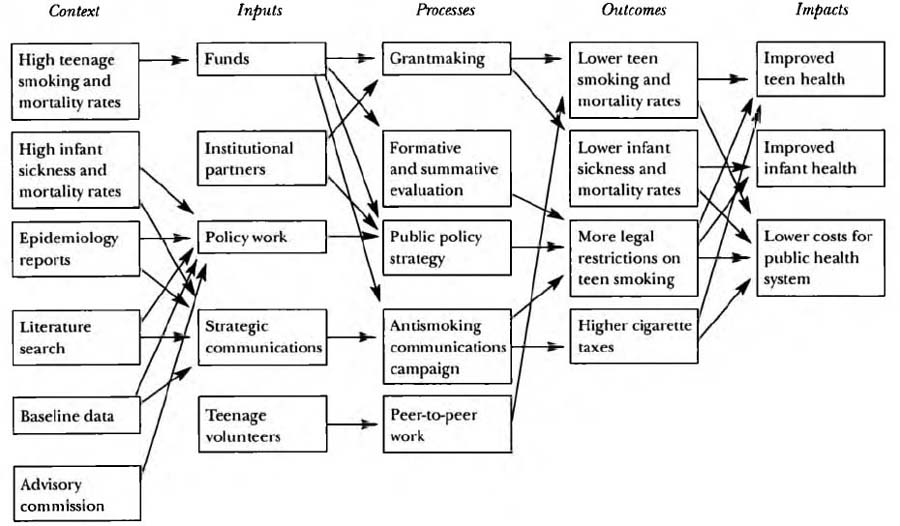
Column one is headed Context. Under this rubric fall all the factors influencing the initiative. These would include the problems that the initiative is trying to solve (or the opportunities it is attempting to seize) and everything that will be done during the initiative to understand them: needs assessment, literature search, stakeholder studies, advisory panels, and baseline studies.
The second column is headed Inputs. Under this rubric are listed all the resources that the initiative brings to the table, such as funds, local leadership, volunteerism, institutional partnerships, TA, strategic communications, and policy activities.
Column three is headed Processes. Under this rubric are listed all the major activities that will be undertaken during the life span of the initiative, including grants, formative and summative evaluation, a strategic communications program, plans to bring the project to scale, and policy work. This column will usually include more sheer activity than any of the others.
Column four is headed Outcomes. Under this rubric are listed the most important achievements that the initiative is expected to produce. The outcomes will be a direct result of the inputs and processes. For example, an institutional partner (input) and a grant for $100,000 to combat teen smoking (process) should lead to fewer teens smoking cigarettes (outcome).
The fifth column is headed Impacts. Under this rubric fall all the changes in society caused by the outcomes of the initiative. If fewer teens smoking cigarettes is the outcome, then the impact would be improved health among teenagers, fewer health problems among babies born to teen mothers, and so on. The impacts are changes in the problems the initiative is addressing, and they thus loop back to the Context column. Put another way, the impacts are the societal changes that the initiative is expected to achieve.
A simplified logic model using an initiative to reduce teen smoking as an example is illustrated in Figure 14.1. You can find more sophisticated models in the evaluation literature cited in the Bibliography of this book.
The logic model allows for both a linear understanding of how an initiative will unfold and more complex interpretations. Although some elements relate to each other in a neat, linear fashion across the columns (funds ![]() grantmaking
grantmaking ![]() lower teen smoking and mortality rates
lower teen smoking and mortality rates ![]() improved teen health), other elements connect in more complex ways to multiple items in different columns or rows. (For example, the antismoking strategic communications campaign listed in the Processes column, by communicating directly with teens, leads to lower teen and infant sickness and mortality rates, listed under Outcomes; that campaign also communicates directly with policymakers, thus leading to more legal restrictions on teen smoking.) Ultimately, the logic model illustrates how all the pieces come together to form the mosaic of an initiative and, more important, allows one to understand the interrelationships of its many different pieces to each other.
improved teen health), other elements connect in more complex ways to multiple items in different columns or rows. (For example, the antismoking strategic communications campaign listed in the Processes column, by communicating directly with teens, leads to lower teen and infant sickness and mortality rates, listed under Outcomes; that campaign also communicates directly with policymakers, thus leading to more legal restrictions on teen smoking.) Ultimately, the logic model illustrates how all the pieces come together to form the mosaic of an initiative and, more important, allows one to understand the interrelationships of its many different pieces to each other.