
Chapter 5. Telemetry and Analytics
To really understand our users, we need to see how they use our applications in actual practice—what they actually do, not what they can remember doing, or are willing to admit to doing. Lab testing and interviews provide us only a limited glimpse.
Today’s apps, connected over the Internet, can report our users’ actual behavior, in all parts of our programs and over very large sample groups. We can then examine usage patterns and behaviors to meet our users’ needs. This chapter explains how we can do that.
The Guessing Game Era
I remember frustrating design meetings in the late eighties and early nineties, when we were trying to figure out how users actually did use our program. The discussions would almost always go thusly:
First engineer: Users always do [this].
Second engineer: No way. I know users, and they never do [this]. They always do [that]. You’re an idiot.
First engineer: I’m not an idiot. You’re the idiot, you idiot. Users don’t do [that], they do [this]. And you’re ugly.
When I sat down with either engineer (separately, of course) and forced him to walk me through the reasons why he thought that users did this or that, it invariably boiled down to “because that’s what I do.” As we’ve seen throughout this book, your user is not you, and our users weren’t either one of those guys either. Through interviews or discreet observation, we would eventually discover that the users did neither this nor that but something completely different, something we’d never expected or planned for and initially couldn’t believe.
As we saw in the preceding chapter, observing live users interacting with our programs is immensely valuable. We can talk to the test users. We can ask them why they did this instead of that or the other way around, or if they noticed this thing over here, or what they thought would happen if they did such-and-such. Asking them, “What are you thinking now?” when they appear to be stuck often sheds light on confusing designs.
But this approach has limits. You can test only one or two features at a session, a tiny proportion of most apps. You have a small sample group, which means that one or two atypical users can skew the data. Even with the best of moderators, users are sometimes too polite, or reluctant to appear dumb, or can’t remember enough to give you good responses. Researchers often poison the process by asking leading questions. And you are observing only a very short user interaction—first impressions are useful, but they don’t measure long-term behavior. You can’t test how user interactions evolve over time. Live testing can’t answer some vital questions, such as which features users actually use most frequently. And whether your app’s more advanced features, such as keyboard shortcuts, are ever getting used at all.
Consider the example from earlier in this book. Microsoft Word requires users to manually save changes to their documents. Microsoft OneNote saves them automatically, unless the user explicitly discards them. Which is better for users?
It depends on how often the users save their changes versus how often they discard them. If users save their changes 99% of the time, then automatic saving would eliminate 95 clicks out of every 100 in the saving process, a huge reduction of overall user effort. On the other hand, if users save their changes only 50% of the time, then automatic saving would actually increase the overall user effort by a lot; every 100 clicks in the saving process would now mushroom to 250.
How do you know what percentage of users save their changes? Not by some mystical telepathic intuition, known only to crystal gazers who burn incense and eat sprouts and wear berets. Even asking a few users in the lab won’t tell you. But collecting hard engineering data, over many more users than you could afford to test in the lab, will give you the answers that you need to make the correct decision.
Telemetry as a Solution
To fill in these blank spaces in our knowledge, we need automated, unattended monitoring of users’ actions. We need to track all of the users’ actions, not just the few we can cram into a one-hour lab session. We need to do it in such a way that our observation process doesn’t alter their behavior. We need to collect this data over time, to see how it changes. We need large numbers of users, so we can make statistically valid inferences. And, of course, we need it at the lowest possible cost.
Almost all computers today are connected to the Internet at least sporadically. We can therefore meet these needs by adding code to our programs that records what users do and reports this data to a central server. We can then understand user behavior by examining this data store. We can then make design decisions based on actual user behavior, rather than WAGs (wild-ass guesses).
This process goes by the name of telemetry and analytics. In this context, I define telemetry as “the automated collection of data describing user actions in an application.” I define analytics as “the study of telemetry data to understand and improve the user experience.” In practice, the term is often shortened simply to the catchall term telemetry. Figure 5.1 shows the process.
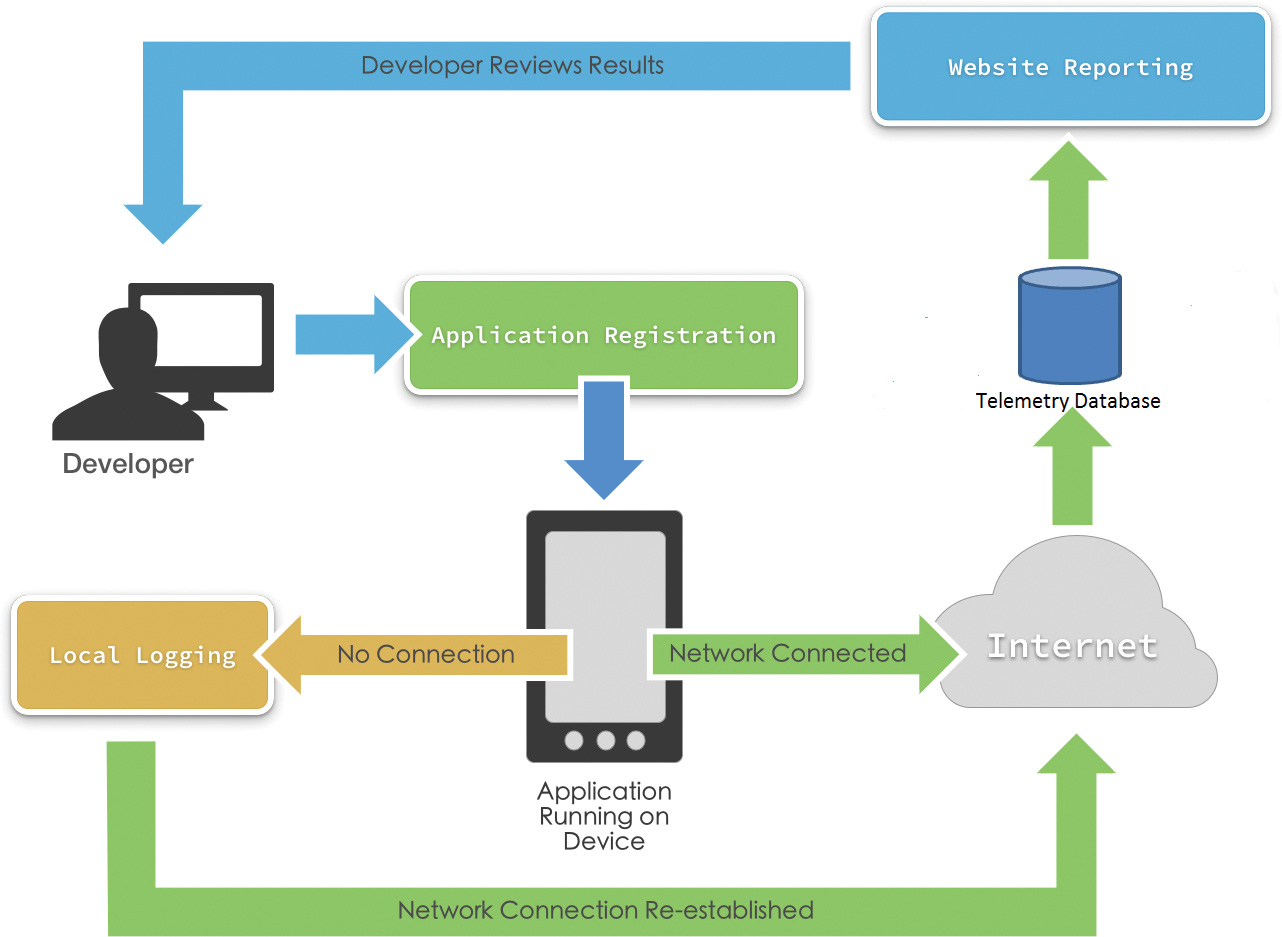
The developer registers her app with the telemetry provider. The app then runs in its native environment, here shown on a mobile device. When the app is connected to the Internet, it sends data describing its actions to the telemetry database run by the provider. If the app is not connected, it logs its information locally until the connection is reestablished. The developer later views the results of the telemetry through the telemetry provider’s Web site and makes development decisions based on this data.
Good telemetry data can help you focus your next development cycle. For example, in a mobile device app, how often do your users hold the device in landscape orientation versus portrait orientation? I once saw a conference speaker offer his attendees a game to download and run on their phones while he spoke. At the end of the talk, he showed telemetry data that revealed that 87% of the attendees had held their devices in portrait orientation while running it. That would suggest that further development of landscape mode would probably not be the best use of their limited development dollars.
For another example of the importance of telemetry, consider the A-B test. Suppose you have two versions of an ad. How do you know which is more effective? For, say, a week, you randomly show incoming users either version A or version B and measure which one gets more clicks. A client of mine makes a product related to online safety and gets a lot of customers through Internet ads. He tried two versions. One showed a user relaxing in a hammock and drinking lemonade because the product had done all his work for him. The other showed bad guys trying to do bad things to a user. The product fought them off, but another user, who hadn’t bought the product, fell victim. The client and I both favored the former. We both said, “Aw, baloney [we were a little more graphic], who’s going to click on a cheesy thing like that other one? I wish I was lying in that hammock now.” But the customers clicked on the scary one, by a factor of three or more. We couldn’t argue with that data. Our users weren’t us.
Good telemetry data can settle arguments with bosses and customers, whereas the lack of it leaves you back in the bad old days. I have a client today whose product displays data in a set of tabs. These tabs are movable, as are the tabs on most Web browsers. This feature probably exists because one specific power user demanded it, but the other users find it more of a bug than a feature—they accidentally displace a tab, don’t realize what they did to cause it, and Undo doesn’t work to put it back. It seems to be a rather large net negative in the program. If that app had telemetry, I could measure how often tabs get moved into particular configurations, versus how often they’re restored to their original locations after being displaced. But I came in late to this project, and it doesn’t have telemetry. I can’t prove it one way or the other. It’s frustrating as heck.
Telemetry is especially important when you are iterating quickly. You make some changes, roll them out, and you can see within a day or two what users are doing, or not doing, with them. You can then adjust and respond for your next release in a week or two. Eric Ries champions this approach in his book The Lean Startup (Crown, 2011). With today’s ever-shorter release cycles, telemetry is more important than ever.
Evolution of Telemetry
It may seem new, but telemetry has actually been around for years. We first saw it on the earliest Web pages. You probably remember the hit counters that said, “You are visitor number [whatever].” The site owner would see when traffic had gone up or down and could adjust content accordingly. This then evolved to Web server logs showing where Web site users were coming from, the days and times at which they were hitting your site, and so on.
It was easy to do this. Google Analytics, for example, can track the usage of your Web site by means of small scripts that you include on each page. Listing 5.1 shows an excerpt from one such script.
Listing 5.1 Enabling Google Analytics Tracking
<script type="text/javascript">
var pageTracker = _gat._getTracker("UA-1134649-2");
pageTracker._trackPageview();
</script>
When a customer hits the page, the script sends information to Google, which stores it in its massive databases. You can then view various parameters in a browser—the number of hits, the places they came from, the browsers used, and so on (Figure 5.2). It is almost infinitely configurable, to the extent (Google claims) of figuring out the age and gender profile of your visitors.

Reading these entrails was and remains a highly speculative operation. But it’s easy and cheap to collect and view this data, so you might as well do it. For example, one of my students once noticed that her company’s Web site was receiving a lot of hits from Japan, even though it was written in English. The question, of course, was whether these hits represented actual human users and thus potential customers, or it was just spam spiders working through a Japanese portal. She tried adding a short blurb in Japanese, which attracted many more viewers, and therefore she decided to expand the site’s support for Japanese.
That was for Web sites, in which users are by definition always connected to the Internet. Desktop apps are a different story. Around 2007, Microsoft applications started showing the dialog box shown in Figure 5.3. This was Microsoft’s first attempt at telemetry for desktop applications. The developers had written an internal framework that recorded and forwarded information on user activities. They figured that enough of their customers were connected to the Internet enough of the time that they could get good information about their experiences.

Microsoft was smart enough to give its telemetry program a friendly name, “Customer Experience Improvement Program (CEIP),” as opposed to such earlier missteps as “Hailstorm” and “Carnivore.” The company promised anonymity. It politely asked permission and left the check box empty so that users had to opt in to be tracked. This was the first time any company was observing desktop apps on any kind of scale, and Microsoft could have gotten hammered for it. But the company made nice and was rewarded. Now all of its programs, including Windows itself, make extensive use of telemetry.
Today we have mobile devices and their apps. They’re connected to the Web almost all the time. Their very utility stems from their connected mobility. They report data to their home bases at times and places that we don’t really think about. Consider the traffic features of the Google Maps traffic app (Figure 5.4).

Google’s map shows you where you are and what traffic is around you. How does it know the traffic level, magic image recognition from a fleet of drones? Nothing so fancy. Your phone is constantly reporting its location to Google so that Google can show your position on the map. Google knows where you are now, and it knows where you were a minute ago, so it knows how fast you’re traveling. It knows which road you’re on, and hence what the speed limit is, so it can figure out whether you’re cruising along in the green, slogging in yellow, or cursing in red.
This reporting of data is baked into the application. Here the line starts to blur between an app’s primary function and its UX telemetry. That’s how today’s apps work. We’ll discuss this in more detail as we proceed with our exploration.
Permission and Privacy
Your telemetry app is going to be monitoring and reporting on a user’s actions. Telemetry is now common enough that few users think about it. But the ones who do can get very upset if they think you are doing them wrong. You want to at least consider getting users’ permission to collect their data and allowing them to opt out. How should we think about this?
First, permission may not apply if you are writing enterprise applications, that is, for use by employees in a business. US courts have long held that the computer belongs to the employer, which can look at anything it wants to. Some nasty employers go so far as to use keystroke trackers to find employees who are goofing off instead of madly typing away. It can be trickier in the EU, and other regulations may apply. But in general, the more control the employer has over the computer, the less permission is needed for monitoring users. Check the law so you know at least the minimum standard you have to meet.
If you are not in an enterprise situation, it is a very good idea to provide users with the capability of turning off your telemetry. Few users are paying enough attention to notice, and fewer still would care if they did. But the ones who do care can get upset and make a fuss, which you certainly don’t need. Allowing users an easy way to turn it off means that anyone who gets seriously offended by it can have what he wants and will then (you hope) go away and find someone else to annoy.
Most apps provide this option deep in their settings page, as it doesn’t (OK, shouldn’t) affect the actual operation of the program. Firefox, for example, provides access to it on its Options → Advanced tab, as shown in Figure 5.5.

Once we’ve made our telemetry configurable, we have to figure out what its default state should be. There aren’t all that many choices; there’s on, there’s off, and there’s ask-the-user, with no apparent consensus in the marketplace. Firefox turns it off by default for regular user versions. Google Chrome calls it “Usage Statistics” and turns it on by default. Microsoft programs generally ask permission at installation time, sometimes with the enabling box checked by default and sometimes not.
With mobile apps, the situation is murkier. When you install a mobile app, it provides a screen telling you the features of your device that it needs to access and asking your permission to do so. Figure 5.6 shows the permission request screen for Skype on a Nexus 5 phone. You can see that it wants to use the device’s camera and location, among other things.
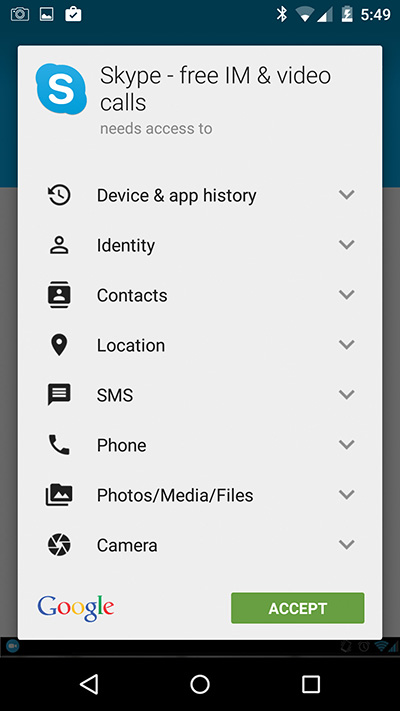
Figure 5.6 Privilege request screen for Skype on Android. There’s no mention of telemetry permission.
What you do not see is any permission request for telemetry. How will Skype’s developers know if you’re holding the phone in landscape or portrait orientation? Or how many times you had to dial the number before you got it right? And so on. Skype for Windows PC contains an advanced dialog box setting, “Help improve Skype . . . by automatically sending us periodic reports . . . ,” which is unchecked by default. The mobile version does not have this check box.
In the fine print of Skype’s privacy policy, you can see the words “We collect this information in a variety of ways, including . . . the Skype software on your computer or other device.” That appears to be the permission for telemetry, which you automatically accept when you use the program.
It goes back to what I said in my book Why Software Sucks (Addison-Wesley, 2007), that privacy policies are useless. They all boil down to this: “We do what the heck we want. And if you don’t like it, tough. Don’t use our app then.” It would seem that most users are comfortable with that.
Selecting a Telemetry Provider
Recording, uploading, storing, and displaying your telemetry information is a nontrivial undertaking. Fortunately a number of companies provide frameworks that accomplish all this with very little effort on your part. You should choose one of these commercial providers rather than rolling your own framework. They vary by cost, and by the degree of handholding that you get. Almost all of them have a free level to get you started.
A book of this type can’t provide a comprehensive guide to the telemetry marketplace. As with everything else in the software business, it changes too fast. But here are some programs that are worth looking into: PreEmptive Solutions provides a free version of its telemetry package with Visual Studio, alongside its more widely known product Dotfuscator. It’s free and convenient and easy to integrate with development tools. In the example application discussed later in this chapter, we use Xamarin Insights, for the same reason. Microsoft is rolling out its new Application Insights on the Azure platform, which looks good. Google Analytics certainly has big company backing. A friend of mine swears by Localytics. Poke around; they’re not hard to find.
You also want to coordinate with your software quality assurance department. They are probably using some sort of telemetry package to monitor your app for crashes and hangs (or at least they should be). Telemetry has been used for that purpose for longer than our usage of monitoring UX. I remember Steve Ballmer crowing about its success at TechEd in 2004, years before Microsoft brought out any UX telemetry. You might as well start by looking at whatever framework your QA people currently use to see if it can handle your UX telemetry needs as well. The newer ones tend to do this well; the older ones tend not to.
Selecting a telemetry provider is especially tricky when your programs run on an internal network that isn’t connected to the Internet. Some of my financial clients are in this situation, and a few medical clients as well. Just as a basic hygienic precaution, not a byte gets into or out of their network, no way, nohow; period, stop, end of conversation. How can you do telemetry in this case?
The answer is that some telemetry providers will lease or sell you their server software, which you then run on your private network. It costs more, and you have the headache of administration. But it’s far better than no telemetry at all when you are in this high-security situation.
What to Track
As with any other type of investigation, the success or failure of your telemetry project will depend on asking the right questions. What sorts of questions should you be asking with your telemetry? You need to think clearly about the insights you want to gain from it.
For starters, stay away from low-level stuff. UX telemetry isn’t about tracking the internal flow of your software. It’s not for tracking that function A called B called C called D, returning 1, returning 2, returning 3, returning zero. That’s for your debugging tools. You certainly shouldn’t be doing that on a customer system.
You should be thinking more in terms of highest-level functionality, such as “The user opened a document, then opened a second one, spell-checked the first, printed the second, then closed them both.” The buzzwords key performance indicators are thrown around a lot. Obviously these will vary from one type of program to another, but here are some general thoughts.
Tracking feature usage is often a major goal of telemetry. When Microsoft Office, the largest application in common usage, first got telemetry, one of the main things Microsoft wanted to know was how often each of Office’s hundreds of features actually got used. A source on the Office team told me they were astonished by how few of its features were widely used. Every Office developer thought that the feature she worked on was the one that users couldn’t live without. She dedicated her life to it, all day, every day; of course the world would stop turning without it, no? But no, only 1% of users ever opened the equation editor, or the table of authorities, and so on. Who knew?
You might want to track sequences of operations. Consider the Insert key on the Windows keyboard. In Word, when you hit that key, you got switched into overtype mode. I have never seen, or even heard of, anyone doing that because she wanted to. I’ve only ever seen it as an infuriating accident, but I didn’t have data to prove that most users shared my view. To find this answer, you would track the Insert key and the Undo key and see how often the user undid whatever she did in overtype mode. Microsoft eventually got that data, which did indeed prove that I was right, and turned this feature off by default. (You can reenable it on the Advanced settings, if you care enough to go searching for it.)
If your program has a Help system, you definitely want to track the topics that users ask for help on. That will tell you the parts of your user interface that aren’t clear to users.
You might want to consider tracking in which dialog boxes the user most often clicks Cancel instead of OK. It might mean that users bring up that box by mistake. Perhaps the menu item leading to it is unclear.
Telemetry Example
To show a good example of telemetry, an example in which readers and students can participate, we’ll look at a mobile phone app. Xamarin is a platform that allows you to develop apps for Android, iPhone, and Windows Phone from a single codebase, using C# in Visual Studio. It’s a good place from which to demonstrate telemetry as well.
We’ll start with Xamarin’s BugSweeper sample app, written by the one and only Charles Petzold. (I first learned Windows programming, the 16-bit SDK in C, from his famous book back in the day.) It’s conceptually similar to the Minesweeper app you find in Windows, alongside Solitaire. The sample app comes in iPhone, Android, and Windows Phone flavors. Figure 5.7 shows a screenshot from a Nexus 5.

The first design decision we need to make is choosing a telemetry provider. Because we are already using the Xamarin mobile framework, it’s easiest to use Xamarin’s own telemetry provider, called Xamarin Insights. It works well and is simple to use, and it has a free level of usage to entice you and get you started. It is very much aimed at integrating crash recording with UX tracking.
The main competitor for this particular sample was Google Analytics, which has the capability of tracking mobile apps. It is much more flexible and more powerful than Xamarin Insights, but also much more complicated. Amazon currently shows six separate books dedicated to it. The work required to splice it into this project would have been overkill for this small example.
Going to Insights.Xamarin.com brings up a developer tool subscription login. On the Insights main page, XI requires us to “create an app,” which is somewhat confusing. If we already have an app, one that works well, would this create a new blank project or something? When we click on that link, we find that by “create an app,” XI means to “enable telemetry on an existing Xamarin app.” One could argue that register would be a clearer verb than create. It gives us a unique key, a text string that we will use in our code to differentiate our app from all the other apps that XI tracks. Figure 5.8 shows this screen.

We then download and install the XI packages into our development environment. That doesn’t take long. We also have to add code to our app’s initialization function to initialize XI. Here it is in Listing 5.2.
Listing 5.2 Initialization Code for Xamarin Insights
public class MainActivity : FormsApplicationActivity
{
protected override void OnCreate(Bundle bundle)
{
// Start Insights
Insights.Initialize(
"3457c920b9a3fbf63d662e690cedaacd83d6eac",
Android.App.Application.Context);
}
}
When the app initializes, it sets up communication with XI to track a number of useful items, such as crashes. The Audience tab of the reports, shown in Figure 5.9, shows some interesting items (“Know Thy User, for He Is Not Thee”). You can see the number of users that you get, the countries they come from, the languages they use. You can see the number of daily sessions. How addictive is your game? You can see operating systems and top devices. This gives you a pretty good pulse on your user base. This is great information to have, especially considering the tiny amount of work and money you had to expend to get it.

Now we want to track key performance indicators, data that is specifically about our game. What should these be? Any game developer knows that a game has to have just the right balance of challenge to be successful. If it’s too easy, users quickly get tired of it and walk away. They do the same if it’s too hard. So the first thing we need to know about the game is whether the users are winning it or not.
Xamarin Insights allows you to track your own items. These are called “Events.” An event is anything at all in your program that you want to know about and make a call to track. Let’s have an event called “GameWon” and another called “GameLost.” In our (actually Petzold’s) end of the game code, we’ll add calls to XI to track these events.
We also want to know how long each game lasted. At the beginning of the game, Petzold starts a timer to display on the screen. At the end of the game we read that timer and track the results. We want to track the elapsed time in seconds, but here’s a snag: If a game goes on for a long time—say, the person starts playing it, gets distracted, puts the phone back in a pocket, then doesn’t come back to it for a week—that huge value would throw off any sort of scaling in displaying the results. So after we fetch the elapsed time, if the game took longer than ten minutes (600 seconds), we’ll truncate it to 600 seconds. If we get a whole lot of these, we’ll need to rethink the way we’re recording times (and also how users are playing the game).
A game that you lose probably takes a whole lot less time than a game that you win. So we’ll record the duration of the game in the same event with which we recorded the win or loss. Listing 5.3 shows our call to XI.
Listing 5.3 Making a Call to XI to Track a Custom Game Event
int GameSeconds ;
if (hasWon)
{
// Track a win, with the elapsed time
Insights.Track("GameWon", "Time", GameSeconds.ToString());
DisplayWonAnimation();
}
Finally, say we’re also curious as to how our customers hold their phones while they’re playing. It’s probably not a huge deal right now, as the game board is square. But if we ever want to make it rectangular, we’ll need to know in what direction to extend it. We go to the correct place in the sample code, fetch the orientation from the Xamarin frameworks, and track it in XI. One could make a case that since Xamarin is a development environment for mobile apps, XI should automatically track this for you, but it currently doesn’t. For the wish list, perhaps.
We could think about tracking individual users. Are 20% of our users playing 80% of our games? How does winning percentage improve over time? Tracking individual users is not hard in XI. You assign each user a unique code, a large random number that you generate the first time the app starts up on a device. You never associate it with a person’s identity, so it stays anonymous. XI makes it easy to associate your events with a specific user. But that is more work than necessary for this simple example. We’ll pass on it for now until we examine the basic data to see what it’s telling us.
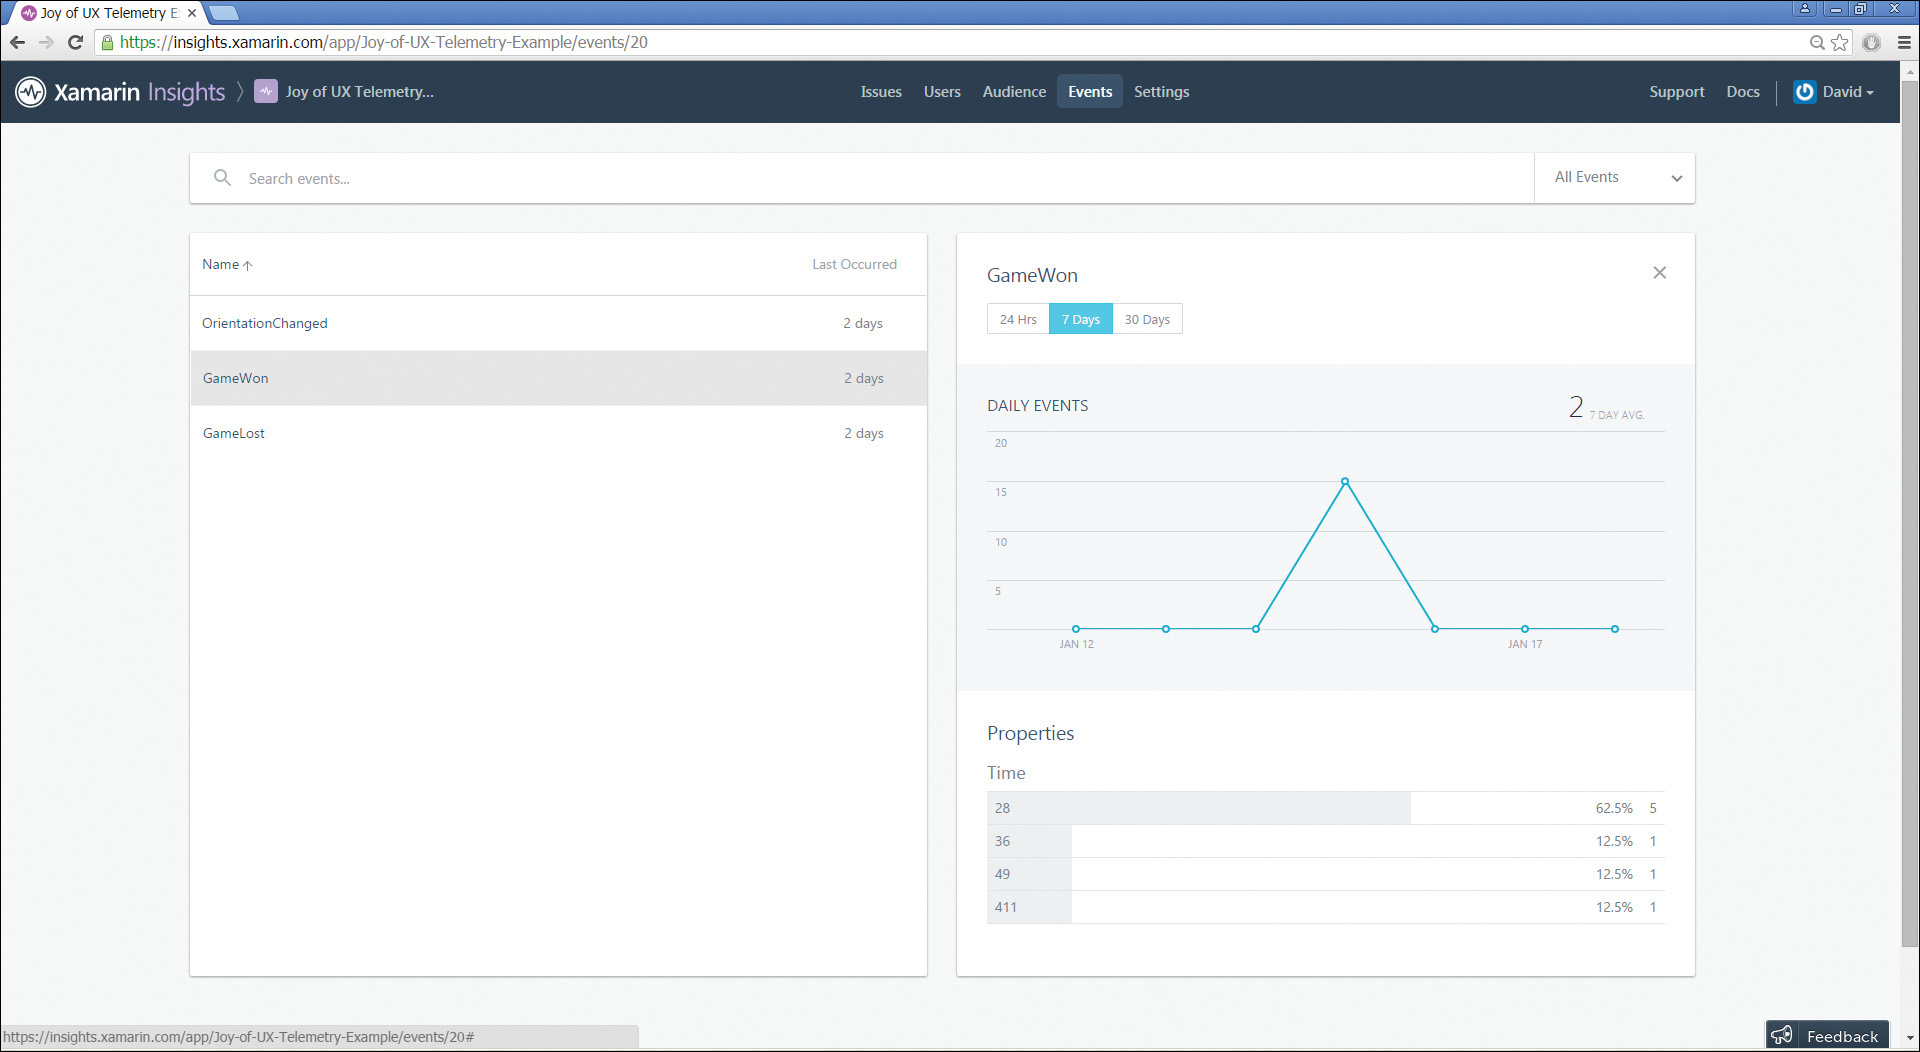
I published my sample app on the Google Play app store, for free. I then sent an email to everyone in my contacts list and publicized it on every social media app that I use, asking users to download it and run it a while so I could see the results. Figure 5.10 shows a quick look at some of them. The user won 15 games, and the most frequent time was 28 seconds.
I wish that I could download the raw data so I could slice and dice it with my own analytical tools. Xamarin does not provide this capability at the time of this writing, though it is by far the most requested feature and is said to be coming soon.
Suggestions for Telemetry Today
After working with telemetry for some years, I’ve come to the following conclusions about how we should be using it today:
![]() Telemetry is a fundamental part of today’s standard of care. It is not optional. Without it, you cannot possibly make design decisions as well as you need to. If you do not use telemetry, the developers who do will clean your clock. Fortunately, as we’ve seen, the impact of adding the telemetry code is minimal.
Telemetry is a fundamental part of today’s standard of care. It is not optional. Without it, you cannot possibly make design decisions as well as you need to. If you do not use telemetry, the developers who do will clean your clock. Fortunately, as we’ve seen, the impact of adding the telemetry code is minimal.
![]() Once you acknowledge that you need telemetry, it follows that you need to bake telemetry into your app from the very beginning. Don’t fall into the trap of saying, “We’ll get the app working right, then we’ll start thinking about splicing in the telemetry for version 2.” How can you possibly know if version 1 of your app is working right if you don’t have the information from telemetry? Starting small is just fine, desirable even. But you need to know how that small piece is working before you can enlarge it.
Once you acknowledge that you need telemetry, it follows that you need to bake telemetry into your app from the very beginning. Don’t fall into the trap of saying, “We’ll get the app working right, then we’ll start thinking about splicing in the telemetry for version 2.” How can you possibly know if version 1 of your app is working right if you don’t have the information from telemetry? Starting small is just fine, desirable even. But you need to know how that small piece is working before you can enlarge it.
![]() Start your data collection small. Telemetry can easily overwhelm you. I’ve seen this candy store mentality, where developers who are new to telemetry grab at everything in sight. Don’t give in to this. Start by collecting small and manageable sets of data, as we did in our example program. This data will suggest what you should look at next.
Start your data collection small. Telemetry can easily overwhelm you. I’ve seen this candy store mentality, where developers who are new to telemetry grab at everything in sight. Don’t give in to this. Start by collecting small and manageable sets of data, as we did in our example program. This data will suggest what you should look at next.
![]() Be very careful to understand and comply with the customer’s expectation of privacy, whatever that might be. It’s a good idea to provide the capability of turning telemetry off. Few users will take you up on it, nowhere near enough to change your statistical validity. Think long and hard before you collect any data that is personally identifiable.
Be very careful to understand and comply with the customer’s expectation of privacy, whatever that might be. It’s a good idea to provide the capability of turning telemetry off. Few users will take you up on it, nowhere near enough to change your statistical validity. Think long and hard before you collect any data that is personally identifiable.
![]() And finally, you must understand that telemetry is never the whole story. It is absolutely necessary, but it is nowhere near sufficient. It is a complement to lab testing, not a replacement for it. You also need to coordinate it with user data you get from other channels such as tech support. Each of these communication channels has different sets of advantages and drawbacks, showing you different aspects of the users’ total experience but hiding others. Only by looking at them all together can you synthesize the whole picture.
And finally, you must understand that telemetry is never the whole story. It is absolutely necessary, but it is nowhere near sufficient. It is a complement to lab testing, not a replacement for it. You also need to coordinate it with user data you get from other channels such as tech support. Each of these communication channels has different sets of advantages and drawbacks, showing you different aspects of the users’ total experience but hiding others. Only by looking at them all together can you synthesize the whole picture.
Getting Telemetry Wrong
Here’s a classic example of getting telemetry wrong. It reminds me of the Sherlock Holmes story that featured a dog that didn’t bark:
Microsoft released Windows 8 in August of 2012. It featured a drastically changed user interface layout intended to support tablet-based devices. As a result, it didn’t have the Windows Start menu in its lower left corner, as had every version of Windows for the previous 17 years. Microsoft thought that users wouldn’t miss it. Microsoft was wrong.
Microsoft made this decision because its telemetry reported that users rarely used the Start menu. For frequently used programs, users pinned icons on the taskbar. For infrequently used programs, they clicked on the Start button and typed characters into a text box, where the auto-search located them faster than menu selection could. Microsoft therefore thought that users didn’t need or want the Start menu anymore.
History records the result. Windows 8 was extremely unpopular with mainstream PC users, flopping even worse than Windows Vista, which is saying something. The lack of a Start menu was one of the main reasons. For users who did adopt Windows 8, a replacement Start menu was by far the most popular add-on app.
Microsoft did not realize that, even though users rarely navigated via the Start menu, they found its mere presence to be reassuring. When users first saw Windows 8, they invariably looked for this orientation point and didn’t find it. They felt disoriented, as if Microsoft had pulled the rug out from under them. They didn’t say, “Wow, Microsoft, you’re every bit as cool as Apple. Thank you for turning my world upside down.” They said, “WTF? Where am I?” And they didn’t like it one tiny bit.
Microsoft had to restore the Start menu with the release of Windows 10. The fact that Microsoft skipped over Windows 9 in the numbering scheme shows how eager the company is to distance today’s product from Windows 8.
How could Microsoft have avoided this misstep? Again, telemetry is necessary, but not sufficient. Microsoft’s other channels of user research should have shown them this problem when they tried it on early users. But Windows 8 was a classic example of an echo chamber, where the team heard only their own internal feedback saying how cool they all agreed that they were and ignored anything that didn’t fit their own preconceptions.
They forgot that their user wasn’t them. And they got what happens whenever any developer forgets that. Don’t let that be you.