
Chapter 7
Sequential™
At the time I entered the investment business, it was commonplace to attempt to identify price tops and bottoms by using cycles. The length of these cycles was determined by calculating either the number of days from one price low to a succeeding price low or the number of days from a particular price low to a subsequent price peak (see Figures 7.1 and 7.2). This method of market timing is subjective and, because the periods are not static, it does not lend itself to statistical analysis and testing. In fact, the interpretation of cycles is sufficiently vague that, often, where a low or a high might be expected to be found, a condition called “inversion” occurs instead: prices actually do the opposite of that which was anticipated. I was disturbed by this lack of predictability. Consequently, I experimented with the application of the Fibonacci time series to cycles and obtained somewhat better results but nothing extraordinary.
I have always been skeptical of the practice of relying on cycles to identify price tops and bottoms. It is difficult for me to accept the fact that an arbitrarily derived number of days possesses repetitive properties. Quite to the contrary, my research studies suggest that the price action of some trading days is actually meaningless.
Consequently, I researched exhaustively to create a technique that would employ a mechanized timing device to identify price highs and lows as they occurred. I experimented endlessly to determine what price relationships typically appeared prior to and coincident with market turning points. Let me describe, in basic terms and by using simple examples, the process I followed.
Source: Logical Information Machines, Inc. (LIM), Chicago, IL.
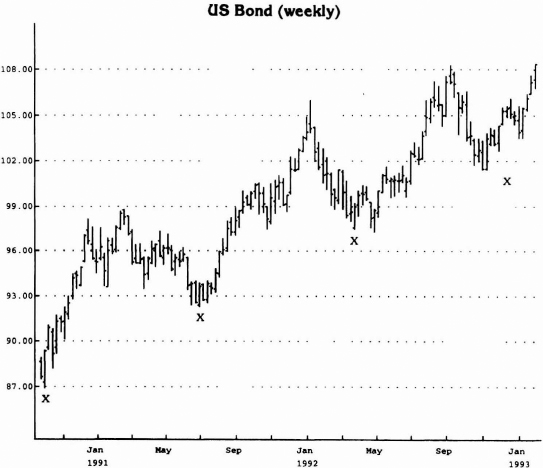
Figure 7.1 The approximate period of time from a price low to a subsequent price low is 39 weeks. Each low for this cycle is marked with an X.
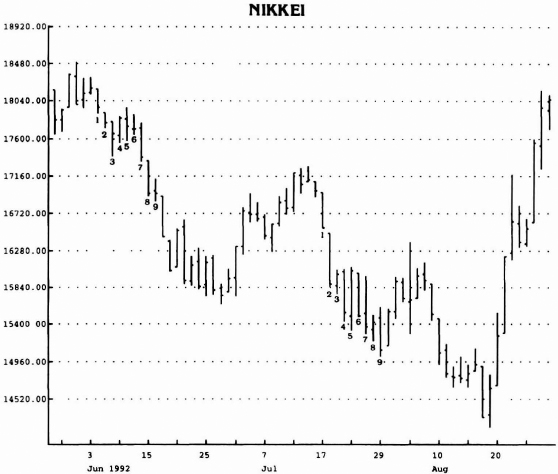
Once demand exceeds supply, price advances. Whether this advance is due to short covering, purchase recommendations, positive news, or any other factors is immaterial. At a certain point in time, figuratively speaking, all the potential buyers will have bought. Unless there is a catalyst to entice a new crop of buyers, the market is vulnerable to decline for two reasons: (1) an exhaustion of buying or (2) an increase in the pace of selling. My experience confirms that, typically, prices peak not because of sophisticated and knowledgeable sellers' accurate identification of the price high, but rather because the “last buyer” has bought. Conversely, as supply exceeds demand, price declines. Whether this selloff is attributable to bad news, sell recommendations, short selling, or any other factor is immaterial. Eventually, however, all the potential sellers will have sold. My research has proven that price bottoms are made once the last seller has sold and, by default, price moves up. In fact, when aggressive buying prematurely occurs at an interim low, typically it is associated with a short covering rally. Consequently, after the buying frenzy diminishes, a price vacuum is created and ultimately price declines even faster and further until a new equilibrium level between supply and demand is established (see Figure 7.3). At that point, if the dynamics are right and the selling pressure has been exhausted, price has an opportunity to reverse upside.

Source: Logical Information Machines, Inc. (LIM), Chicago, IL.
Figure 7.2 The approximate number of weeks from a price low to a subsequent high close is 10 weeks. The periods are marked X and Y.
As price advances, it approaches its ultimate peak; conversely, as price declines, it moves closer to its eventual low. These comments are made not to insult your intelligence, but rather to emphasize the obvious: selling into strength and buying into weakness are practices often overlooked and believed unattainable by traders. As a result, most traders are trend followers who subscribe to the notion that a particular trend will continue in force. They believe that attempts to buy into a declining market are akin to catching falling daggers. To overcome this fear, some traders utilize cycles, but as I mentioned earlier, cycles are too arbitrary and subjective. Consequently, I created a technique that incorporates in vague terms the concept of cycles without the handicap of time rigidity.

Source: Logical Information Machines, Inc. (LIM), Chicago, IL.
Figure 7.3 Observe the 10-week advance (A-B) and the abrupt, severe 5-week decline to new lows (C).
Whereas cycles traders employ a prescribed time series, I rely on a dynamic set of variables that adjusts to market action. In other words, I wait for the market to speak to me as the price movement unfolds. Actions speak louder than words, and what better source of market direction is there than the market itself? All information known, including all the hopes and fears of traders, is translated into one important item— price. Should unexpected developments regarding market fundamentals arise and the supply-demand equation be shifted as a result, the price movement should reflect this change. Just as the market's price personality constantly undergoes change, so too any system that attempts to identify price tops and bottoms must adapt to these character swings in money flow and measure them precisely. This major deficiency of conventional cycles analysis makes it inferior to the versatile approach I will share with you.
My research confirms the fact that, prior to a price top or bottom, the market announces its intentions regarding price direction loud and clear to any trader willing to listen. Specifically, the market forewarns the trader whether it is predisposed toward a price top or toward a price bottom. In other words, the market's environment or inclination to top or to bottom is first defined by this setup phase. Because this entire approach is mechanical, as are the additional filters required to actually generate the buy and sell signals, I developed a checklist to simplify this process (see below). The feature of this approach is its design to buy into weakness and to sell into strength. Once all the prerequisites are satisfied in the order required, a signal occurs. Hence, the name Sequential™ was given to the system.
The procedure followed to establish a Sequential buy or sell signal is straightforward and uncomplicated. In fact, the simplicity associated with its implementation concerned me at the time I developed the technique. I was puzzled that no one else had previously discovered and integrated the same time series and price relationships. Continuously, I checked and rechecked my studies to make certain that I had not overlooked some key element. Keep in mind that the period of development and testing was not by any means recent—this all took place in the 1970s. It was conceived and researched prior to the era of computers. Since that time, this technique has had universal application to various markets, including stocks, futures, and indexes. As a result of additional research, I have developed enhancements to the original Sequential™, but the core of the method still exists and thrives. How many other definitive market timing approaches designed to anticipate price tops and bottoms have endured and have withstood a similar test of time? Not many, if any at all.
Setup
To generate a sequential buy signal, the market environment must first be predisposed to rally. My research determined that a prerequisite to a buy is a particular relationship among closing prices over a period of nine consecutive days. Specifically, once a period of at least nine consecutive trading closes less than the close four trading days earlier is recorded, then the buy setup is complete. For example, if the close of trading on Friday is less than the close of trading on that same week's Monday (assuming trading occurred on Thursday, Wednesday, and Tuesday), one day of a possible set of nine is defined. Had the close of Friday been equal to or greater than the close on Monday, however, this day would not have qualified as one day of a nine-day buy setup.
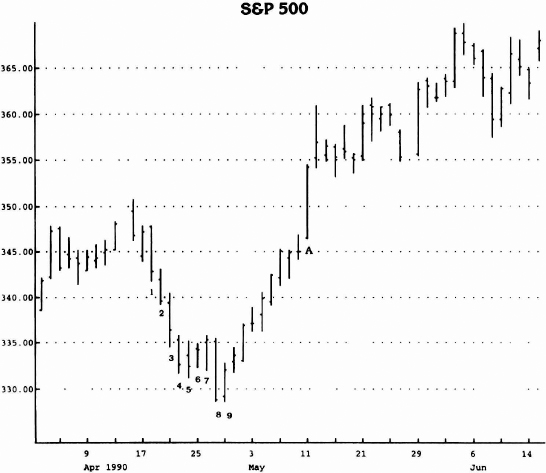
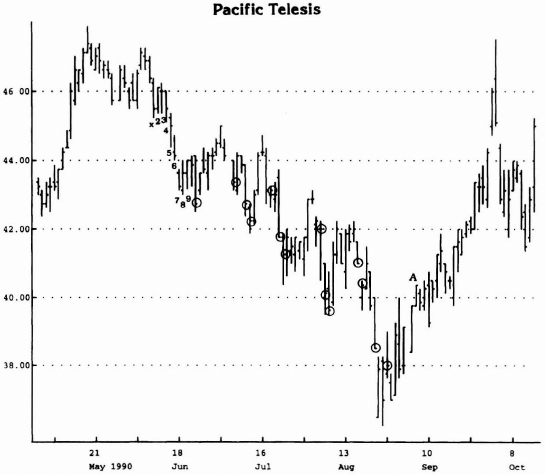
Figures 7.4 and 7.5 describe the requirements for a valid buy setup. The first day of the nine-day buy setup must be preceded by a close on the trading day immediately before it that is greater than or equal to the close four trading days earlier (see Figure 7.6). As is apparent from these examples, it is not uncommon to witness a short-term bottom or even a price reversal upon completion of the nine-day setup. Unless the market is in a free fall or in a short-term correction within an uptrend, this short-term price hiccup is just a reprieve in the downtrend and the decline should resume.
Source: Logical Information Machines, Inc. (LIM), Chicago, IL.
Figure 7.4 Requirements for a valid buy setup.
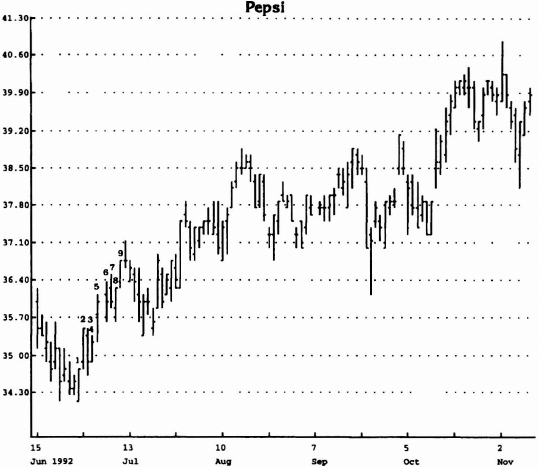
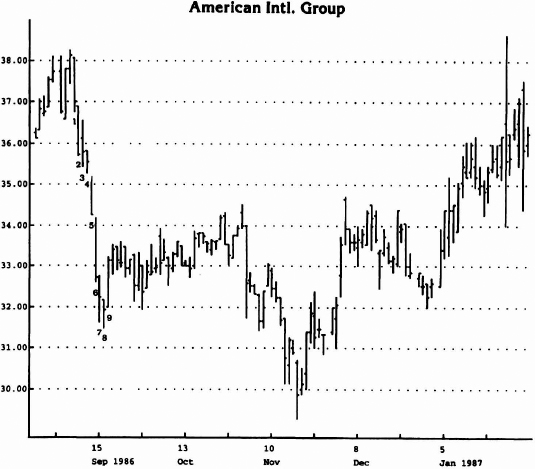
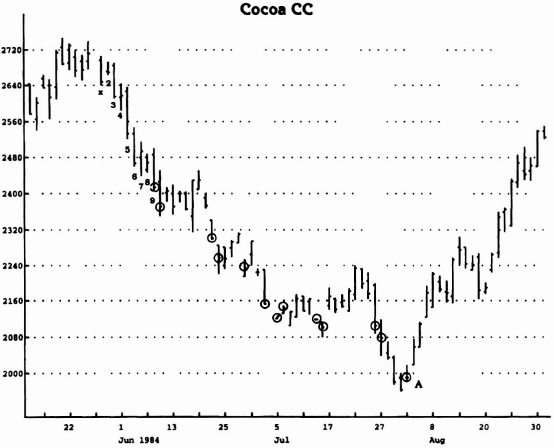
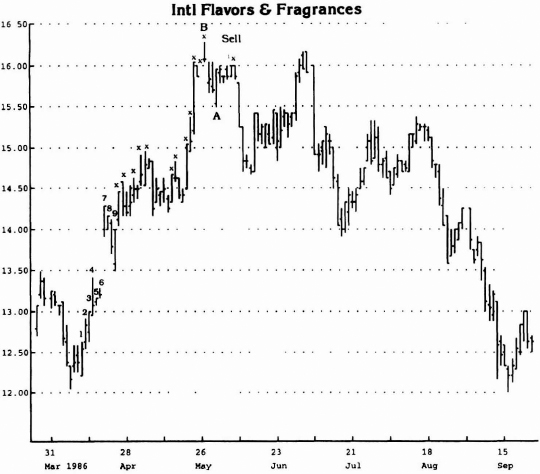
In order to generate a sequential sell signal, the market environment must be predisposed to a decline. The prerequisite for a sell setup is exactly the opposite of the prerequisite for a buy signal. A buy setup requires a series of nine consecutive days' closes less than the close four trading days earlier; a sell setup requires a series of nine consecutive trading days' closes greater than the close four trading days earlier. For example, if the close of trading on Friday is greater than the close of trading on that same week's Monday (assuming trading occurred on Thursday, Wednesday, and Tuesday), one day of a possible set of nine has been defined. Had the close on Friday been less than or equal to the close of Monday, this day would not have qualified as one day of a nine-day sell setup. The requirements for a valid sell setup are described in Figures 7.7 and 7.8. The first day of the nine-day sell setup must be preceded by a close on the trading day immediately before it that is less than the close four trading days earlier (see Figure 7.9). Similar to the buy setup, a derivative benefit of the nine-day sell setup is the identification of a short-term high once the setup is formed. Unless the market is in a blow-off phase or the overall trend is defined as down, this pullback should be temporary, however, and the advance should resume.

Source: Logical Information Machines, Inc. (LIM), Chicago, IL.
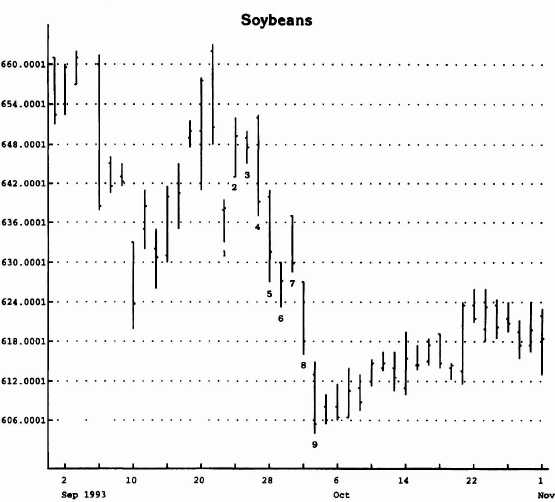
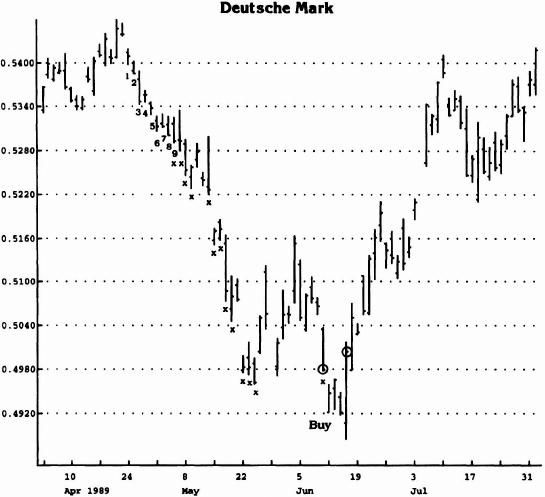
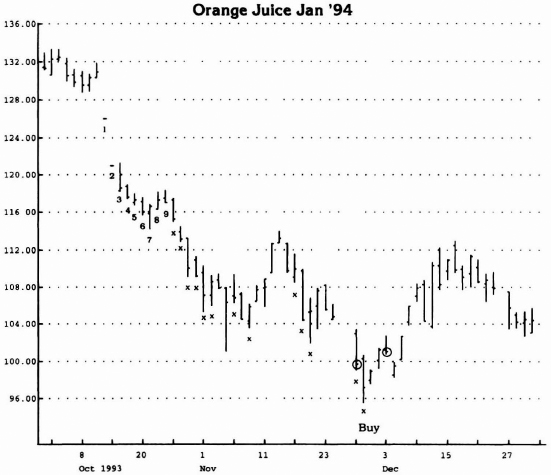
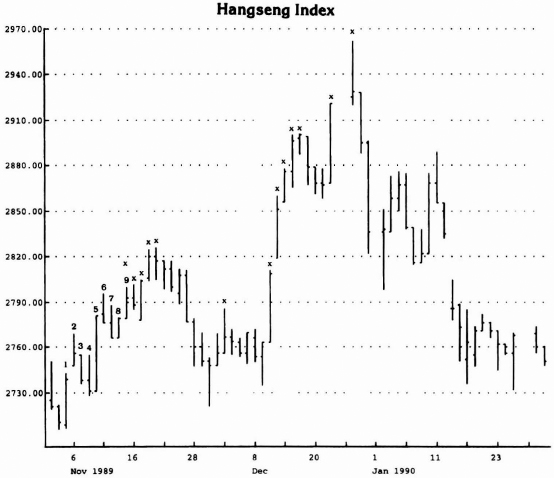
Figure 7.5 The first close less than the close four trading days prior to it is marked with an X. All subsequent days are marked numerically. It is not uncommon for price to reverse or moue sideways once the setup of nine days is recorded.
Source: Logical Information Machines, Inc. (LIM), Chicago, IL.
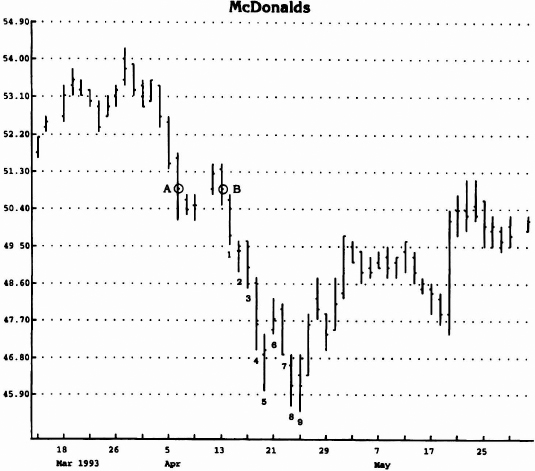
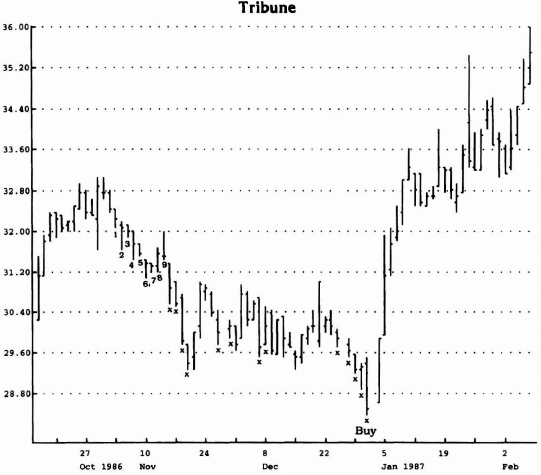
Figure 7.6 The close on day B is greater than or equal to the close on day A. The next day's close is less than the close four days earlier and is counted as day one of the setup. Note how price bottomed out on the ninth day of the setup.
As you can see, the setup is very simple to establish. Either it requires nine consecutive trading days' closes less than the trading days' close four days before each for a buy signal, or it requires nine consecutive trading days' closes greater than the trading days' close four days before each for a sell signal. It is important that:
Source: Logical Information Machines, Inc. (LIM), Chicago, IL.
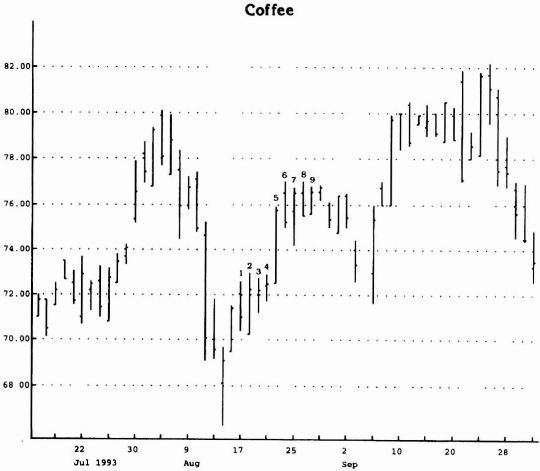
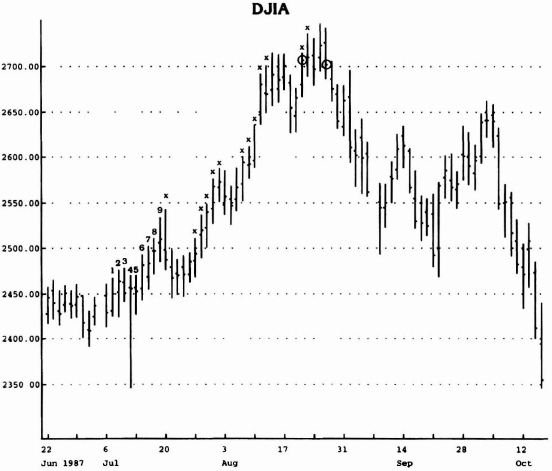
Figure 7.7 Nine consecutive days in which the close is greater than the close four trading days earlier are counted on this chart—in other words, a sell setup has been completed. Notice the price “hiccup” or “stutter” as I describe it upon completion of this series—although it is not always the case, frequently the price movement stalls or reverses upon setup completion.
- Each of the three days between the current trading day and the trading day's close four days ago is a trading day;
- The trading day's close of the day prior to day one of a buy setup is greater than the close of the trading day four days earlier, and the trading day's close of the day prior to day one of a sell setup is less than the close of the trading four days earlier:
- If the close of a trading day is equal to the close of the trading day four days before it, the setup series is interrupted and must begin anew;
- The series of consecutive closes may exceed nine but the required period for a valid setup is satisfied once the requirement of nine consecutive closes is met.
Source: Logical Information Machines, Inc. (LIM), Chicago, IL.
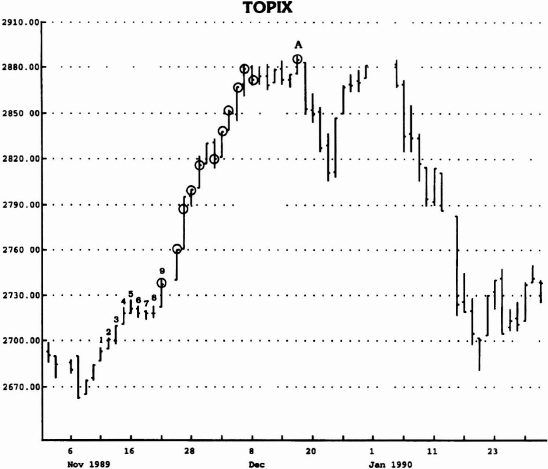
Figure 7.8 A series of nine consecutive closes greater than the close four trading days earlier defines the sell setup. Note that price established short-term peaks upon completion of the setup period—the ninth day.
There is a natural rhythm defined by the setup series of nine consecutive closes greater than or less than the close four days earlier. Generally, the market will experience a reversal or a stabilization in price at that time. In fact, as mentioned earlier, in some instances, price will record a significant turn at just that point. These observations are universal and apply to all markets and to all time intervals.
Source: Logical Information Machines, Inc. (LIM), Chicago, IL.
Figure 7.9 On the day prior to the first day of the sell setup, the close (A) was less than the close four days earlier (B).
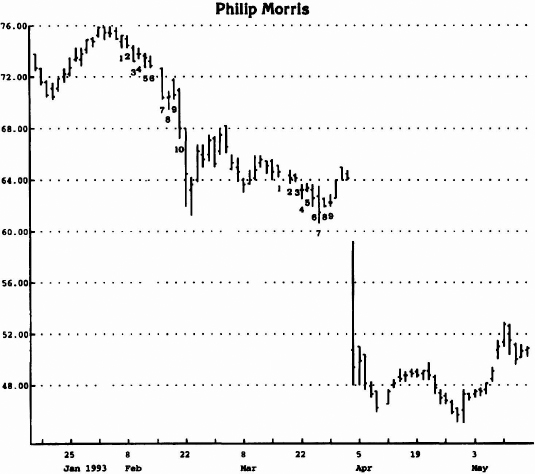
I made an observation several years ago regarding the comparison between the most recent price setup and the most recent price setup in the other price direction. As the current price setup is being formed, I compare (1) the extreme price peak or low— depending on whether the movement is up or down— recorded from the first day of the most recent setup through its completion with (2) that of the most recent “inactive” setup through its completion. An inactive setup is defined as one in which the series of consecutive closes versus closes four days earlier has numbered at least nine but has been interrupted and one in which the trend contradicts the current setup (see Figures 7.10 and 7.11). By definition, this must be the case because the current setup occurs in the other direction. Although, technically speaking, the setup is comprised of a series of nine consecutive closes greater than the close four trading days earlier for a sell (and less than for a buy), the comparison of the two setups does not necessarily require the completion of the entire current series of closes because the peak or trough can exceed the trough or the peak—depending on whether the current setup is up or down—of the inactive setup before the setup is completed. In fact, it may not be formed at all. This particular technique has enabled me to define the trend of various markets on numerous occasions, and it is a valuable derivative benefit of a Sequential™ setup.
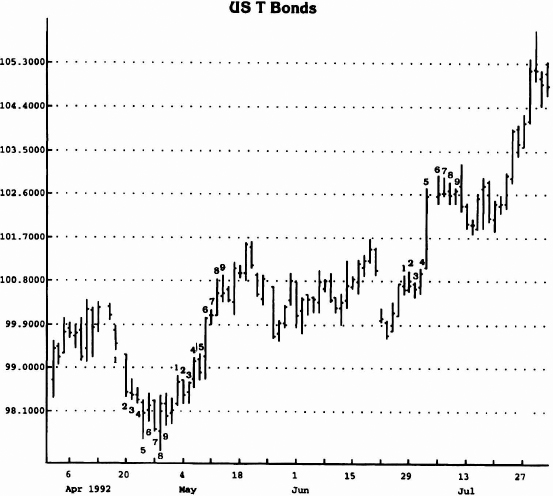
Source: Logical Information Machines, Inc. (LIM), Chicago, IL.
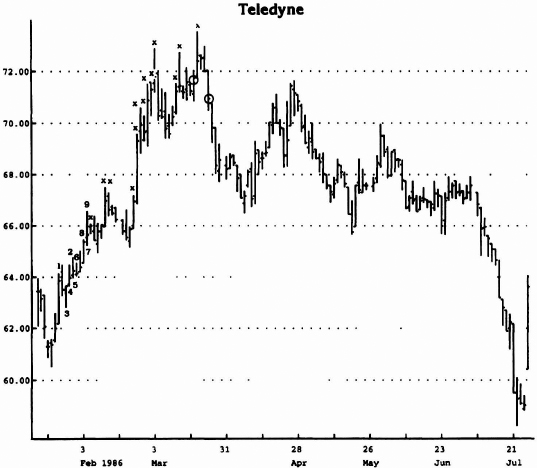
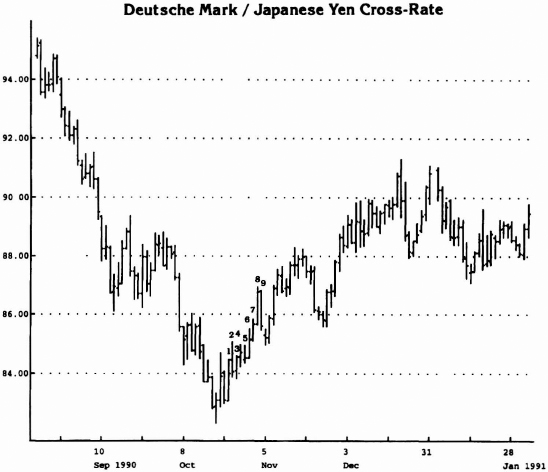
Figure 7.10 Note how the nine consecutive up closes (setup) in early–mid May exceeded the nine consecutive down closes (setup) recorded in late April.
Source: Logical Information Machines, Inc. (LIM), Chicago, IL.
Figure 7.11 In both instances (Figure 7.10 as well), you can see a series of setups. In both cases, note short-term top (bottom) generally seen after nine setup—price “hiccup” or “stutter” if you will.
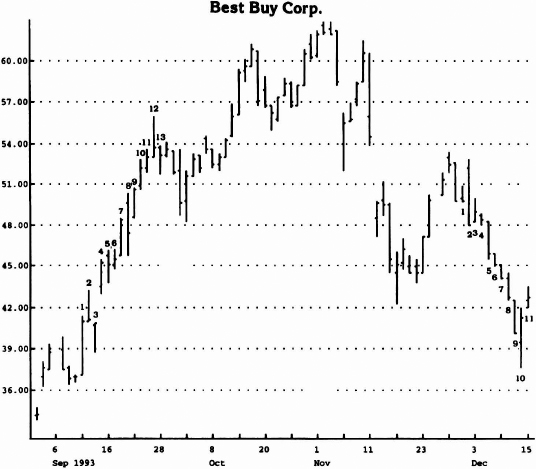
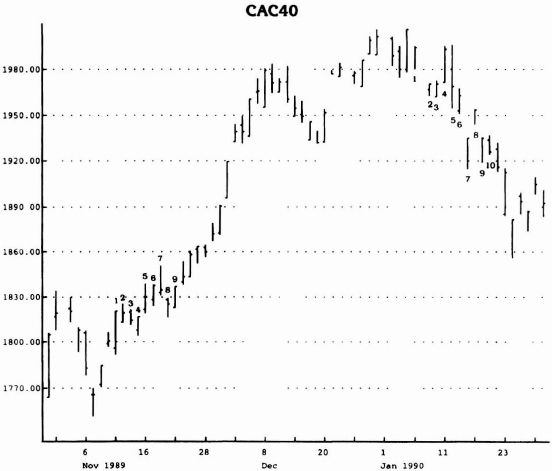
A vital element is required to validate the Sequential setup. Its absence underscores the fact that the market is in a runaway phase. For example, if price is declining in a waterfall manner, it is important that a retardation of the decline occur to prevent premature entry. Conversely, to avoid the problem of early entry in an upside blow-off, an indication that the price brakes have been applied is a necessity. Once the setup has been properly qualified, the next phase of Sequential—the countdown—begins. The setup qualification process, called “intersection,” is very easy to understand. Simply stated, intersection requires that the price range of either the eighth or the ninth day of the setup overlap the price activity of any setup day three or more days earlier. In other words, intersection for a buy setup takes place once the high of either day 8 or day 9 of the setup is greater than or equal to the low three, four, five, six, or seven days earlier (see Figures 7.12 and 7.13). On the other hand, intersection for a sell setup occurs once the low of either day 8 or day 9 of the setup is less than or equal to the high three, four, five, six, or seven days earlier (see Figures 7.14 and 7.15). Intersection can also take place in one other instance: if intersection does not occur on day 8 or on day 9 of the setup, then it may occur on any subsequent day, regardless of whether that day is a continuation of the setup or not. All that is required is that the price intersect the price low three or more days earlier in the case of a buy setup or intersect the price high three or more days earlier in the case of a sell setup. However, in both instances, the countdown phase is postponed until intersection is satisfied (see Figures 7.16 and 7.17).
Source: Logical Information Machines, Inc. (LIM), Chicago, IL.
Figure 7.12 Price intersection did not occur on day 8, but it did on day 9 once the price high that day exceeded the low three day's earlier—day 6 in this example.

Source: Logical Information Machines, Inc. (LIM), Chicago, IL.
Figure 7.13 Both setups (Figure 7.12 as well) fail to record intersection on day 8 of the setup but they do so on day 9.
Source: Logical Information Machines, Inc. (LIM), Chicago, IL.
Figure 7.14 In both regards—sell setup and buy setup—intersection did not occur on day 8 or day 9 of the setup, but rather on day 13 and day 11, respectively.
Source: Logical Information Machines, Inc. (LIM), Chicago, IL.
Figure 7.15 Whereas intersection did occur on the sell setup on both day 8 and day 9, for the buy setup it was delayed until day 10.
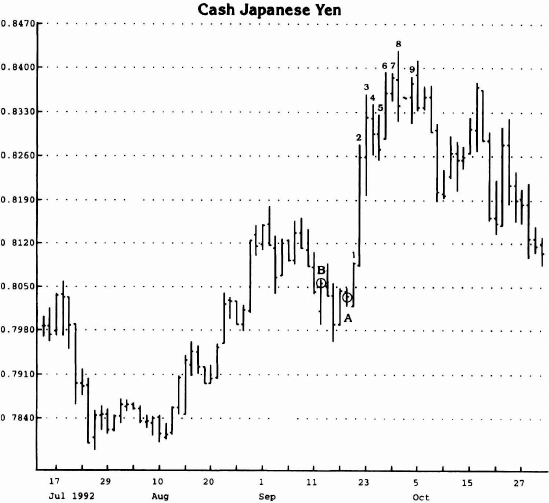
There are two instances in which the setup can be canceled. They are very simple and straightforward. The most common is a phenomenon called “recycling,” which is described in the section on countdown below. The other is related to the closing prices recorded at any time between the completion of the setup and the generation of a signal. More precisely, should a subsequent closing price exceed either the highest intraday high—in the case of a buy setup—or the lowest intraday low—in the case of a sell setup—the setup phase is canceled and it must be reinitialized (see Figures 7.18 and 7.19).
Source: Logical Information Machines, Inc. (LIM), Chicago, IL.
Figure 7.16 The intersection for the first buy setup was postponed until day 10 and countdown does not begin until intersection and the setup are both complete.
Countdown
Once setup has been satisfied, the countdown process begins. Countdown describes the relationship of the close to either the high or the low price two trading days earlier, depending on whether a sell or a buy setup is active (see Figures 7.20 and 7.21). With respect to a pending buy signal, the close must be less than the low two days earlier; with respect to a pending sell signal, the close must be greater than the high two trading days earlier. Once a total of 13 closes less than the low two trading days earlier in the case of a buy, or once a total of 13 closes greater than the high two days earlier in the case of a sell are recorded, a signal is generated. These 13 closes need not occur consecutively; they will occur only rarely, if at all. Once intersection has taken place to validate completion of the setup—and beginning no earlier than day 9 of the setup—the countdown begins. By definition, the countdown period cannot be completed any sooner than 12 days after setup, and that assumes that day 9 qualifies. Typically, however, one might expect 15 to 30 days to lapse between the setup and the completion of countdown (see Figures 7.22 and 7.23).

Source: Logical Information Machines, Inc. (LIM), Chicago, IL.
Figure 7.17 The intersection for the sell setup occurred on day 9 of the sell setup. The intersection for the buy setup took place on day 11 of the buy setup.

Source: Logical Information Machines, Inc. (LIM), Chicago, IL.
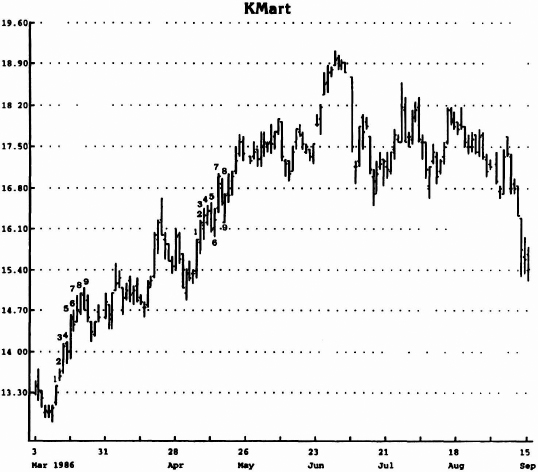
Figure 7.18 Note how close at point A on chart exceeded the highest high of the buy setup in late March counted on the chart.
Source: Logical Information Machines, Inc. (LIM), Chicago, IL.
Figure 7.19 In both instances, Figure 7.18, as well as this one, closing price A exceeds the highest intraday high of the buy setup.

Source: Logical Information Machines, Inc. (LIM), Chicago, IL.
Figure 7.20 The “X” marked days identify the 13 countdown days recorded upon completion of the sell setup.
Source: Logical Information Machines, Inc. (LIM), Chicago, IL.
Figure 7.21 The “X” marked days identify the 13 countdown days initiated upon completion of the buy setup.
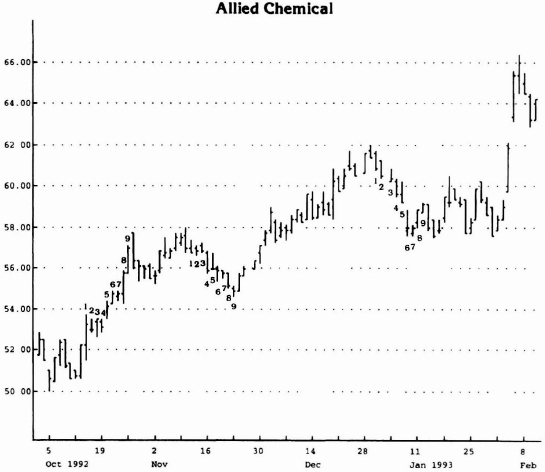
Two situations that could arise after setup would cancel countdown. The first situation invalidates the original setup and requires the process of setup formation to start over. The original setup is negated at any time subsequent to setup, and prior to a signal, a setup in the opposing direction occurs (see Figures 7.24 and 7.25). The second situation does not require additional time to form a new setup, but it does recycle (start over) the countdown phase. In this case, a subsequent setup is formed simultaneously as the countdown process is taking place. This new setup replaces the original setup and is in concert with the original setup, not contradictory (see Figures 7.26 and 7.27). This occurs often and is a function of the market's reevaluating the supply and demand equation and reestablishing the path and the time parameters to the ultimate top or bottom. In both instances, the original setup and the countdown are repealed; in the second situation, a new setup has been formed through the recycling process.
Source: Logical Information Machines, Inc. (LIM), Chicago, IL.
Figure 7.22 Approximately 25 to 30 days lapsed from the initiation of the sell setup to the thirteenth day of sell countdown.

Source: Logical Information Machines, Inc. (LIM), Chicago, IL.
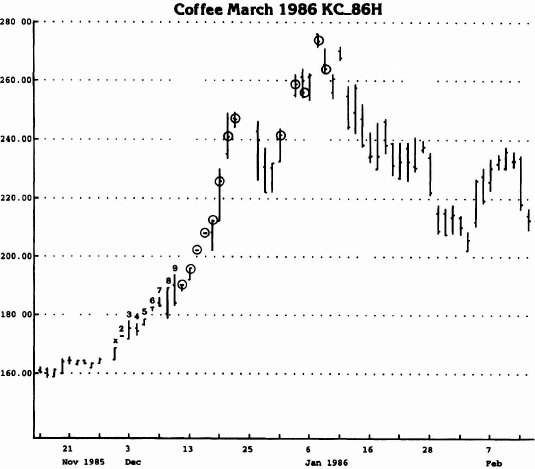
Figure 7.23 Approximately 36 days lapsed from the initiation of the buy setup to the thirteenth and final day of buy countdown.

Source: Logical Information Machines, Inc. (LIM), Chicago, IL.
Figure 7.24 The ninth day of the sell setup coincided with the exact price high. Subsequently, a buy setup was formed that did not confirm intersection until setup day 13.

Source: Logical Information Machines, Inc. (LIM), Chicago, IL.
Figure 7.25 The sell setup negated the buy setup that had been formed earlier.
Source: Logical Information Machines, Inc. (LIM), Chicago, IL.
Figure 7.26 The first sell setup was superseded by a second sell setup.
Source: Logical Information Machines, Inc. (LIM), Chicago, IL.
Figure 7.27 The second buy setup negated the first and became active.
Now that the setup and the countdown phases have been discussed, three other important aspects of Sequential remain outstanding: (1) the entry, (2) the exit, and (3) the stop loss techniques.
Entry
Three methods are recommended for Sequential entry. The first approach enters the market on the close of the day in which countdown is completed (see Figures 7.28 through 7.31). This is the riskiest entry because the setup can be recycled and the original signal will evaporate in the process. A new signal cannot be generated until the countdown process has been replayed. Although the potential exists that the trade may produce a loss, it is the only entry of the three that offers the opportunity to buy or to sell at the absolute closing price low or price high.

Source: Logical Information Machines, Inc. (LIM), Chicago, IL.
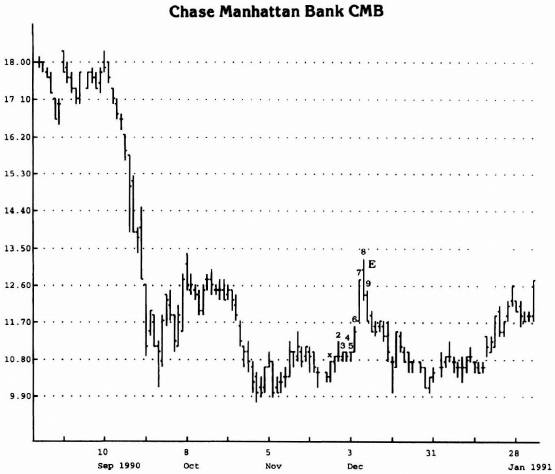
Figure 7.28 Note the sell signal was generated at the high close of the secondary price peak.
The second method ensures that price does not recycle and consequently does not forfeit the active signal. However, it requires a price “flip”—a close greater than the close four days earlier in the case of a buy, or a close less than the close four days earlier in the case of a sell (see Figures 7.32 through 7.35). By awaiting the flip, insurance is bought that a setup will not be recycled.
Source: Logical Information Machines, Inc. (LIM), Chicago, IL.
Figure 7.29 The precise low day was identified as the signal day in this example.
Source: Logical Information Machines, Inc. (LIM), Chicago, IL.
Figure 7.30 Once again the exact high day was the sell day—point A.

Source: Logical Information Machines, Inc. (LIM), Chicago, IL.
Figure 7.31 By executing the trades on the close of the thirteenth day of countdown, ideal entries were selected.
Source: Logical Information Machines, Inc. (LIM), Chicago, IL.
Figure 7.32 Note the “flip” day occurred after the price peak and thirteenth day of countdown, but it confirmed the sell.
Source: Logical Information Machines, Inc. (LIM), Chicago, IL.
Figure 7.33 See how “flip” day occurred subsequent to actual price high and thirteenth day.
Source: Logical Information Machines, Inc. (LIM), Chicago, IL.
Figure 7.34 Once again confirmation close occurred subsequent to the thirteenth day.
Source: Logical Information Machines, Inc. (LIM), Chicago, IL.
Figure 7.35 By awaiting the initiation of trades until the “flip”—close greater (or less than) the close four days earlier—ideal entries were selected. The entry close is circled and marked A.
The final entry technique is to await a two-day range “flip” once the thirteenth day is identified. In other words, once the countdown is completed, buy the first time a subsequent close greater than the high two days earlier occurs or, conversely, sell the first time a subsequent close less than the low two days earlier occurs (see Figures 7.36 through 7.39). This entry perfects the “flip” entry and generally serves as a compromise between entry one and entry two.
Exit
There are two ways in which to exit a trade other than being stopped out of the trade with a loss. The first method is to liquidate the position once the current setup is completed and price fails to exceed the furthest price level recorded by the most recent inactive setup (see Figures 7.40 and 7.41). This exit assumes that because the trend has not reversed as defined by the point of termination of the active setup failing to exceed the furthest price of the most recent inactive setup, there is a likelihood of an impending reversal and thus the trade should be liquidated.

Source: Logical Information Machines, Inc. (LIM), Chicago, IL.
Figure 7.36 See the first close (circled), subsequent to the thirteenth (sell) day, less than the low two days earlier.
The other exit also compares the two setups, but in this instance if any price recorded during the current active setup exceeds the furthest price of the inactive setup, then the position is held until a reverse signal is generated.
Source: Logical Information Machines, Inc. (LIM), Chicago, IL.
Figure 7.37 In this instance the two-day “flip” confirmation translates into a much less favorable sell entry than was the sale on the peak day—the thirteenth count day.
Source: Logical Information Machines, Inc. (LIM), Chicago, IL.
Figure 7.38 The entry for the two-day “flip” is close to the signal day in this example.
Source: Logical Information Machines, Inc. (LIM), Chicago, IL.
Figure 7.39 Rather than executing the buy on the thirteenth day's close, by awaiting the two-day “flip” confirmation, a less advantageous entry price was recorded.
Stop Loss
The final element to consider is the stop loss. Unfortunately, not all trades are successful. To protect against the chance of failure, a stop loss should be installed. My research suggests that two techniques accomplish this money management goal. Both consider the price range of the lowest range day throughout the entire period of setup and countdown for a buy signal, or the price range of the highest range day throughout the entire period of setup and countdown for a sell signal. In the case of a buy signal, the true range for the lowest range day is calculated by subtracting the low that day from the high that day or the close the previous day, whichever is greater. The stop loss level is defined as that value subtracted from the low that day (see Figure 7.42). The reverse technique is applied when calculating the stop loss for a sell signal. The true range for the highest range day is calculated by subtracting from the high that day either the low of that day or the close one day earlier, whichever is greater. The stop loss level is defined as that value added to the high that day (see Figure 7.43). In both cases, a subsequent close must exceed the calculated values in order to activate a stop loss.
Source: Logical Information Machines, Inc. (LIM), Chicago, IL.
Figure 7.40 As you can see on the chart, the nine up setup identified numerically did not exceed the down setup established beginning 11 days before the October price low.
Source: Logical Information Machines, Inc. (LIM), Chicago, IL.
Figure 7.41 The exits are generated if nine consecutive closes greater than the close four days earlier are recorded, a profit is realized, and price does not exceed the setup in the other direction which got you into the trade in the first place.
The second stop loss technique is more conservative. In the case of a stop loss for both a buy signal and a sell signal, the same day selection technique is used. Instead of using the true range, however, a stop loss for a buy signal is calculated by subtracting, from the low the difference between the close and the low; a stop loss for a sell signal is calculated by adding to the high the difference between the high and the close. Just as in the previously discussed stop loss, a subsequent close must exceed the stop loss parameters. Both stop losses are based on the assumption that the market expressed a certain degree of pessimism on that extreme price day and to exceed it on a closing basis would constitute a deviation from its price character and consequently jeopardize the signal.

Source: Logical Information Machines, Inc. (LIM), Chicago, IL.
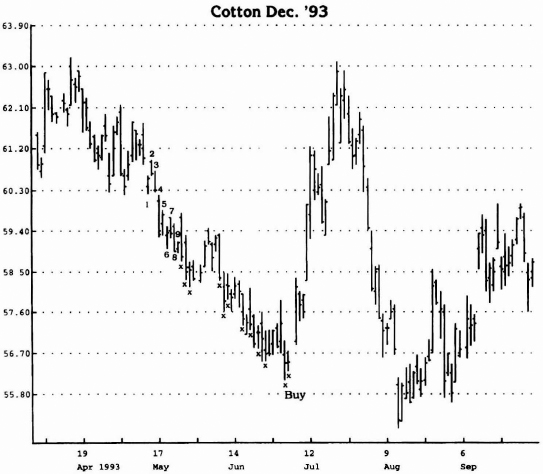
Figure 7.42 Subsequent to the Buy signal, nine consecutive up closes were recorded, and a profitable exit was made.
I was convinced that the sequential method worked well when applied to daily data. Occasionally, I would study charts of a shorter time duration than daily. I observed that the sequential technique worked well. Although I don't recommend its use on any time series other than daily, Figure 7.44 demonstrates the successful application of Sequential™ to a minute chart of the Japanese yen.
Source: Logical Information Machines, Inc. (LIM), Chicago, IL.
Figure 7.43 To establish a stop loss, subtract the true range (Current day's high or close one day ago, whichever is greater – Current day's low or close one day ago, whichever is less). For a buy signal, subtract this value from the lowest day of the setup/countdown period. For a stop loss after a sale, the reverse is done—in this example, the difference between point A—close one day ago—and the high—point B—is added to point B. If price closes above this value, the stop is activated. For a buy stop, everything is reversed.
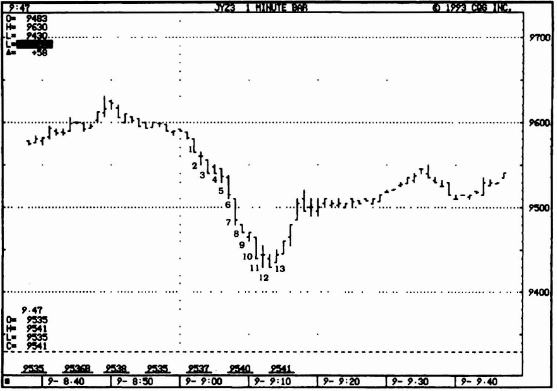
Source: CQG, Glenwood Springs, CO.
Figure 7.44 Note the precision of the 9-13 sequence on identifying the lowest price on the minute chart.
Summary
I have shared with you a technique that appears superficially to be valuable; however, nothing is infallible. Because I was the creator, it is difficult for me to admit the chance of failure. Consequently, it took Paul Tudor Jones and Peter Borish to challenge the method. Their creativity and mindset as floor traders prepared them to accept losses. They queried me regarding the subsequent activity of signals gone awry. Initially, I was insulted by their unwillingness both to focus on the signals and to accept the fact that they would be successful. The price activity of the failures was most instructive. The ones that didn't work were really bad. In a sense, by concentrating on them alone, a trader could enjoy success.
You have been introduced to a powerful tool designed to identify potential turning points in the markets. My experience proves that the technique has universal application to all markets, both foreign and domestic. Its features are its mechanized nature, its long-term perspective, and its ability to fight the prevailing trend. Because of a trader's passion to always be active in the markets, Sequential™ may be considered boring and unappealing. My experience has proven, however, that the most successful traders are at least cognizant of the big picture and take advantage of it. Once again you may be asking yourself why I have given up this valuable brainchild of mine for adoption. I do not view its publication in that context, however. I see it as an opportunity for you to do some babysitting for me while I pursue other market avenues of interest. In addition, in recent years I have introduced two noteworthy enhancements to this basic approach which I have not discussed. I am confident that as you acquire proficiency with this technique, you will also be equipped to make similar improvements.