
Chapter 10
Rate of Change
On numerous occasions, I've been approached by college students who wanted to know what courses would best prepare them for a career in the stock market or the futures market. Recalling my own educational experience—liberal arts, study abroad, graduate school of business, and law school—I invariably respond not to follow in my footsteps. In the trading profession, what is most obvious is often most obviously wrong. I grant that fundamentals or the perception of them dictate the long-term trend in markets; however, over shorter time periods, the recognition of these fundamental developments might be ignored or overlooked. As a result, the price of a security may either remain dormant or contradict reason and logic. Effective market timing techniques help alert the user to the appropriate times when the price may be disposed to respond favorably or unfavorably. The identification of these precise points in time is accomplished by measuring both supply/demand and market sentiment.
My techniques concentrate on basic economics and mass psychology. Consequently, I believe an understanding of these two areas of knowledge is vital to success—the former for purpose of measuring supply and demand and the latter for evaluating the emotionalism of the market.
Of the highly educated professors you know, how many have been successful traders? I would venture to guess: not very many. Their lack of success is no reflection on their intelligence; over the long run, their fundamental expectations can make them successful investors. Short-term trading, however, is a full-time profession, and markets do not always operate rationally. In fact, my experience suggests that an inverse correlation exists between education and short-term trading success. Much of the information taught in business school is of a fundamental nature and does not address the key emotions dictating short-term price movement—fear and greed. Markets are efficient, and once information is released the discount process begins immediately defining the impact of this news. In many instances, price movements are exaggerated because of dynamics outside the arena of fundamental analysis, such as stop losses, systems' trading signals, margin calls, and so on. Consequently, the immediate price movement may contradict all logical expectations. Figuratively speaking, I have often said that price continues to advance until the last buyer has bought, and price continues to decline until the last seller has sold, and that this sequence of events accounts for perceived illogical market responses.
Many years ago, I experimented with a price comparison that incorporated market timing and market sentiment. For the most part, I applied this approach to major market indexes and to futures markets, rather than individual stocks, because the likelihood of price declining to zero was a real possibility with a stock.
Specifically, I divided the current price of the security by the price of the security one year earlier. Other time periods may work better, depending on the market, but I wanted to cover the same time periods for all markets.
From the chart prepared for each market, I can design overbought/oversold bands that have historically defined areas of low-risk buy and sell levels. For a monthly perspective, the chart is updated monthly; for a weekly perspective, the chart is updated weekly; and for a dally perspective, it can be updated daily. In each instance, however, the close is compared with the close one year earlier.
One major benefit is derived from this approach. If the market is in an oversold condition, buys based on another shorter-term system can be generated. Conversely, if the market is in an overbought condition, sells based on another shorter-term system can be generated. In any case, even as an indicator unto itself, this relationship measures the level of emotion associated with price moves and visually displays how similar movements have evolved in the past. The degree of advance or of decline can be evaluated, and the extent of movement within overbought/oversold zones can be examined and compared. In fact, price activity recorded a year ago dictates current price movement by defining extreme parameters associated with historical turning points.
Figures 10.1 through 10.15 are examples of charts used for this type of comparative analysis.

Source: Logical Information Machines, Inc. (LIM), Chicago, IL.
Figure 10.1 One-year rate of change, cocoa monthly.
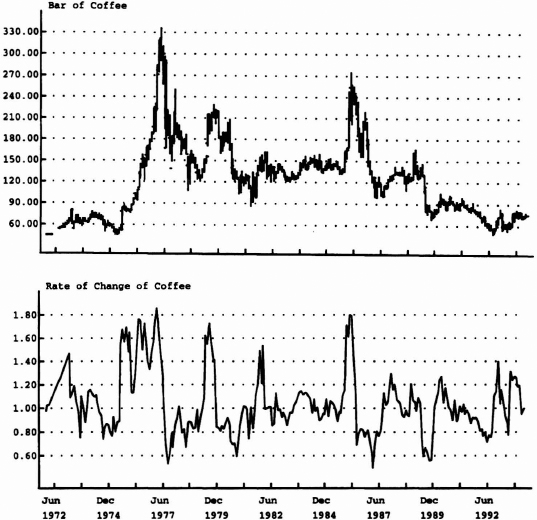
Source: Logical Information Machines, Inc. (LIM), Chicago, IL.
Figure 10.2 Six-month rate of change, coffee monthly.
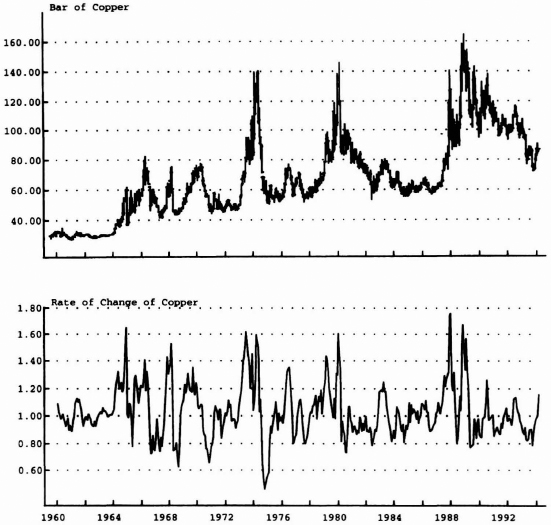
Source: Logical Information Machines, Inc. (LIM), Chicago, IL.
Figure 10.3 Six-month rate of change, copper monthly.

Source: Logical Information Machines, Inc. (LIM), Chicago, IL.
Figure 10.4 One-year rate of change, corn monthly.

Source: Logical Information Machines, Inc. (LIM), Chicago, IL.
Figure 10.5 One-year rate of change, crude oil monthly.
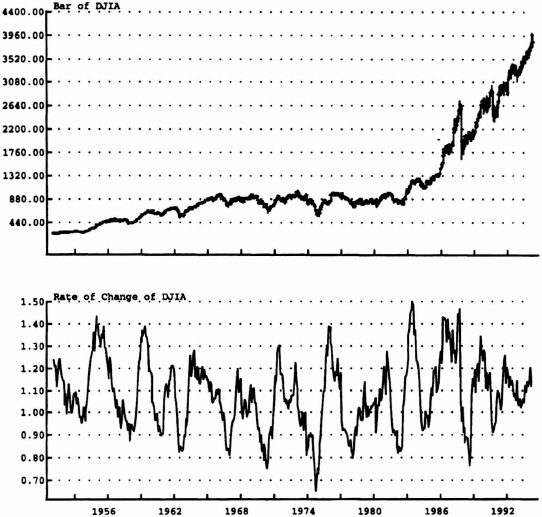
Source: Logical Information Machines, Inc. (LIM), Chicago, IL.
Figure 10.6 One-year rate of change, DJIA monthly.
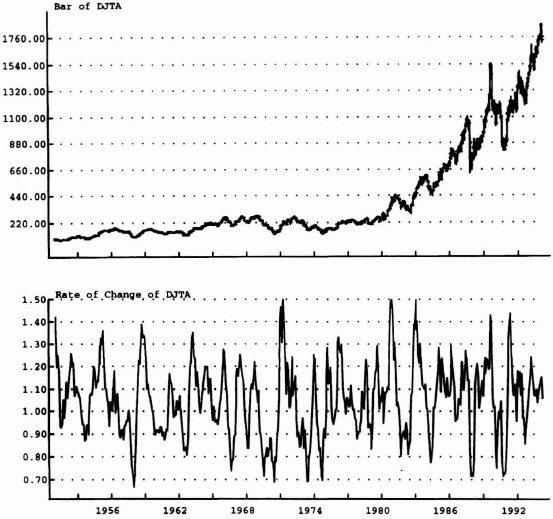
Source: Logical Information Machines, Inc. (LIM), Chicago, IL.
Figure 10.7 One-year rate of change, DJTA monthly.
Source: Logical Information Machines, Inc. (LIM), Chicago, IL.
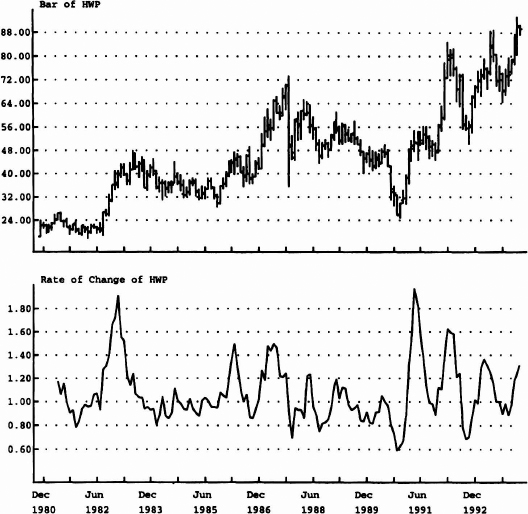
Figure 10.8 Six-month rate of change. Hewlett-Packard monthly.
Source: Logical Information Machines, Inc. (LIM), Chicago, IL.
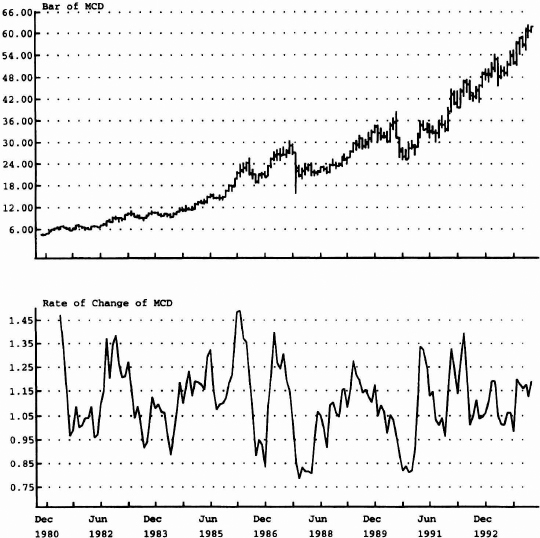
Figure 10.9 Six-month rate of change, McDonald's monthly.
Source: Logical Information Machines, Inc. (LIM), Chicago, IL.
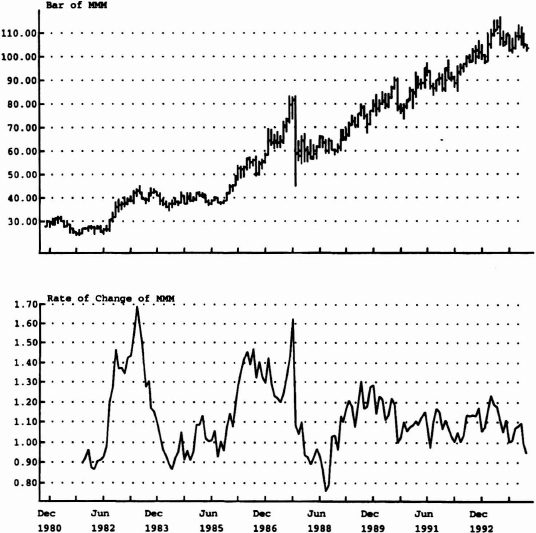
Figure 10.10 One-year rate of change. Minnesota Mining Corporation monthly.
Source: Logical Information Machines, Inc. (LIM), Chicago, IL.
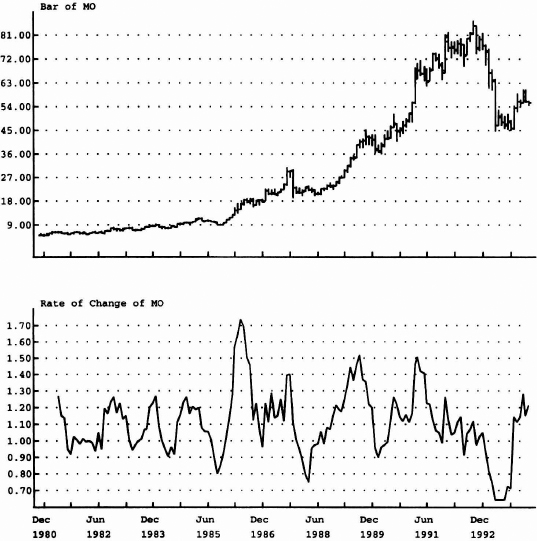
Figure 10.11 Six-month rate of change. Philip Morris Corporation.

Source: Logical Information Machines, Inc. (LIM), Chicago, IL.
Figure 10.12 Six-month rate of change, silver monthly.
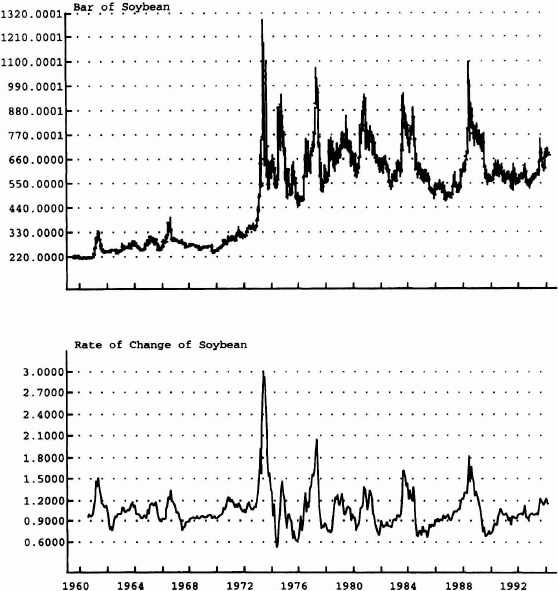
Source: Logical Information Machines, Inc. (LIM), Chicago, IL.
Figure 10.13 One-year rate of change, soybean monthly.
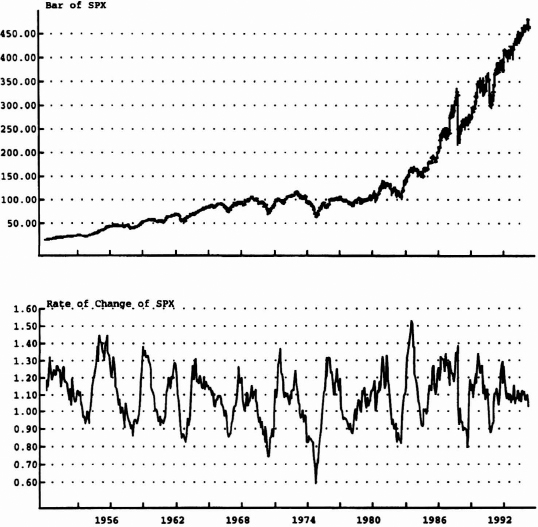
Source: Logical Information Machines, Inc. (LIM), Chicago, IL.
Figure 10.14 Six-month rate of change, cash S&P monthly.
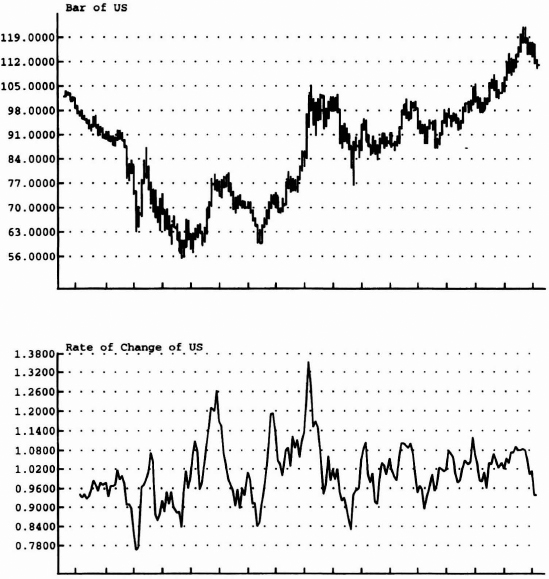
Source: Logical Information Machines, Inc. (LIM), Chicago, IL.
Figure 10.15 Six-month rate of change, U.S. T-bonds monthly.