This chapter may seem whacky to you. But it isn't. Chapter 5 expanded on how Question One helps uncover false myths "everyone" knows even though no one bothered to fact check. A curious mind is the best weapon you have—in investing but also in life. The Questions aren't just for investing. You can use them for many life decisions. For example, suppose you're embroiled in divorce. Nobody wants that. Yet it abounds. It's bankrupting—financially and emotionally. Had you used the Three Questions when deciding to marry maybe you wouldn't be so embroiled. Things may have turned out differently had you done some scientific inquiry into the person whose life and bank accounts you came to share. Let's see how that goes: What do I believe that is really false? What can I fathom others find unfathomable? What the heck is my brain doing to blindside me now? Am I suffering confirmation bias? How about illusion of validity? Am I overconfident? All the same stuff. But once you get to marriage on the rocks of divorce, you know you were really, really, really, really wrong. But I digress.
Using Question One, you discover ever more myths. More exciting, you'll find myths so broadly, irreversibly, and passionately held the exact reverse ends up being true. Where mythology is so really, really, really, really wrong—it's actually backwards—like our example of federal budget deficits leading to great stock market returns instead of disaster. You link a Question One to a Question Two and learn the exact reverse of common mythology is a bet-able truth. How cool is that? Just start with anything people are intensely righteous about. You may be labeled a heretic by acquaintances, but so what? (It's not your business what people think about you, remember?)
One reason so many investors fail is they fear asking questions that make them seem like a crackpot. Don't fear being seen as a crackpot—fear making bets based on fabrications.
Let's begin by exploring a topic sure to unite just about everyone in an appalled uproar—from the Kansas farmer on his tractor listening to Rush Lim-baugh to the tie-dyed San Francisco vegan carrying a "Bush lied!" placard.
Debt.
In Chapter 1, I showed you how the universally deplored federal budget deficit doesn't lead to poor stock returns, rather to good ones. I showed you the data—the what—but not the how and why. For that, you must understand debt and deficits better—know something others don't and see how they're used, abused, and misconstrued.
From infancy, we're taught debt is bad, more debt is worse, and loads of debt is downright immoral. It's almost biblical, our aversion to debt. For many centuries, collecting interest on a loan was considered a sin throughout Christianity—leaving money lending to seemingly shadowy social fringes. Never accused of being the life of the party, Cato the Elder equated usury with murder. Early Christianity, Judaism, and Islam all prohibited lending with interest. (Jews weren't permitted to charge interest to other Jews, while Sharia law prohibits charging interest to this day.) Modern society (well, at least, Western modern society) struggles with the portrayal of Shakespeare's Shylock. Elizabethan audiences were less fastidious—they presumed the moneylender was the bad guy.
Investors perceive our debt and budget deficit to be a massive economic drain because eventually someone will pay it back—creating a presumed stranglehold on our children, our children's children, their children, their pets, the future aliens who colonize those great-great-great grandchildren, and the cockroaches who overthrow them all—living, debt-laden, in a Mad Max post-World War III style world where there is no Kevin Costner or Mel Gibson to save us. (Oops, maybe Mel doesn't like moneylenders either.) All because of debt!
Everyone knows we're over-indebted. You read it everywhere—multiple times in multiple places—a never challenged fact. Even if our federal debt doesn't last long enough to see the deep freeze of the next Ice Age, everyone agrees someone must pay back all that moola. And when that happens, it will be heinous. Stocks can't rise into that, right? Let's ask Question One and see. Is it true debt is bad for the economy and stock market? Are we really over-indebted to the point of difficulty?
For this question, you must know how much debt we really have, properly, in scale. Then you must ask a question so basic no one ever asks it—but you will, very soon. But, first, if you hear that talking head on the evening news say the U.S. federal government has almost $5 trillion in debt,[116] you'd probably do a spit-take. Five trillion is a lot of anything in absolute terms.
For perspective, just one trillion is 1,000 billions. And just one billion is hard for our Stone Age information processors to conceive. For example, a billion hours ago, our ancestors were in the literal Stone Age. A billion minutes ago, Jesus lived. So five trillion buckaroos must be overwhelming, right? But is it bad? Most people think so. But remember the bunnies and Hummers in Chapter 3? You must think relatively and consider scale whenever you see big numbers. For that, you need an accurate picture of the U.S. hard asset balance sheet (see Table 6.1).
Unless you're a client of my firm, you have probably never seen a balance sheet for America presented as shown in Table 6.1. (This balance sheet isn't cloaked in mystery. All these data are publicly available.) It's built just like a business balance sheet totaling all U.S. assets and liabilities. It includes public and private debts of all forms and our assets. Adding up the left side—the asset line items gives the United States approximately $111 trillion in total assets. ($5 trillion immediately feels smaller, doesn't it? Scalability!) Moving to the right side (the liabilities side), we have $50 trillion in total debt outstanding. As with any balance sheet, subtract the liabilities from the assets and you get America's net worth of $61 trillion. (Note: Our balance sheet doesn't address assets and liabilities that are contractual one-for-one offsets, like life insurance policies and reserves, and pension obligations and benefits. They perfectly offset each other and therefore don't impact our analysis—nor do off-balance sheet obligations like Medicare and social security—ones easily later politically eliminated by a mere vote of poli-tics.)
Of course, $50 trillion still seems like a lot of debt, but $111 trillion in assets seems big, too. One good way to look at debt is to think of a debt-to-equity ratio—like you would for a corporation. To understand our debt and begin to understand if it's "bad," divide debt by equity to arrive at our current debt-to-equity level of 83 percent. Now we know what we're dealing with and we can ask if 83 percent debt-to-equity is bad or not (we find out later).
But a better question—the real killer question—a Question Two—is what is the right amount of debt for society to have? And how would you know it was the right amount? This is a question I've never heard asked in public or commented on—ever. It's a Newtonian-like question because at its roots are heretofore unthinkable fundamentals. What is the right amount of debt of all types for a society to have? Most folks presume less debt is better and the best amount is none. But we know that must be silly. Look at corporations. They use debt to finance their activities prudently—do it all the time. They do it to maximize their net worth over time by achieving a higher return on assets than their borrowing costs. Having no debt isn't optimal, so what is optimal? How would you figure it out? It would be an amount where having more debt would be bad but having less debt would also be bad, that is, just the right amount. No one ever thinks to ask what that level is because their confirmation bias leads them to presume less debt is always better. Maybe you do too, but you can benefit by asking Question One to see if you could be wrong. Because if you've been wrong about this, you're in vast company.
Table 6.1. Aggregate Hard Asset Balance Sheet of the United States
Assets | (billions) | Liabilities | (billions) |
|---|---|---|---|
Sources: Standard & Poors and Federal Reserve Flow of Funds Accounts (FYE 2005). Note: Other assets and liabilities considered one-for-one offsets excluded. Examples of such items are life insurance policies and reserves, consumer durables like a sofa or dishwasher, and pension obligations and benefits. | |||
Cash & equivalents | $10,224 | Home mortgages | $8,683 |
Public stocks[a] | 15,542 | Credit cards & auto loans | 2,178 |
Other corporate stock | 6,617 | Non-corporate business debt | 2,763 |
Non-corporate businesses | 9,305 | Non-financial corporate debt | 5,350 |
Fixed income | 34,625 | Financial sector debt | 12,880 |
Total Financial Assets | 76,313 | Savings/checking accounts | 11,918 |
Federal government debt | 4,702 | ||
Residential real estate | 21,648 | State & local government debt | 1,851 |
Other real estate | 13,091 | Total Debt | 50,325 |
Real estate[b] | 34,738 | ||
Net Worth | 60,727 | ||
Total Assets | $111,051 | Total Liabilities & Net Worth | $111,051 |
U.S. Income (GDP) | 12,766 | ||
[a] Market value as of December 31, 2005. [b] Excludes government-owned real estate. | |||
To find out what level of debt is correct (and what level of debt is incorrect or "bad"), we must revisit basic economics and finance theory where we learned debt by itself isn't bad, immoral, or a sign of character weakness. Debt is obviously a right and necessary tool of capitalism. And we've already defined capitalism as inherently good. An early lesson of corporate finance is how to calculate an optimal capital structure for a firm, or the right mix of debt and equity to maintain on a corporate balance sheet. If you're a CFO, you calculate the optimal capital structure for your company to capture maximum return on investment. Though this is different for different firms, and even varies sector to sector, the right debt level is almost never zero. Most firms can't maximize profit without leverage. Therefore, having no debt isn't optimal for a society. So, again, how much?
Borrowing—whether you're a CEO running a $100 billion behemoth or a mom running a 5-person household—is good if the cost of borrowing (the interest rate), after tax, is sufficiently lower than the conservatively estimated expected rate of return on a contemplated investment. I don't think you'll fight me there. The spread between the two, quite simply, is profit. An optimal ratio of debt to equity is achieved when the incremental borrowing cost just equals the incremental return on investment from those funds. The "just equals" part makes you nervous. But if I told you our widget firm had a 15 percent return on investment from widgetry, and a borrowing cost of 6 percent pretax (say, 4 percent after tax), you wouldn't be upset if we borrowed money and added on to our widget plant. You know we would make money on the spread and you'd like that. But still—"just equals" is scary.
Did you take microeconomics in school? If you didn't, it's okay. Just bear with me for a few sentences because the next few lines are for those who did. If you did, you recall in economic theory, profit maximization occurs when marginal costs equal marginal revenue (sales). You can get that from any introductory microeconomics text. I'm not saying anything racy here. One marginal cost may be interest costs from borrowing. Via what they taught you in school, when the marginal cost of borrowing just barely exceeded the marginal return generated from the activity in which the borrowed funds were used, optimization did occur. Because we would have borrowed all we could use to profit by—being maximally efficient—and no more!
The right amount of debt for society to have is that amount where marginal borrowing costs of all kinds equal marginal return on assets of all kinds. This is very simple, purely rational, and straight from economic theory. So extend that. If a society's return on assets is very high compared to its borrowing costs, it should borrow more money, invest it, and get the return on assets to make its citizenry richer. For those of you still hung up on morality and debt, richer citizenry is moral. Poorer citizenry is immoral. Got that?
When it comes right down to it—whether more debt is good or bad, or less debt is better or worse—it's all about the return on assets. If return is high relative to borrowing costs, more debt is good, less debt is bad. If the reverse is true—if return on assets is lower than marginal borrowing costs, less debt is in order. So how do we know if the United States has the right level of debt? Simple—by looking at our return on assets relative to borrowing costs. How do you do that?
To figure our borrowing costs, take a look-see at the liabilities side of our balance sheet again. You know approximately what the interest rates are on the various types of debt. The interest on home mortgages for the most part is tax deductible, so that cost is lower than you think, but it hovers around 6.8 percent right now for 30-year money,[117] but after tax, is maybe half that, and plenty of folks have a lower rate for a shorter term. Credit cards have sky-high interest rates—17 percent and 19 percent and 23 percent on balances held past the first month, but there isn't much of that! (Credit card debt as a percent of overall debt is much lower than you think—actually tiny.) When you average in auto loans, which are basically interest-free, total consumer debt isn't so high as a rate. We've discussed corporate borrowing rates in this book as well as federal debt. And intuitively, you know state and municipal debt, being tax-free, are lower rates still. Looking at all of the debt together, it's safe to assume our average interest rate for all our debts is about 5 percent to 6 percent. Give or take. And after tax it is lower, maybe 4 percent. Something like that. You will see the exact number isn't necessary for our example and lesson.
What is really important is the U.S. return on assets, but how do we figure that? It's so easy no one thinks about how easy it is to do. Just like a corporation does! Take our total income (GDP) and divide by our total assets. The most recent data shows our GDP to be about $13 trillion.[118] GDP is the right number to use because it's our national income and someone receives and benefits from every bit of it. Our income is our "return." It's no different than the income a family or corporation gets—which is how they calculate their return. When we have more income, people are better off. That, of course, is the goal. More income for more people—that's more moral. And while you don't think about it this way, GDP is an after-tax number too because taxes wash out as your income tax is still included in GDP—it's just the part our government gets. So dividing our GDP by our total assets gives us a return on assets of 12 percent.
Huh?
Allow me to relieve the suspense and point out that our return on assets is nicely higher than our after-tax borrowing cost of about 4 percent. Our return on assets is about three times higher than our borrowing costs. Hence by definition we're not over-indebted, we're under-indebted. What the . . . ? Who the...? How the...? I know. It should be freaking you out. And if our guess as to the average borrowing rate is off a bit, or GDP or total assets is a little off because government accounting is inherently sketchy—it doesn't really matter much because however wrong we are, our borrowing rate is still tiny compared to our return on assets.
First, a 12 percent return on assets is impressive—very! Second, to optimize, we need to borrow and invest somehow, someway, until we've driven our borrowing costs up or our return on assets down to where they begin to get close to each other. Until then, we need more debt. We're under-indebted. Say it after me, "We're not over-indebted and wallowing in a morass of debt; we're under-indebted and need more debt." Ouch! That hurt some of you.
We've never had enough debt. From where we are, more debt would be good, less debt would be bad. We aren't taking enough risk with debt. If we borrow a lot more, you can see how that would put pressure on interest rates, driving them up, right? And if we buy enough more assets, we will engage in ever more marginal activities and our return on assets must eventually fall. Doing the two together is exactly how you move to optimization in economic theory. We maximize profit and wealth for our citizenry when we do, and until we do we're under-indebted, suboptimal, and morally corrupt in letting down our citizenry. And you just won't believe it because it goes against everything you've ever been taught. But hang in there with me. Why? Well first, because in my head, I envision the words in this paragraph trailing off—like a Doppler effect—as you toss this book out the window of a moving car and accelerate. And second, if you haven't chucked the book yet, hang on for some fun.
First and fastest, can you see if we aren't over-indebted but under-indebted, that thought alone would be fun? We don't have to worry about that dismal Mad Max future for our descendants—and that's a relieving and fun thought by itself. Note: No one has bothered to ask if we have too little debt. And they don't because consensus mythology is so overwhelmingly pro-debt reduction. It's like some kind of sociological religion where questioning the mythology makes you a heretic. But flipping Question One on its head is about the most fun you can have in finance. Let's get really perverse: Is more federal debt actually good for our economy and stock market? How about this question: If we're under-indebted, how much more debt should we have and what could we do with it? That is the Question Two kicker part that, when answered, lets you fathom something others can't fathom. To see this, we start thinking from a corporate view and then move through individuals to government debt.
The average firm in the S&P 500 has a debt-to-equity level of 172 percent,[119] which is fully twice—more than two times higher—than America's 83 percent.[120] Some consider GE the world's best run major corporation, or for that matter, institution of any kind—or at least pretty good. As of this writing, it's the world's second largest stock. And its debt-to-equity ratio is 339 percent.[121] If GE isn't at its optimal debt-to-equity level, it's probably pretty darn close. GE and other firms, as discussed earlier, simply use debt rationally to optimize their capital structure to maximize profit.
You may say, "I'm okay with corporate debt in theory. And I have no problem if GE borrows to build a plant to make money, or corporations in general do—they're rational about their usage of it—but not for idiotic consumers or, worse by far, the idiotic government."
What you aren't okay with is a heroin addict ringing up credit card debt to finance more heroin and the purchase of Pink Floyd songs on Apple iTunes—squandering meager borrowed funds on foolery and drugs. What an idiot! Still, many of you are more okay with the heroin addict's iPod debt than our federal government's debt—because you envision the heroin addict as basically smarter, more disciplined, and a better spender than the federal government. As far as total governmental debt goes, you hate your local municipality's debt, but see them as less stupid than your state and your state is less stupid than the federal government. (Unless you live in California—then you see the state as more stupid.) Now, if you don't think heroin addicts and your government spend money stupidly, you needn't read the next few paragraphs. But I do think they're stupid and that's why I wrote these paragraphs.
To see the government's and heroin addict's debt better, let's start with corporate debt again. Suppose you're CEO of an average quality corporation with a medium grade Standard & Poor's credit rating of BBB. In mid-2006, your company could borrow 10-year money for just over 6 percent.[122] To afford this debt while generating additional income, you need a return on assets better than your net after-tax borrowing cost. Suppose you have a 33 percent corporate tax rate. Then your 6 percent borrowing cost is 4 percent after-tax. If you don't believe you can beat 4 percent a year over the long-term, you shouldn't be CEO in the first place and your board should fire you. So, if you can build a plant or launch a product or otherwise do anything yielding maybe a 12 percent return—but anything markedly higher than 4 percent—you absolutely have a moral obligation to your shareholders (and your customers and employees, in other words, everyone including the general citizenry) to borrow more and invest to create wealth. Borrowing then is good for everyone and moral and right.
Here's a good example of debt and corporate morality. Assume you're CEO and your stock has a P/E of 16, which is an earnings yield (E/P, the reverse of the P/E) of 6.25 percent. Recall, that's after-tax because the P/E was after-tax. (I hope you already see where I'm going here.) If you can borrow at 4 percent after-tax and buy back your own stock, reducing available supply, you boost your earnings per share, capturing the 2.25 percent spread as profit—getting free money for your shareholders. It's a no-lose trade as long as your earnings aren't about to fall otherwise. And if you're the CEO, who would know that better than you? Again, you should be fired if you can't do that. It's the moral thing to do. Not doing so is the immoral thing to do. But maybe not! Maybe you have higher uses for borrowed money because you can build a plant making widgets yielding 15 percent. More power to you. Do it—instead of buying back your stock. Or do both. You should keep borrowing more as long as you have abundant opportunities to make ready profit at high returns materially exceeding your borrowing costs. I'm sure this seems rational to you and somehow doesn't have the mental sting normally associated with debt in our society.
Using debt in these ways provides capital for research, development, and making acquisitions; increases shareholder value; and improves long-term prospects for the firm—we all understand that. The company in turn provides better goods and services for a more competitive price, which benefits the consumer. And let's not forget the employees who receive better salaries, health care, and other benefits because of the growth involved. It's beautiful!
Let's shift to the heroin-addicted Apple iPod borrower and the similarly stupid government. For those of you who took a college economics class, you may recall when a bank makes a loan, it increases the quantity of money. It doesn't matter to whom the loan is made. The quantity of money rises by the amount of the loan. When a bank makes a loan, it's effectively just like printing money from thin air. I'll not detail that for you here, but ask you to take it as fact. (If you want more on that, you can again check any introductory macroeconomics textbook.) Simply said, every loan has a "multiplier" effect. In America, money newly created through a new loan gets spent—changes hands—on average about six times in the first 12 months of its existence. How fast existing money changes hands is known in economics as the "velocity" of money. Again, if you took an economics class, you may remember that. But here we're talking about the turnover of newly created money—created by a bank loan.
So there is this banker who is stupid enough to lend money to a known heroin addict who is tired of his old Apple iPod and wants to borrow to buy more heroin and upgrade to an Apple iPod Nano. How dumb is that? The banker lends to him. The addict buys some heroin from his drug dealer and the Nano from his Nano dealer. The money has changed hands stupidly. Now, the Nano dealer is rational and normal. He got some of that addict's money and spends some on sales tax, some replenishing his inventory from Apple—which is pretty normal and Apple likes it—and some feeding his family in normal ways, not stupidly at all. You're used to that and that is the second spend out of six spends happening after the money was created. The money is spent four more times before the first year is out, and every time after that first stupid spend by the addict, it's spent pretty darned normally—boringly so by normal, rational people and corporations. After the stupid first spend, the next five spends end up being very average.
That money the heroin addict borrowed which didn't go to the Nano dealer went to the drug dealer. Here there is no sales tax for obvious reasons. This dealer isn't so terribly stupid or he would already be in jail. After all, the biggest single chunk of American inmates got there by being stupid drug dealers. The ones that stay out on the street are the ones smart enough to avoid getting caught. So, this smarter-than-your-average drug dealer spends some of his new money doing what the Nano dealer did—replenishing inventory (which never shows up in GDP accounting for, again, obvious reasons) and the rest supporting his family in normal ways. For example, he buys clothes at the clothes store, but then the clothes store spends it again in normal ways. And he perhaps buys some produce from the local hippie organic farmers, who spend it in fairly normal ways—maybe at the tie-dye T-shirt store. Maybe the drug dealer even has some druggie employees, so he pays for employee salaries and health insurance premiums. And this all gets re-spent afterwards pretty normally—about four more times in the first year.
When a loan is made to a person, even a heroin-addicted Apple iPod borrower, the multiplier effect assures the money gets passed on and is spent pretty normally after the first stupid spend. When someone (or some corporation—or anyone!) spends money, they can only pass it onto a few different types of recipients: a corporation/business entity, another person, a government, or a charity. That's it. Of course, people don't normally borrow money to give to charities, but it happens. The government does it all the time! But the charity then takes the money and spends it on baby formula, light bulbs, liability insurance, job training, or something. And still it ends up being spent pretty normally after the first spend.
So when the heroin-addicted Apple iPod borrower borrows and spends, it isn't as good as when GE does. But after the first spend, the rest of the spends are pretty much the same—identical in their normality. If you and I borrow personally and spend, it's only slightly smarter on average than the six spends by the heroin-addicted apple iPod borrower (maybe a part of one-sixth smarter) and only slightly stupider than when GE borrows to put in a plant for profit—the only thing different is the first spend, or maybe just part of it. Only the first spend! Ditto when the idiotic government borrows.
Just my opinion, but I do think our various governments are inherently stupid spenders on average. That doesn't make the outcome of their stupid spending necessarily bad in and of itself. Not as good as if GE were doing the spending—to be sure—but still not bad because of the next five normal spends. Mind you, if the government could be a smarter spender that would be better than being a stupider spender. But I assert, even with the government being a stupider spender, it's good, not bad, because just one out of six spends is stupid and the rest are average. The initial stupid spend by the government generates only a little less economic activity and income than when the first spend is optimally smart and efficient.
Yep! Whether they spend it on $500 hammers, bridges, dams and roads, or hard liquor for heroin-addicted Apple iPod borrowers who would much prefer heroin—no matter how stupid—still it can only be spent a few ways. It's either spent on government employees (people), vendors which are typically corporations but sometimes are people, or in transfer payments to people, corporations, charities, or another government entity. Think about that.
The only other thing they can do is spend it overseas—which isn't very different in effect than when you take a foreign vacation and spend there. That may negatively take money out of America, but if you're thinking globally like you should, you know it contributes to the global economy. Even when they blow it up in bombs in Iraq, the next five spends are normal. And when they spend it on another government entity, like when the federal government gives money to your state who gives money to your county, the same thing happens. All the county can do is the same thing—spend on people, business entities, charities, or other stupid governments. There are no other choices. Then the recipients re-spend the money five times normally and averagely.
So, if a society is under-indebted, meaning it has a very high return on assets compared to its borrowing costs as we do here in America, then society will be better off if borrowing occurs, even if the first spend is more stupid than normal—even very stupid—even completely stupid. Why? Because the next five spends will be average and the economy will benefit from those five spends that wouldn't have happened had the borrowing and stupid spending never occurred. More money being spent, exchanged, invested, churned, whatever it is, no matter how smart or how stupid the first spend is, eventually ends up being spent, exchanged, and invested in a way leading to an expanded economy, providing more wealth for more people and above-average stock market returns.
I showed you this in Chapter 1—flip back and look at Figure 1.6 again. You'll recall years following budget deficit peaks were decidedly rosier for markets than years following surpluses. In years when we run a deficit, we're adding debt while being under-indebted—getting closer to our optimal debt level. Hence, future income and wealth will be higher and the market knows that and prices it in. In years when we run a surplus, we're reducing debt when we're under-indebted and moving farther away from optimality—going backwards. The market knows that too and prices it in and the market acts badly. The market knows we are under-indebted, not over-indebted, and its response to more or less government debt—the stupid kind—is to react extremely rationally—much more rationally than your friends do. It knows more debt is good for everyone, even when it's stupid old government debt.
If you're still not convinced, let's take another look at actual stock market returns here in America following peaks in budget deficits versus surpluses by flipping back to Chapter 1 again and Table 1.2.
These facts are pretty clear. Following deficit peaks—shown as relative troughs on Figure 1.6—markets averaged 22 percent after 12 months and 36 percent cumulatively 36 months later. Surpluses and even peaks where we've gotten close to a balanced budget have had much worse results—less than 1 percent after 12 months and a mere 9 percent after 36 months. You should prefer the higher returns. But maybe not. Maybe you're French! Or addicted to heroin. Or both! At least I spared you from considering a French heroin-addicted Apple iPod borrower.
Remember always, if it's true federal budget deficit peaks signal good times for U.S. stocks, then it must be true in most other Western developed capitalistic places. And it is. High budget deficits have led to good stock returns and surpluses to poor returns in other developed economies, as you can see in Figure 6.1, which shows the same phenomenon in developed economies the world over. Deficits bring them closer to their optimal capital structure, and surpluses take them farther away.
Let's have some fun considering this yet another way and return to our original question—is debt bad? Our federal debt is the cumulative result of running budget deficits. Our state and municipal debt is similar if accounted for similarly. Let's start with the stupidest, biggest, and dumbest government, Uncle Sam, and why intuitively its deficits and, hence, debt lead to good stock returns and its surpluses are onerous. Simply think of Uncle Sam as a corporation using leverage to spur growth. No one opposes the CEO using leverage to grow. People don't picket in the streets, holding placards reading, "Our grandchildren will pay for GE's profligate debt."
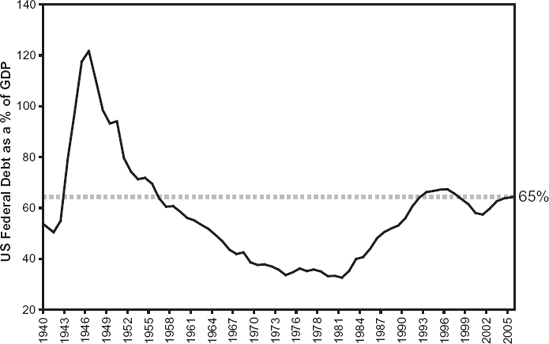
Figure 6.2 shows total federal government debt outstanding (including that held by the Social Security system) divided by GDP going back in time. Today, such debt accounts for 65 percent of GDP.
Consistent with our theory, periods following debt levels similar to today, such as 1942, 1956, and 1992, were all followed by perfectly fine stock markets and economies, so you know our current debt level as a percent of GDP isn't indicative of past problems. If we could do it then, we can do it now. In fact, our debt is a mere half of what it was in the midst of World War II, and we came out okay after that.
Flip that on its head to see that we're under-indebted, not over-indebted. Have you ever heard people talk about the famous 17 years when the stock market did so terribly from 1965 through 1981? It's very common to hear supposedly knowledgeable people claim the market was flat overall from 1965 through 1981. But that is because they're ignorant enough to use the Dow Jones Industrials Average (which we covered in Chapter 4 as a completely misleading index in terms of economic reality) to measure returns. If you use the S&P 500 as a reasonable proxy for America, it had a 7.7 percent average annual total return over those years[123]—below average for sure, but still positive and less below-average than you might have thought. Even so, for most investors it was a long—almost-two-decades-long—period of grindingly below-average returns. Partly that was because more of the return came from dividends than appreciation and it sure felt like the market went nowhere. Well, those grindingly below-average returns are exactly when we completed the process of getting our debt as a percent of GDP down to its lowest levels of your life. Reducing debt relative to the size of the economy isn't a good thing to do because under-indebtedness is bad and the market knows it and prices it correctly.
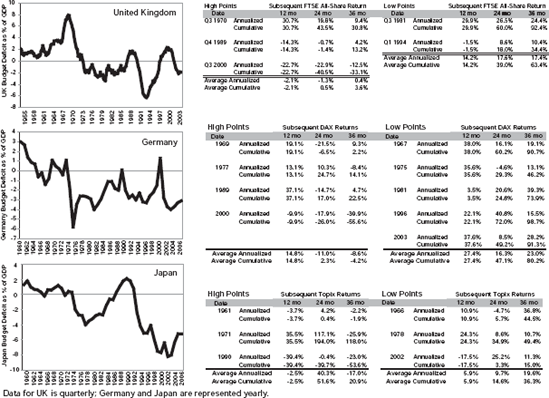
Figure 6.1. Budget Deficits Are Good for Stocks. Source: Thomson Financial Datastream, Office of National Statistics.
Has America ever had no government debt at all? You may think debt is a twentieth century creation. Many people do. But, no, we've always had debt except once, in the mid-1830s, when Andrew Jackson paid it off with gold garnered from Western land sales. For a chronicling of that mishap, I refer you to my 1987 book The Wall Street Waltz.[124] Jackson's pay-down was disastrous, leading to the infamous Panic of 1837 and the Depression of 1837 to 1843—one of the three biggest, longest, and worst Depressions and stock market crashes in U.S. history (the others being those starting 1873 and 1929). The history of paying down debt isn't stock market or economy friendly because it goes the wrong way when we're under-indebted.
Look back at Table 1.2 again (in Chapter 1) at what happened when President Clinton began paying down our federal debt. We smacked into a fierce three-year bear market—the fourth biggest in U.S. history. Ironically, we weren't the only ones doing this. Similar debt reduction was happening all over Europe then. Again, foreign activities confirmed U.S. ones, leading to the second biggest global bear market in a century and even bigger outside America than inside.
Does President Bush bother me? Of course! He's a president. He is a politic. In fact, the president is always the head tic, the one that really knows how to tic you off. So, of course he bothers me. They always do. But do his deficits frighten me? No—because I know we're under-indebted. I don't know if he knows that or not, but to markets it doesn't matter.
Still, some detractors, brain-deadened by decades of debt dread, shake their heads and worry we are greedily enriching ourselves now at the detriment of future generations who, they fear, must pay it all down one day.
Ask another Question One here—Is it true we must pay down the debt? Look at what happened before when we have. Not good! If we can afford our debt (we can) and we get a good return on assets (we do), there is no need to ever waste cash flow on reducing debt service. We simply roll over the old debt, and as we grow bigger we add more. As said earlier, being under-indebted, we should increase debt to increase net worth overall. We trust firms to do it. And even though we know our governments spend money stupidly, the multiplier effect means other far less stupid entities will do most of the spending—averaging to be not too stupid at all. The answers to our Questions here are—debt isn't bad for the stock market or the economy. In fact, it's just the opposite. Debt is good, right, and important, and we have yet to reach our optimal debt level. Federal debt in America shouldn't be feared, demo-nized, or intentionally reduced.
Now, don't get me wrong. I'm all for smaller government—and I don't like government spending at all. I'd like to see government spending as a percent of GDP shrink markedly. I already told you I think governments are pretty stupid spenders. I'm actually pretty anti-government at basically every turn, but decidedly not because it would reduce our debt! I'm anti-government because I see government as largely anti-capitalistic in most things it does and to me all good things come from capitalism ultimately. So reducing government activity reduces anti-capitalistic activity and that's good. But you didn't buy this book to get my social views.
So, if we're under-indebted instead of over-indebted, how much more debt in dollars should we have? I have no clue, only wild guesses. The answer to how much more debt we should have is that amount where our borrowing costs rise and our return on assets falls and they begin to get close to each other. But in absolute dollars how much is that? Going back to our balance sheet and noting we currently have $50 trillion of debt—I would guess we could easily handle twice the total debt we have now if its proportional makeup was the same. Twice the government debt. Twice the corporate debt. Twice the personal debt. That might move our borrowing costs and return on assets both to approach about 8 percent. But I could be way off and the right amount might be tens of trillions higher or lower. It's just a wild guess.
Still, pretend it is the right amount for a moment. Imagine what we could do if we could buy $50 trillion more assets. Now that would be fun, indeed. I won't even begin to burden you with my ideas on this—but instead refer you to the best advice I have on it. Consult Question Two and keep at it. It's tremendous fun.
Another popular myth the news media loves is the "profligate consumer." The profligate consumer image is intended to paint a picture of the typical American as fat, lazy, self-indulgently over-indebted, carelessly drowning in credit card debt, obstinately refusing to save, and constantly tottering on the verge of bankruptcy. Shame on him! This is exactly how the French see Americans. Do you and I deserve such censure? Let's use Question One to see.
Rampant credit card debt concerns should be a snap for you to debunk by now. Flip back and take a look at our U.S. balance sheet again. As a nation, we have $2 trillion in personal debt. But that line item is broken out into both car loans and credit card debt. People need cars to get to work so they can buy groceries and tube socks. And car loans are currently essentially interest-free; let's not fret about those. As always, when faced with large numbers, we must scale and think relatively. Personal debt is a mere 4 percent of overall U.S. debt. The rest is corporate debt, mortgage debt, and other forms of debt not impacting your personal budget. What's more, all personal debt is just 3.6 percent of the U.S. overall net worth. I'd hardly call that "drowning." I'm not urging you to make for your closest Neiman Marcus and max out your credit card, but you can set aside concerns credit card debt will slow our economy as just plain wrong.
But the charge that we slovenly Americans just don't save is more serious. Without savings, how can we spend, invest, and drive the economy and the market forward? The official personal saving rate, the number released by the Commerce Department, has been dwindling over the last 20 years,[125] it's true. These days—and I'm sure you've heard this as a potential sign of impending doom—the savings rate has actually turned negative, implying Americans aren't saving but dis-saving. We are unsaving! A low or negative savings rate combined with a high level of debt (in many misguided minds) eventually pushes us over the edge. And if we're not saving but dis-saving, the stock market must eventually plummet, right? If no one is saving, no one can be investing. Right? No! This is all wrong—way, way, way wrong.
Here's another chance for Question One: Is it true a low personal saving rate negatively impacts the stock market? Here's a follow-on Question Two: Is the government-calculated saving rate even important or indicative of anything at all? What's more, is it possible a low or even negative saving rate, the way it's measured, actually isn't bad but just the opposite? (By now, I hope you're seeing each Question engenders more Questions, each one giving you further basis for a market bet.)
To begin assessing the saving rate issue, use one of our favorite tricks. Think globally. While the United States has seen "saving" evaporate over the past two decades during an economic growth boom for both corporations and personal net worth, Japan experienced huge personal saving rates, but a long stagnant economy and stock market. One might conclude, just from that simple observation, something is wrong correlating saving rates with progress. Japan saves and flounders. We dis-save and prosper. What gives?
First, the personal saving data are broken and don't reflect a darned real thing. You shouldn't place much stock in government data. Mostly, governmental macroeconomic data aren't very accurate to begin with (GDP, CPI, PPI, unemployment numbers, all of them). The collection methodology and index construction techniques leave much to be desired, being primitive but including vast assumptions, gross generalizations, and accounting techniques making corporate accounting look pinpoint precise by comparison (and corporate accounting is pretty gross and inaccurate itself). They are nothing better than a blurry snapshot of reality that isn't very precise (and isn't really supposed to be), coming as announced numbers that will be revised many times and materially before being finalized—and still the numbers won't be very precise then. Reading the tea leaves of governmental economic data as they are announced isn't useful. It's harmful.
Case in point: The official saving rate is a whacko "residual" calculation—the difference between what the government deems "personal disposable income" (after-tax) and "personal consumption expenditures." Let's take a look at how this figure is derived and why it's to be derided.
First, personal income includes employer contributions for employee pension and insurance funds, but excludes benefits paid out by such funds. Retirees receive income from pensions, but the U.S. government doesn't feel like including it in their income measure. There's no rationale why this big chunk of income doesn't get included in the official saving rate—it just...doesn't. When you pay in, it reduces saving. When you get the money back, it isn't income. It's just the way they do the accounting. Weird!
Second, personal consumption expenditures include outlays for "owner-occupied nonfarm dwellings space rent." Translated into English, this is a guestimation of what homeowners would pay themselves as landlords to rent their homes. What? It's a purely fictitious account, but, for example, it "reduced" savings by $963 billion in 2005[126]—many times the cost of the Iraq war if that exercises you any. By comparison, rent paid by actual tenants across America only totaled $257 billion.[127] Since homeowners generally don't spend their incomes paying themselves rent to live in a home they own and occupy, there must certainly be more cash saving available somewhere than measured by the personal saving rate. Weird-II!
Then, most amazingly, official saving doesn't include capital gains. In America, this is how people save. As personal saving steadily declined to zero, total household net worth continued climbing to record highs. This is mainly a result of securities and real estate values increasing, making households wealthier even as government data says little or no current income is being saved. Figure 6.3 shows the saving rate decline overlapped with the growth in per capita net worth. Clearly, Americans' net worth isn't being negatively impacted by a low (or negative) saving rate. Weird-III!
Consider this another more basic way. The main way Americans "save" is through capital gains. Our largest individual saver, Bill Gates, is purported the world's richest guy—worth more than $50 billion and number one on the 2006 Forbes 400 and Forbes list of global billionaires. Basically all his worth was created by starting Microsoft, which we all know was worth nothing once upon a time and is now very valuable. According to the saving rate data, Bill Gates never saved much of anything his whole life. The only thing he may have saved, according to saving rate data, is part of the dividends Microsoft paid out and part of his (relatively) puny $600,000 a year salary.[128] The bulk of his $50 billion he never saved. It just happened. When he spends on charity, he is spending money he never officially saved. He got to be the richest guy in the world by not ever "saving." What he did was start a firm and plow back profits and cash flow into future growth (which most folks think of as saving), but because the firm did it, and he didn't, even though he controlled the firm, there was no official saving.

Figure 6.3. The Personal Saving Rate and Households' Net Worth. Source: Federal Reserve, Bureau of Economic Analysis.
I'm a poor working slob compared to Mr. Gates, worth only a bit over one 50th of what he is. But hereto, the saving rate data says I never saved either—because I took a small salary (smaller than Bill's) and plowed everything back into growing my firm. Again, most folks would consider "plowing back" saving. The government doesn't.
When someone buys a house in California in 1956 for $10,000 and holds it until 2006 when it's worth $1.5 million, officially they never saved anything. America actually saves a lot and may have the world's highest real saving rate, but because it's almost all aimed at capital gains, it never shows up in the government's whacky official saving rate. The media will never explain this to you because it doesn't make a good, bad story. Weird-IV!
We may soon see a long-term sustained negative personal saving rate as the baby boomer generation retires. This shouldn't cause alarm, nor does it mean you must earn more to make up for them. All it means is the personal saving rate doesn't actually measure what you want it to measure and it serves no purpose beyond creating the level of panic editorial boards so love. In fact, a low personal saving rate, as Uncle Sam currently measures it, seems to signal a responsible citizenry saving via capital gains. The next time you see fear of the saving rate, the fear alone should make you a bit more bullish because fear of a false myth is always bullish.
So, maybe the debt and budget deficit are okay. Maybe we even need more debt. And maybe people really are saving. But there are other headline-making, panic-inducing deficits giving investors frights—principally the trade and current account deficits. The current account deficit consists mainly of the trade deficit, so let's focus on the trade deficit first. The trade deficit was $717 billion[129] in 2005 (EGAD! Infinite gazillion bajillions!). Freaks folks out—particularly those fearful of a weak dollar. Disapproval of the trade deficit and a desire to reverse it is exceptionally widely and passionately held. You don't read anywhere that you shouldn't worry about it at all. Suggest that in public and you will be widely ridiculed. That is always a great time for a Question One. Is it true trade deficits are bad for our economy, stock market, and dollar? While we're at it, throw in a Question Two: Is it possible the trade deficit might be something good rather than bad? If so, how?
Again, here is an investing concern bred seemingly from common sense analysis, confirmation bias, and an inability to scale (all errors combatable via Question Three). A trade deficit seems to signal we spend more on imports than we garner on exports, and are bleeding money. Folks in a tizzy over the trade deficit see it like a gigantic zero sum game—if you have more minuses than pluses you lose. By that logic, a trade deficit is bad for the economy because it's unsustainable and bankrupting. If America were a gigantic hardware store, a sustained trade deficit could be bad. If everyone acts nuts, the money bolts out the door (nyuk, nyuk). You want your hardware store to sell more stuff (nuts, bolts, drill bits) than it buys (computers, employee time, Cheetos for the employee break room), else the hardware store would bolt to bankrupt.
Nonetheless, folks who think this way make several cognitive errors. First, as a general remedy, think globally. If you do, you realize trade deficit concerns are global nonsense. Note: No one worries whether Montana runs a trade deficit with the rest of America. Or California or New York for that matter. It's obviously impossible for the whole world to run a trade deficit or surplus—it balances. Among developed nations, trade deficits and surpluses aren't materially more important to the overall level of global stocks than the trade balance between Montana and New York. That's a bit hard to accept, but we'll get you there.
One key point in seeing this clearly is U.S. and developed foreign markets with whom we have deficits behave similarly. They tend to rise and fall together. Sometimes America does better. Sometimes other countries do. And that is true of countries with similar deficits and ones with surpluses. We have a big trade deficit, current account deficit, budget deficit, and debt. Some countries have none of those. Some run huge surpluses. If deficits are bad, the U.S. stock market and varying foreign markets should be zig-zagging all over the map. The United States should be down big when foreign is flat or up big. But it's not so.
Consider this—since 1926, there have been 47 years the U.S. market has been up and the foreign market has been up too. How many years has the U.S. market been down big—over 10 percent—and the foreign market positive? Not many—3 times. And in the past 25 years, when we've had our big trade and current account deficits? Never! Many decades ago the markets weren't as correlated but, in recent decades, while these deficits have increased massively, the markets have treated these different countries more similarly. When it comes to market direction, countries do a whole lot more of going the same way than not, which we can see in Figure 6.4.
Figure 6.4 clearly shows the U.S. and foreign markets moving—not iden-tically—but certainly in the same direction and sometimes the same darned magnitude.
Let's think of the logic of this for a second. Once you get in your bones the U.S. market may lead or lag the rest of the world but doesn't go a markedly different direction, you know trade balances don't matter to the global stock market. They just can't. If the deficits mattered, and we have a big deficit to the rest of the world, then why are our stock markets more correlated than not? If a U.S. trade deficit is bad for America and American stocks, then by default, a surplus should be good for America and American stocks. Fair enough? If a trade surplus is good for America and American stocks, then a trade surplus in another Western nation should be good for that country and its stocks. That means an American trade deficit, implying a foreign trade surplus, should be good for foreign stocks and the two would offset each other perfectly with no overall effect on global stocks. (Remember the U.S. market is almost exactly half the world stock market in total money value.) Make sense? People talk as if that's so. But if it were, U.S. and non-U.S. stocks would be negatively correlated, not positively.

That still assumes a trade deficit is bad for U.S. stocks, a point I'm unwilling to concede. I'm still on Question One. The logic falls apart as soon as you get to global markets. We can all agree globally, trade balances. To argue cogently a U.S. trade deficit causes the global market to fall, you must argue trade deficits are more negative than trade surpluses are positive. To date, no one has ever expressed such a notion publicly, much less the theoretical economic justification for such a notion. No one even thinks that far. They simply stop at "the sky is falling" before getting to the notion the world can't have a trade surplus or deficit.
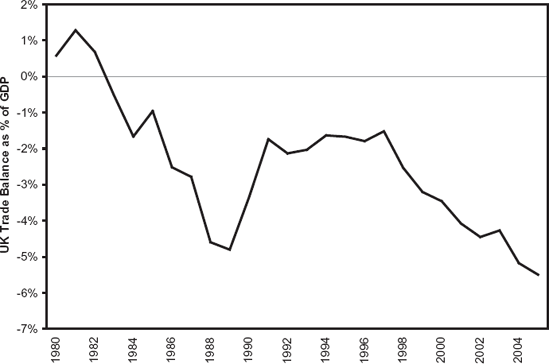
Consider our massive trade deficit and how it impacts life here. Is our trade deficit, in fact, bad for U.S. stocks and our economy? Here's where investors make another cognitive error in forgetting to scale a big number. Our trade deficit is big, but we have a massive economy too—the world's biggest. In Figure 6.5, we show the U.S. trade balance back to 1980 as a percent of GDP which is the right way to think about it. The United States has run a trade deficit the entire time—continuing irregularly to get both bigger and bigger as a percent of GDP.
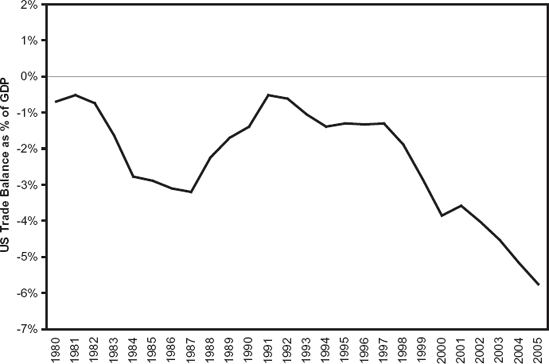
It currently is about 5.8 percent.[130] Now, a better question: Is that trade deficit too big and bad for our economy and stock market? Or, seeking a Question Two: Is a big trade deficit a symptom of a healthy economy and a sound financial system and not an indicator of future financial ruin?
Yes, our trade deficit has gotten remarkably wider since 1980. Over the past 25 years, the United States also had one of the world's healthiest economies, growing nearly the entire time. In fact, over those years our economy grew faster than almost all the developed world. Since we've been running a trade deficit consistently starting in 1980, we've enjoyed average annualized real GDP growth of 3 percent[131] and annualized market total returns of 13 percent.[132] If our trade deficit were bad, per se, our market returns should have been worse than average and our GDP growth shouldn't have been among the world's best. As such, we have an economy that is the very harsh envy of the developed world. Maybe not of privileged French students protesting in the streets for their inalienable rights to a lifelong, lackluster governmental career, but the French don't get Capitalism as evidenced by their slower, more lackluster economy over the past quarter century.
So maybe the trade deficit is something that happens as we do well. Can that be? Critics make several arguments. First, they say it hasn't hurt us yet but things haven't yet come home to roost and will, all at once, in a future big-bang financial crisis coming straight to your backyard soon. Well, fine, but at what level of trade deficit or cumulative trade deficit does that occur? To date, I've never heard such a trigger point articulated—nor, even more important, articulated with an underlying fundamental argument as to why that is where a trigger point should be. Second, some may concede the trade deficit hasn't done enough damage to make our growth negative or nonexis-tent—but they ask, how do we know what our growth would have been without the trade deficit? We might have had even more growth were it not for this damaging deficit.
For example, consider Britain. Their markets have done well. Their currency has been stronger than ours. In fact, arguably the pound sterling has been the world's strongest major developed currency in recent decades. Surely this is the proof in the pudding (the Brits love their pudding) that our trade deficits have hurt us relative to them.
This is very wrong. The U.K. is actually a litmus test for many of our own economic conditions because the U.K. has been in almost exactly the same economic situation in the same proportions in terms of deficits, trade balance—everything. They ran a trade deficit since the early 1980s in almost exactly the same size relative to their economy—which you see in Figure 6.6. Their current trade deficit (accounted for the same way as ours) is about 5.5 percent of their GDP[133]—a tiny fraction of a percent smaller than ours. And their economy and markets have been strong just like ours. The British stock market has averaged the same annualized 13 percent return since they started running a trade deficit in 1984.[134] Coincidentally, their economy has also been healthy, annualizing 2.7 percent GDP growth per year over that time period—just a whisker lower than ours (see Figure 6.6).
Other British deficits as a percent of GDP are similar but their currency is stronger. What gives? What does that tell you about trade deficits? It tells you they don't impact currencies. If pound sterling has been strong, and trade deficits impact currencies, how can their trade deficit, which is comparable to ours, be good for the pound sterling but ours be bad for the dollar? Critics may say, "That's just this year's deficit." Look at the charts again. You see the progression is similar. What you can't eyeball is if you take America's cumulative trade deficit over all these years, you get $5.096 trillion. Divide it by our $13 trillion economy and you get 39.2 percent. Do the same for Britain relative to its economy and you get 38.8 percent—statistically identical. You simply can't argue the size of our trade deficit relative to our economy is too big causing the buck to fall here while arguing their almost exact same size trade deficit relative to their economy now and cumulatively over time has somehow allowed the pound to be strong. Only a fool would go there. Is something else causing the relative strength or weakness of our currencies? Sure—but that is for Chapter 7. This litmus test is never contemplated by grumpy trade deficit bears.
Think about this yet another way. If a trade deficit is bad and a trade surplus is good, we can settle the question just by looking at examples of developed countries with big deficits and big surpluses. Without analyzing anything further than which country you'd rather be, look at Figures 6.5 and 6.6 again, both showing countries running "big" and growing trade deficits. Would you rather be the U.S. and U.K. with big and growing trade deficits but robust GDP and strong market returns over the past quarter century? Or, would you rather be a country with a steady surplus? How about those clever Germans—responsible for driving machines par excellence and punctual trains. They have run a trade surplus for the past 25 years (see Figure 6.7).

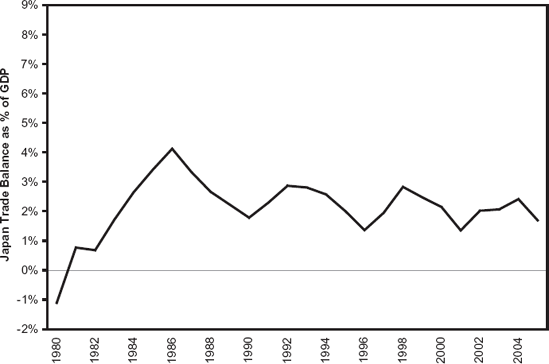
Unfortunately, their vaunted trade surplus has been paralleled by a notoriously sluggish economy and a stock market that has slightly lagged the world's average. And poor Japan! Their big trade surplus over the past 25 years hasn't helped at all in getting their economy or their market to do as well as global averages (see Figure 6.8).
So, who do you want to be? Would you rather be the countries with the trade deficits and the zipping economies and above-average market returns? Or do you want to boast a trade surplus and desolate growth rates? All but the irrational would opt for the deficit and growth. Again, our trade deficit is a symptom of our economic vigor and rapid growth, not a political problem to be tackled. Those who think otherwise are ignorant.
Circle back to the current account deficit, which as we said earlier, includes and is largely comprised by the trade deficit. If you can't worry about the trade deficit driving stocks and the economy down, you really can't worry about the current account deficit either. But people will.
Most of the logic we used for trade deficits applies equally—there can be no global current account deficit. What's more, by definition, the current account deficit is self-financing. The current account deficit is the complement of the capital account surplus. Much of the confusion over the current account deficit is because the cause and effect of balance of payments are often wrongly reversed. The current account doesn't drive the capital account. America doesn't "import" capital to "fund" the trade deficit. Rather, foreigners voluntarily (yes, voluntarily) choose to invest in U.S. securities and other forms of direct investment (because of our above-average growth and abundant opportunities compared to most of the rest of the developed world). This capital inflow invested in America and American securities, caused by foreigners, on balance perceiving better investment opportunities here than abroad, caused America to spend on overseas goods and services, adding to the trade deficit and creating the other side of the current account deficit. This allows you, me, and Joe Sixpack to buy more foreign products—creating the offsetting current account deficit. It balances, and there is nothing alarming to worry about here. The scary part is how few can see the simple beauty in this.
Note the real problem: the trade surpluses in Germany and Japan and many European nations. Why do they have them and why is it a problem? It must be a problem because the countries with trade surpluses have had markedly slower growing economies than the countries with trade deficits. Why? Before capitalism evolved in America and Britain as a dominant means of the creation of goods and services, mercantilism preceded it. People forget about mercantilism. Find a basic economic history text and read about it. My personal favorite fast read on all this is Douglas C. North's, Growth and Welfare in America's Past (Prentice Hall, 1966), but from his references you can find many other sources. Real capitalism first reared its head just as America was birthing. Recall Adam Smith's legendary The Wealth of Nations, the very most seminal book on capitalism, was published in the year of our nation's birth.
Mercantilism operated then to a more extreme extent but much as Japan and Germany do now. They deploy government-based economic throttles to purposefully create trade surpluses on the theory surpluses should help their economy. They think just like those who think our trade deficits are bad. They think trade surpluses help and deficits hurt, so they purposefully manufacture trade surpluses by constricting consumption governmentally and pushing exports. But forcing policy through an economy to create anything at the expense of freer markets and purer capitalism leads to sub-optimization and slower growth. Always! Why? To maximize growth, you must let capitalism run wild. Positively amok! That is the basic economic lesson of the past 200 years. Deficit bears are too clever by half with their views of good and bad and can't get the beneficence of Adam Smith's invisible hand. They want to interfere—with a policy hand that gets in the way and simply stifles growth. Bet on capitalism and growth, not on mercantilism and trade surpluses. Our growth creates the capital flows sustaining our trade deficits; as long as we continue to grow rapidly, our current account and trade deficits will remain high and we will remain happy. If our growth slows or ends, our twin deficits will too. That is all there is to it.
Summing up, in using Question One with a Question Two follow-up, we've learned debt and the triple deficits—the budget, trade, and current ac-count—aren't the negatives most people would have you believe. There is no actual evidence, other than mythological babble based on wrong-headed thinking, to support assertions deficits and debt will impale our world. In fact, nowhere will you hear or read a good trigger-based explanation of what the various deficits and debt are too high in relation to. When you hear drumbeats warning of market decline and worse because of a "too large" or "unsustainable" deficit or debt or both, know that fear of a falsehood is bullish—always. You can bet against it driving the market down. Keep that in mind, because deficits and debt frequently recycle as reasons for bearishness.
You should fear any effort to force a reversal in these deficits a la mercantilism—usually from senators. And you should fear surpluses. Repeat after me, "I would prefer not to see budget, current account, and trade surpluses in America. I would prefer to see rapid growth and deficits." Say that at your next cocktail party, and someone may throw a drink in your face. First, that reaction tells you this truth still has power and legs. Second, hey, free drink!
For another Question One myth and reverse truth, consider William Jennings Bryan. Remember him? The Populist with the booming voice and his famous "Cross of Gold" speech and his indifferently supported campaign to move to a silver standard as 1900 approached?
America abandoned the gold standard in 1971, but a new standard has arisen—the widespread belief gold is the ultimate portfolio hedge. In 2006, you heard endlessly that gold is up when stocks are down, and vice versa. Common advice urged holding some gold in your portfolio as a good hedge against downside volatility. A long-held derivative is gold will protect you when capitalism inevitably fails. Something like that!
Hand-in-hand with that myth is the view gold's price is a reliable inflation indicator. Rising gold prices should signal bad news all around for stock investors because stock prices will drop and rising inflation will stagnate growth. But is it true? The love affair with gold comes and goes, but naturally intensifies if gold prices do well for a while. If gold prices rise fast, like in 2005 and 2006 (to 25-year highs!), inflation concerns reach a fevered pitch and investors fear for stocks.
Gold, like any freely traded security, has its own heat chasers. As an ounce of gold rose to $500 then to $600 then to—gasp—$700, suddenly folks who didn't even think about it when it was under $300 needed in. Gold-investing products naturally followed, as did Las Vegas-based gold investing seminars and gold coin TV advertisements. Own a piece of history! Protect your loved ones with real gold coins stamped with scenes from the Wizard of Oz! (Did you know our friend William Jennings Bryan was immortalized in that beloved movie? Check out my following commentary on the Wizard of Oz.) You needn't even buy the commodity itself to cash in on gold fever. You could buy gold mining shares, limited partnerships in mining-related REITs, or open a dental franchise doing vanity work on rap stars. If you're a newsletter subscriber, you probably receive direct mail admonitions to load up on gold because most of them sell their subscriber lists to each other, including all the gold newsletters.
The gold hedge belief, like many entrenched investor beliefs, appeals to our common sense. Gold is a commodity—it has weight and heft and you can see, feel, and take possession of it. Stocks are slips of paper—nowadays barely even that—you get an e-mail confirming you own a piece of a firm changing in value constantly. It seemingly makes sense two such different asset classes might behave differently. And because of prior long history of the government pegging currency value to gold, both here and globally, there is sentimental value in owning gold.
But is it right? The more I hear old, long-held governmental policies paralleling our faith in gold, the more skeptical I get—particularly when I remember gold standards started during mercantilism's reign.
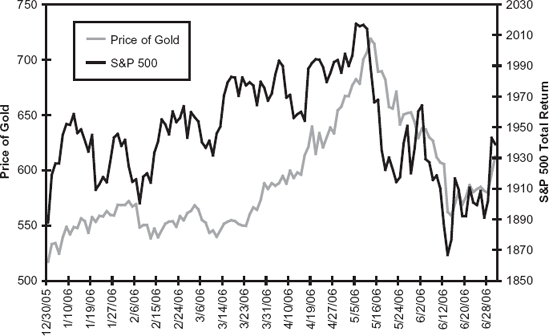
Use Question One. Is it true gold makes a good hedge? If gold is a great hedge, it should be negatively correlated to stocks. Think short and long term. As these words are committed to paper in mid-2006, we just had what is probably a pretty normal global stock market correction. I say "probably" a correction because the drop, starting May 9, 2006, was sudden and sharp, unlike a rolling, grinding bull market top. But regardless, the global market fell 10 percent—and as that happened, if gold were a proper hedge, it should have continued to rise as stock prices dropped—or at worst, remained flat. Figure 6.9 shows the price of gold and the S&P 500 from the beginning of the year to mid-2006.
Clearly, gold isn't doing what hedgers expect. Over this time period, gold is correlating strongly with the stock market, not the reverse. The market is declining sharply, and so is gold. If you hoped to protect yourself against downside volatility with gold, you're instead getting it double. It moves with the market and is just about as volatile as the market. Plus, if you're buying an asset near historic highs when nearly everyone you know is uniformly enthusiastic about it, you're likely committing a whole host of cognitive errors.
If gold doesn't make sense as a security hedge, could it make sense as a long-term investment? Even though gold is at 25-year highs, on an inflation-adjusted basis, the returns have been miserable. Stocks clearly have been a better investment over the past 25 years. The story is the same going back to 1926. Investing in gold beats stashing greenbacks in your mattress, but can't compare to stocks or even bonds. That is really hard for a gold bug to swallow. Even some cash equivalents do better over the long term. The current gold hype is nothing more than some run-of-the-mill heat chasing brought on by a Stone Age mentality. Gold may continue to climb, it may not, but the odds are you aren't well served using gold as a hedge or as a long-term investment if any kind of growth is your goal. To do well with gold, you must be good at in-and-outing. If that is your plan, you should ask yourself, if you're not good at in-and-outing stocks, why will you be with gold? The answer, as with all other things, comes down to the question: Do you know something others don't about gold.
Gold could serve a useful purpose if its price can tell us something about where inflation is headed. Look at Figure 6.10, which shows gold and S&P 500 prices since 1926. Gold has been practically flat, adjusting for inflation. If gold appreciates basically at the rate of inflation, maybe it's predictive of inflation—it's plausible. Voices abound saying it is so and that runaway inflation is ahead because gold is up.
Except Question One shows us this is a myth, too. Inflation is a monetary phenomenon relating to how tight or loose monetary policy is—caused and controlled by central bank actions. Inflation occurs when central banks create more money than society creates goods and services. Inflation isn't necessarily bad. Few fear very low inflation rates and everyone fears high ones.
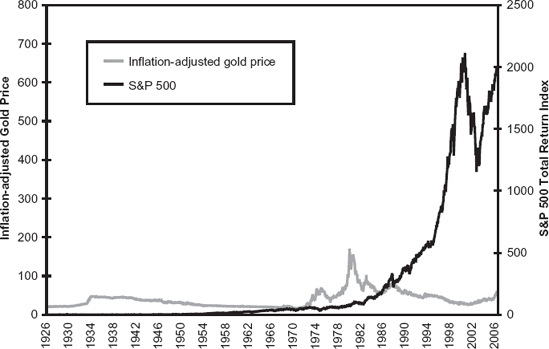
Figure 6.10. Price of Inflation-Adjusted Gold and the S&P 500 (1926-2006). Source: Global Financial Data.
Runaway inflation, such as in the 1970s, is a problem, which no one disputes. It's easiest to think about runaway inflation on the extreme end. Recall Germany's Weimar years in the early 1920s. The central bank was so loose, printing so much money—money became worthless. Germans burnt money as fuel because crates of their valueless cash couldn't buy coal or even wood. And before too long the Nazis took over, so you know hyperinflation isn't so good. But low inflation levels aren't scary. Which would you prefer, modest inflation or modest deflation? Probably inflation, though statistically they are two edges of the same sword. Deflation, made by creating less new money than new goods or services, causes prices to drop and can lead to problems, including massive unemployment and depression. No fun!
So what does all this have to do with gold? Nothing. Gold is a commodity and is traded on a free and open market. Inflation is a monetary phenomenon, as Milton Friedman once famously said, "Always and everywhere." Just because gold has appreciated at roughly the rate of inflation, you shouldn't conclude gold can tell you where inflation will go. It should tell you over long time periods gold investors get pretty darned low returns—which is what you should intuitively expect from most commodities. Easy as that!
But the perception remains a rising gold price is indicative of increasing inflation. Look back at Figure 6.9. Gold (and the S&P 500, too, but never mind that for now) climbed as did the histrionics regarding inflation. Then, the price of gold dropped. If it's true rising gold signals increased inflation, then dropping gold must signal disinflation (the slowing of the rate at which prices rise).
Officially inflation was perfectly unremarkable in 2003, 2004, 2005, and 2006. So for years, gold has been up and official inflation moderate. Some will tell you official inflation figures don't correctly reflect inflation and we come back to that. Most gold fans will tell you big inflation must be right around the corner—gold's rise tells you so. Will runaway inflation become a reality going forward? Maybe, maybe not, but gold won't tell you either way. We're certainly less likely to see monetary policy errors on the magnitude of the 1970s and prior periods due to advances in theory, accumulated experience, and technology. But that doesn't mean inflation can't and won't occasionally reach dis-ruptively high levels. But how can you know if that might happen? Having cleared up the gold myth, you can use Question Two to figure out what is a better indicator for inflation. This one is really simple.
This Question Two requires a Question Three reminder to think globally. But first, let's think about what inflation is and isn't quite literally. It isn't what is happening to your cost of living, which people often confuse with inflation. Inflation is an averaging of prices of all types of newly produced goods and services whether you buy them or not. It isn't about the price of gold or any other commodity. It isn't about the price of art collections although they may or may not move speculatively with inflation. It isn't about the cost of used cars although used car prices may be impacted by inflation. It isn't reflective of wages although wages are part of what it's about. It is an averaging of all goods and services produced and, in that regard, is simply a reflection of the change in the value of money to buy the average item.
Maybe some prices are going up a lot and some a little—some down a little, and maybe some down a lot. Gasoline up a lot. Health care up a lot. Electronic gadgets down a lot. Brokerage commissions down a little (a service). Shoe prices down a little! In a perfect world of zero percent inflation (correctly calculated), it isn't true all prices would remain flat and unchanged. No, in such a world it would be true half the prices would be rising, half the prices falling and some doing both more than others.
Older Americans who pay for lots of health care and their grandchildren's private school and college educations often presume inflation is rampant and our inflation indexes are massively off and understate inflation. I hear that from individual clients all the time. They confuse what they buy with inflation. I'll not defend the inflation indexes because as said earlier, pretty much all government economic indicators are very inaccurate. I'll teach you a better way to see inflation. But whether the Consumer Price Index reflects inflation correctly or not has nothing to do with whether the items you buy are reflective of the average items produced and therefore reflective of inflation. They aren't. Few people experience an average experience. Consumer buying habits are very diverse. It would be bizarre for a very young person to buy a similar basket of goods as an elderly couple—and again different from a middle-aged one.
Take this further. In 1900, most of what you might buy was made in America. In today's more global world, much of it comes from here, there, or anywhere. Much of what is made in America is only partly made in America. Today, higher prices on one type of good from one country may be wholly or partly offset by lower prices on another type from another country. Today inflation takes on global aspects. During the past 15 years, we saw American inflation while Japan and much of Asia felt deflation because they created more goods than they created money, and the type of goods they created were often prone to falling prices. But still, within their deflation, some prices would rise, others would fall and others would go down even more. Inflation as a concept is always an averaging. Japanese deflation then, including the prices of goods created there and sold into America, helped keep American inflation down to lower levels than they would have been otherwise via substitution. At one level, we partly exported inflation to them and they partly exported deflation to us and both partially offset the other.
So if what you buy isn't necessarily reflective of inflation, then what America averages isn't necessarily totally reflective of inflation. One way to think better about inflation is to try to see it globally. Thinking globally, you worry less because globalization can reduce country-specific inflation effects. Global competition leads to ever-increased specialization of labor and technology, and short-term excess production capacity in one country offsets shortages elsewhere. American prices for many goods and services subject to foreign competition are actually falling. Everyday items from tube socks to toys to cars to sundries are cheaper today than just a few years ago, adjusted for inflation. This is a lost story because rising oil prices make for better television. The media had consumers so focused on the higher price of crude and steel they didn't notice the cars they were fueling up were actually cheaper. A cheaper car is as much a good thing as higher gas prices an annoying thing.
But is there something that can signal if inflation is rising? Well, it can't be your buying habits. It can't be Montana's buying habits. It really shouldn't even be America's buying habits. What it should be is something measuring the value of money spanning the whole wide global world because that is what inflation is all about. Use Question Two to ponder, what is a good measure of the value of money? What is the price of money today? What is its price tomorrow?
Well, we know for a fact we can borrow money today so we can have it tomorrow. We know what the rent is for that borrowing. In the long term, the price of renting money is what we otherwise call long-term interest rates. The 10-year Treasury bond rate, for example, is one way to measure the cost of renting long-term money in America.
From a lender's view, money rental is very vulnerable to the ravages of accelerating inflation. Lenders want to be paid for higher inflation and higher inflation risk by getting a higher interest rate. America may not exactly be experiencing the world's buying habits, but global long-term rates react to global long-term inflation fears. Therefore, global long-term rates are most sensitive to changing inflation expectations. For this, I refer you back to Chapter 2 where we introduced to you the concept of global short- and long-term interest rates. The global long-term rate we showed you (which can be constructed on your own with GDP numbers and interest rates from Bloomberg.com or Yahoo! Finance) is a perfect way to see if global inflation is rearing its ugly head or not. As of this writing, it quite clearly isn't. If inflation is rising as a problem, global long-term interest rates must rise. If it is falling as a problem, global rates will reflect that. Remember, the global interest rate is the price of renting money. Figure 6.11 shows the global free market measuring precisely the problem of concern—the total global or country-based value of money. That global long-term rates have been benign in recent years tells you inflation hasn't begun to rear its head in a materially increasing way. That U.S. rates are up a little over the past few years tells you it's a little problem here but much of that is offset overseas. You just fathomed something most can't fathom. More important, we can see historically the long bond has been sensitive to inflation concerns and is a good measure.
Beginning in the 1980s, Figure 6.11 shows central banks steadily gained the upper hand against the 1970s war on inflation with help from free trade and globalization. This in turn caused global long rates to fall from historically elevated levels. In 2005, the 10-year Treasury yield was just returning to historical averages after a multidecade inflation shock.
Maybe you don't remember it that way. Figure 6.11 certainly makes it look like all the 10-year rate has done over the long term is fall—with a little wiggle en route. How could that be predictive about inflation at all? What's more, in recent years, professional forecasters have tended to believe this 25-year downward trend will reverse. Except, flipping back to Chapter 4, you know the professionals keep getting their long-term bond forecasts wrong as well. What we have been experiencing hasn't been an unusual falling period, but a return to historical normalcy. Figure 6.12 shows long-term U.S. interest rates going back—way back—to 1800.

Figure 6.12 puts long-term rates into perspective. First, investors tend to talk about today's 10-year Treasury rate as "historically low." No! The long bond rate during the 1970s was "freakishly high." Investors may be frustrated they can no longer buy Treasury bonds with a 13 percent coupon as they did when they were young in the 1970s, but they fail to remember stock market returns were dreadful then, the economy was stagnating, and inflation wiped out even super-high coupon payments. Save your 1970s nostalgia for the Bee Gees. Okay, I take that back.
Second, the long-term interest rate spike clearly correlates with the onset and recovery from horrid monetary mismanagement and resulting 1970s hyperinflation. Why? Because the long bond is traded on a free and open market and accurately represents the market's true inflation expectation. Don't focus on short rates—remember, they are monopoly set by the central bank. Long bond interest rates aren't controlled at all; instead they are perfectly free market set. And that reflects the market's expectation for the quality of the job central banks are doing, and is a great indicator, at least for right now, of where the market is pricing future inflation risk.
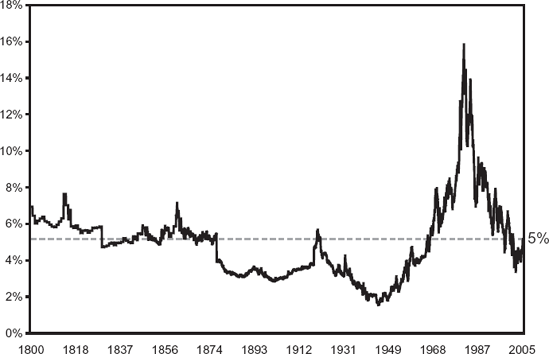
Now that you're getting the hang of asking Question One and debunking myths, you can move on to finding new or ignored patterns that will give you a basis for market bets using Question Two. More examples in Chapter 7.