This book is partly about how to know something others don't—by processing information others find unfathomable and creating capital markets technology to do that. If information can't be processed well by our brains one way, reframe it in another more useful way like our P/E to E/P flip. Cut it in half and look at it anew. What does it correlate to?
The news is full of useful information if you can use Question Two to connect the dots. Just be creative and ask, "I wonder if that could mean anything? Wouldn't that be nuts?" One recent phenomenon, starting in 2002, is increased merger and acquisition activity. It's normal for merger and acquisition activity to increase in an expansion. Firms with improved balance sheets awash with cash look to acquire additional valuable market share, parallel product lines, vertical integration, new core competencies, new product categories, or just simply to diversify. In one way, this is unremarkable and mundane.
But can it mean anything for the stock market? Conventionally, market lore says merger manias lead to poor stock market results. Partly that is because mergers happen after the economy has been improving for a while—and after that, at some time, comes another recession. So, it's easy to see why folks see merger manias leading to bad times. Look at the late-1990s mergers coinciding with the tech IPO craze. After a wave of deals like the Time Warner takeover of AOL, we were rewarded with a severe bear market and recession.
It makes sense takeovers should backfire often. After all, sellers, knowing the business inside out, usually know more about what they sell than buyers, being outsiders, know about what they buy. So shouldn't it be true buyers fare less well than sellers—arguing for lower prices later when reality sets in and the buyer and its shareholders realize they've been fleeced?
I made this point in my second book, The Wall Street Waltz. And I was wrong. Historically, there is some validity to the argument, but I put too much emphasis on some time periods and not enough on others. My conclusions were too dependent on takeovers of the 1920s and late-1960s. There was a lot of unintentional data-mining and confirmation bias in what I said then. Now I'd say I was wrong then, and the whole thing is very 50/50. It depends on the nature of the deals involved and half are this way and half that way—and it varies with time.
There was a crucial difference in how most of those 1990s mergers as well as the late-1960s and 1920s deals were structured compared to the post-2002 deals. The bulk of corporate mergers taking place in 2003, 2004, 2005, and 2006 were mostly transacted in cash, whereas those done in those three earlier periods were transacted mainly in stock. In the one, an acquirer pays earnest money for the shares of the acquiree; in the other, the acquirer simply issues newly created shares to fund the takeover. Question Two: Is there a difference between the two and their potential impact on the stock market? What can you see differently about this situation others don't see? What can you fathom that is unfathomable to most?
When Company A buys Company B for cash, it exchanges the cash for Company B's shares and then simply destroys those shares. After the deal, there are the same number of Company A's shares as before the deal and no shares for Company B. Company A now has its earnings and Company B's earnings so Company A's earnings per share rise. Very simple! This assumes on an annual basis Company B is profitable and its earnings exceed the interest payments Company A pays to borrow the money to buy Company B. But otherwise, the acquisition is immediately accretive to earnings—shares are destroyed and, all else being equal, the acquirer's earnings per share rise immediately. The supply of equity outstanding in this case is reduced as the acquired company's stock is destroyed. Let me say that again. Cash-based acquisitions reduce the supply of equity outstanding. If demand remains constant and supply shrinks, prices will rise. Cash-based acquisitions tend to be bullish.
Takeovers transacted wholly in stock are different. Afterwards, usually the acquirer's earnings per share fall because more shares are dumped on the market, diluting value. See it this way. Firm A is worth X. Firm B is worth Y. To acquire Firm B, Firm A must bid up B's price. Perhaps Firm A bids Firm B up by 25 percent to 1.25Y. That extra 25 percent is paid for by increasing the supply of stock of Firm A—newly created, never before existing shares. Firm A issues enough new shares to cover all of the prior value of Firm B plus enough newly created shares to cover the 25 percent markup. So, there are more real share equivalents after the deal than before. Now, if Firm B has a higher P/E than Firm A at 1.25Y, Firm A's earnings per share fall when the deal is done. This is most of the deals in the 1920s, late-i96os, and 1990s. It is the AOL Times Warner deal. These increase supply of equity, are dilutive, and make earnings per share fall.
There is a third type of deal—Firm A buys Firm B partly for cash and partly for newly created shares. Hybrids deals are common, having some of the qualities of both but usually are more cash-like than a pure equity deal. Why? In these deals, usually the acquirer can't borrow enough cash to take over all of Company B, so it borrows what it can and issues shares to make up the difference. Usually, these are bigger deals.
Suppose Firm A is worth $10 billion and B is worth $20 billion. A buys B. The smaller A swallowing the bigger B may frighten lenders. Maybe lenders will only lend Firm A $14 billion to buy B—exactly why doesn't matter for this example. Before the deal there were $30 billion of equities outstanding representing A and B together ($10 + $20 = $30). To buy Firm B, Firm A bids B up 20 percent to be worth $24 billion. It uses the $14 billion it borrowed and issues another $10 billion of its own newly created shares to total the $24 billion it needs. At the end of the deal, there are $20 billion of equities—down from $30 billion before the deal. The supply of equity shrank by $10 billion—not by as much as if they'd financed the whole thing with debt—but the equity supply shrank nonetheless. Almost always a stock and cash deal reduces the supply of equity and is accretive to earnings—just not as much as pure cash deals.
These aren't radically new ideas. Anyone who took accounting or perhaps Economics 101 in college (meaning lots of folks) should know the difference between accretive and dilutive. What's more, you can easily monitor which firms are doing takeovers and which ones are dilutive or accretive. In our über-regulated business world, we get plenty of notice when a company launches a merger, acquisition, IPO, new stock issue, a global plot to steal oil—you name it. We know when the mergers are taking place, for how much, and in what form.
Merger manias financed by newly created shares increase the supply of equity and are bearish. Merger manias transacted for cash destroy stock supply; reduced supply means prices should rise, which means time periods following increased cash merger activity, other things being equal, should see perfectly fine stock returns. But few people see the difference.
Before tackling what you can know about the impact of cash mergers on the stock market, we must delve into what really drives stock prices. This combines Question One and Question Two. There are countless myths regarding what people think cause price movements you can debunk with Question One. But Question Two—what can you fathom about what causes stock prices to move that others cannot fathom—is easy. Way too easy for humans to want to fathom.
There are just two factors in this whole, wide, wonderful, and whacky world driving stock prices. Always and everywhere, stock prices are derived singularly by shifts in supply and demand. I've said so throughout the book, but sometimes the easiest concepts are the toughest for human minds to accept. Supply and demand are commonly known concepts, but few investors make the cognitive leap to securities pricing. Most folks who took college economics forgot about supply and demand as fast as possible after finishing finals, and never thought about securities prices in terms of supply and demand. Folks with PhDs in economics were trained but usually not in securities prices, and decades later don't think in terms of supply and demand for securities.
Myriad brokerage firm "research" reports tell you where they see the market going but almost never based on analysis of supply and demand shifts. Your news anchor, poli-tic, stockbroker, or tennis partner wants you to believe it's any number of economic or technical indicators, pop-culture concerns, political conspiracies, or self-fulfilling prophecies driving stock prices. Go to your favorite finance web site and you'll see:
Interest Rates Buoy Stocks
Jobless Report Drives Stocks Down
Oil Scares Spook Stocks
You never hear a talking head say, "Supply of stocks remained stable today, but demand increased for reasons we can only guess about, causing stock prices to rise." It's boring. Supply and demand of stocks as a storyline doesn't sell advertising or influence you to a particular side in a political, social, or economic feud. There is no reason why media would be so understated. These two dueling pressures set prices of all we buy. Seeming pressures, such as increased regulation or an alien space invasion, are just more forces on supply and demand—an alien invasion likely decreases demand for equities and increased securities regulation likely decreases supply of equities.
Supply and demand shifts explain why people eagerly pay extraordinary amounts for an original Beatles vinyl, an original Le Corbusier chair, or for a limited edition Star Wars poster—if those things float your boat. However, no one pays up for plain old paper clips. First, there are billions of paper clips floating neglected in office desk trays everywhere. Second, if you run short and don't feel like a run to your local Office Depot, you can use a binder clip or even a rubber band in a pinch. That's called substitution. Things with easy substitutes never command premium pricing like those that can't be replaced. Third, paperclips are easy to make. Unless Andy Warhol bent a particular paperclip into a reasonable rendering of Marilyn Monroe, a paperclip won't fetch much of a premium.
In college economics, your professor should have told you supply and demand are both about eagerness. Eagerness is emotional. Demand describes how emotionally eager consumers are to buy something at varying prices. Typically, but not always, at higher prices, consumers want less of something than at lower prices. Makes sense! Alternately, supply is a concept depicting how eager suppliers are to generate output of some good or service at varying prices. Generally, but not always, suppliers want to produce more of something at higher prices than at lower prices. If the price is low enough, they won't want to produce at all.
It starts getting interesting when either producers or consumers become more eager to supply or consume at the same prices. If producers become more eager to supply—meaning supply increased—but consumers aren't any more eager to consume, the market floods with supply and prices drop. You say, "Why would suppliers ever do that?" Maybe new technology cuts their costs and prods their eagerness—sort of like Moore's Law pushed the semiconductor learning curve to lower prices for decades, making electronics firms ever more eager to make more at lower prices. On the flip side, if consumers become more eager—meaning demand rose—but producers don't step up supply to match increased demand, prices rise. Straight-forward.
Eagerness to buy or eagerness to supply can shift for psychological reasons deriving from any number of factors. After all, eagerness is an emotion and emotion is psychological. And markets are psychological. All I've said on this is pretty much a simplification and summary of what you would hear in any economics class—nothing remotely controversial.
But supply and demand are a little different when it comes to securities in several ways. Unless you did very unusual work in graduate school, you never saw any college study of supply and demand for equities. Demand for equities is about the eagerness to own or not own existing securities. Do we want to own GE stock more than we want to own a bond or an Andy Warhol Marilyn Monroe paperclip? Has that changed for some reason? How do we feel about owning GE stock versus Pfizer? The aggregate emotion of demand for equities can shift within the bandwidth of our human emotion very quickly and freely in just the same way tempers can flair or a movie can suddenly make you cry or laugh. Witness this by watching the volume of daily shares traded. In our super-connected world, people can become worked up and decide to buy or sell, and within moments complete a transaction. If their eagerness waxes or wanes, they can nearly instantaneously act in massive volume. They can completely reverse course hours, days, or months later if they are so inclined—emotionally.
Demand can shift fast, but only as far as people can become emotionally eager or un-eager. See it like this—you can only be as angry as you get or as happy as you get and you can quickly swing from one extreme to the other in the right circumstances, but at the extreme only as far as you go personally. Someone else might get a lot angrier than you do or a lot more giddy. Maybe you suffer depression. Some people do. Others don't—ever. Maybe you're manic depressive, heaven help you. Maybe you're very steady rolling—maybe too much so and your spouse complains about that. We vary a lot individually but overall as a group we're average. For people as a whole, total demand only shifts within the average bandwidth of our aggregate emotion, although it can do that quickly—nearly instantaneously. Think how much emotion shifted in the hours after 9/11. Hence, demand has a tremendously powerful effect on pricing in the short-term because it can shift so fast. It has less power in the long term because it can only shift within our emotional bandwidth and not further. It can only go so far.
Think of this differently. It's hard for you to keep your emotions at extreme levels for long. This is why most folks can't stay extremely angry or giddy very long. It's just like that super party when you were 23 on a warm summer night where you had a few drinks and the right friends and circumstances—it was just perfect—and you felt perfect. But the next day you felt tired. Things scar some of us sometimes and as individuals we never get over them. As we live life, those things have changed us. But newly changed—for good or bad—we only get so high or low. Altogether, when we get very angry or very ecstatic, we tend not to stay that way too long because there is too much energy exerted in staying away from our emotional norm. Shifts in demand tend to be forceful, fast, not too far, and then revert to the mean with time. This is part of why demand shifts impact short-term pricing so much more than long-term pricing.
Shifts in supply are different. In the short run, the actual supply of securities is almost completely fixed as it takes time and effort and a cooperative multiplicity of players to create new shares or destroy existing ones. Think about how long IPOs or mergers—or even just a debt offering—need to evolve, and the amount of advance notice the companies are required by law to give the public. An increase in supply technically means increased eagerness to supply equities. But initial eagerness is dampened early on because no one is actually sure if the deal can be pulled off. There is no assurance all the necessary pieces will come together for that offering—a process which will take many months if it happens at all. You can't be overly eager about something you know may not happen. Eagerness on a deal grows over the time period in which the deal is successfully pursued.
Take a new stock offering or IPO, which you already know means "initial public offering" or as I call it, "it's probably over-priced." Or a debt offering. When a company decides to issue stock or debt, they first must find an investment banker to manage the process. That alone takes time, particularly if they create a competition between several investment banking firms, which is common. At this point, the potential issuer doesn't know what the deal might look like, if they will go through with it, if they can go through with it, or even when it can happen should they be willing and able to do it. The investment banker will require freshly audited financials from a major auditing firm—typically one of the "Big Four"—also taking time. Then, in an equally uncertain process in a debt offering, the investment banker works with the issuer to secure an adequate rating from the three main rating agencies: Moody's, Standard & Poor's, and Fitch. Also in parallel, they start the filing process with regulators who must approve the offering—from the Securities and Exchange Commission (SEC) federally down to the state regulators in every state where the issue is to be sold (or appropriate regulator overseas such as the Financial Services Authority [FSA] in Britain). Then, they market the deal, which takes another few months. It's only toward the end of that process the issuer has any real sense of how eager they can be to offer the securities or not.
Maybe by the time all this is done, the market has faded. Maybe it's fading throughout the marketing process. Maybe a similar competitor got to market two months ahead of you, beating you to the punch and sapping demand in your category of offering. Plenty of deals get pulled at the last minute. Think how depressing that can be.
Under the best of circumstances, when the stars align, this is never a speedy, painless process, allowing you to assume supply is pretty well-fixed in the short-term. Conversely, no matter what anyone would have you believe, no one has any way to predict supply in the far distant future. This is among the reasons why long-term mechanical forecasting notions are usually way, way wide of the mark. No one knows what whacky things may happen to the creation or destruction of supply of equities 5 to 20 years from now. If you hear someone forecasting stocks to be a good or bad investment over the next i0 or 20 years, you're dealing with someone who is telling you more about what they don't know about how capital markets work than what they do know.
Stock prices 10 years out will be determined more by what happens to supply 7, 8, and 9 years from now than anything else. No one in 2007 has any capital markets technology or know-how allowing them to predict such a thing. In general, stocks are more positive than negative. Beyond that generality, no one should make a forecast for more than 12 to 24 months ahead. Said alternatively, shifts in demand are often more powerful in the short-term and shifts in supply are regularly more powerful in the long term. Sometimes you can see shifts in demand others don't see—justifying a 12 to 24 month forecast. But longer than that, you're just peering into fog. In the very long term, demand will bounce from very low to very high many times, but supply, subject to fundamental forces, can be almost infinitely bullish or bearish if the right conditions exist to increase new supply or destroy it.
Because supply of securities is relatively fixed over the short term, all you need do as an investor in most times is measure demand. Figure out the direction of demand and you've figured out how to make a short-term forecast. (Usually—sometimes you must account for supply—we get to that later.) That is something your fellow investors probably aren't seeing clearly, and something you can know they typically don't. And they won't just because I wrote this book. Set aside everything else—what you hear in the media, what you hear from friends, what so-called experts tell you about technical or fundamental investing—and focus on what impacts demand. For this, the Three Questions are handy. There are three broad forces at play impacting investor demand—economic, political, and sentiment.
SUPPLY AND DEMAND CURVES
What I'm going to show you now pretty much no one in the world has seen. It's a fun, activity-filled way you can demonstrate for yourself the power of supply and demand on security prices. The following figure on the left represents supply of equities and the figure on the right represents demand:
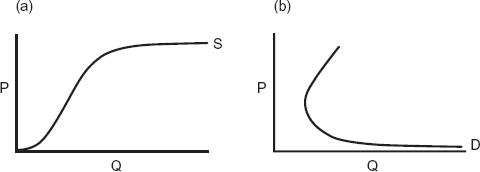
The supply curve is S-shaped, showing an increase in aggregate supply as prices increase. When prices are very low, supply tends to be low. And why not? This is like anything else. When prices (P) are low enough, firms won't want to issue new shares. If you were a CEO, you wouldn't be eager to issue new shares at four times earnings (an E/P of 25 percent) when you could always borrow money much cheaper than that. Conversely, above some break point, the higher the price, the more securities a firm would like to issue. Why? As the price rises, the cost of raising capital gets ever cheaper in direct proportion to the stock price increase. At a certain price level, suppliers would offer virtually infinite quantities of shares—as firms have an endless, infinite desire to issue more shares if their cost of capital is effectively zero. Think of a firm with a real P/E of 1,000 (an E/P of 1/1,000)—an annual cost after tax of 0.1 percent. At that cost of capital, why not issue infinite shares? You do so—buy a Treasury and make your earnings per share (EPS) increase almost infinitely. So, the supply curve flattens as it runs out to infinity along the quantity line (Q).
The demand curve is a backward-bending hyperbole. If you study economics, they never expose you to backward-bending demand curves until graduate school, if then. At one extreme, when the price of a stock is low enough, quantity demanded becomes 100 percent. Think of a corporation already in bankruptcy that you could buy for $20. I don't mean $20 per share—I mean the whole firm for $20. Since a corporation can't pass losses onto to its owners like a general partnership, you have nothing to lose by buying the whole outfit. Anyone in their right mind would buy the whole thing. You can control it if you want, ignore it if you want. If something good comes of it, you make the profit. If nothing good comes of it—no skin off your nose. How about at $25! You would buy that, too, just be out one more beer at the end of the transaction. As the price climbs, you would still take over the whole company, with slightly decreasing eagerness as the price rises. At a certain price, everything gets rational. The higher the price, the less you want, just like they taught you in college. When the price rises 20 percent, you still might like the company and be eager about it but not as eager as you were at the lower price.
Suddenly, above a certain price, weird things start happening. This is where a value company stops being thought of as a value company and starts being thought of as a growth company. Now the higher the price, the more prestige associated with owning the stock. The more the stock goes up, the more eagerness there is for it, and the quantity of stock demanded at any price rises. This is Microsoft throughout the 1990s; Yahoo! in 1999. This represents euphoric demand, something like what we might see at a bubble's peak. Instead of growth stocks, some call these "glamour" stocks—as prices rise, demand also rises because of the glamour. value investors view this as irrational. For example, from 1995 to 2000, prior to the tech bubble bursting, increasing demand occurred for tech stocks as prices rose. Qualcomm, Amazon, eBay, and all the rest—they were stocks investors felt they just had to own, and the higher the price, the more they felt it. The same is true of Google more recently. It's within this realm a bubble forms—higher prices actually lead to a higher quantity demanded.
Try this exercise. Copy each curve on a separate piece of near transparent paper, making them the same scale. Lay the demand curve over the supply curve, lining up each axis. The intersection of the curves represents current pricing, and you should get something like the figure below:

Remember when you were in college and they did those stick drawings of supply and demand? An increase meant the whole curve moved to the right, a decrease to the left. The shifting to the right—an increase in demand—meant that at every price people were eager for more. A decrease in demand meant a shift to the left where at every price people were less eager for the item. An increase in supply meant a shift to the right so that at any price suppliers wanted to supply more (maybe because of new technology or changes in laws). And a decrease in supply meant the whole curve shifted to the left, reflecting suppliers less eager at every price. So play with the curves you've drawn just like that and weird things pop out.
Slide the demand curve just a skosh to the right, representing an increase in aggregate demand in the short run. This leads very logically to higher prices. Move the curve back a bit to the left (decreasing demand) and prices fall. Now move your demand curve far enough to the right so the supply curve passes the inflection point on the demand curve and begins to run up the backward bend of the hyperbole. As this occurs, the supply and demand curves seemingly overlap for an extended series of prices, leading to nonlinear pricing. The price explodes upward. In this overlapping area, momentum investing quickly becomes glamorous ("glamour" stocks) and prices increase dramatically—just as many of those dot-com stocks did in 1999.
If you move the demand curve back, even just a bit to the left, reflecting a slight decrease in demand, or the supply curve to the right, demonstrating an increase in aggregate supply, you can see how quickly a glamour stock can fall out of favor, leading rapidly to lower prices. Just as fast as it went up. Recall again just how quickly the hot dot-com stock prices imploded in 2000. This is exactly what was happening. The increase in supply overtook demand in this same region causing the bubble to burst and then demand fell, driving tech through the floor.
Playing with the graphs in this way shows the naturally occurring decrease or increase in prices for stocks or categories of stocks as a result of shifts in supply and demand. Repeating this simple exercise whenever you see seemingly weird price action will help you understand it. In the short term, demand has the most influence on pricing, while over the long term, pricing is almost completely a function of supply. Play it and see.
Phenomena like GDP growth, corporate earnings, technological innovations, budget deficits, monetary conditions, and the like are economic drivers. Except for technology, none of these things actually directly impact the health of companies or the value of stocks themselves. Just because the United States is enjoying a period of strong GDP doesn't mean a given company is any more or less productive or valuable. And a company may experience a normal, cyclical lull in earnings while creating an innovative product and new and better management—making it more valuable. If GDP is growing at a fast clip and corporate earnings are beating expectations, people usually feel more positive about the economic future and more inclined to take on equity risk (unless they think everything is too good so it must get worse—which happens sometimes). If the economy is in recession and CEOs are being perp-walked to the curb, investors will be less keen on the stock market.
Investors get in trouble here because either they or their information source misinterprets economic news. What's more, investors focus on known information. If a surprisingly good unemployment report comes out, it's too late for you to act on it. The market moves ahead of or simultaneously to news—good and bad—but not after it's disseminated.
Elections, shifts in political control implying new future legislation impacting the tax code, and the like are examples of political drivers. Recall from Chapter 2, the threat of material new legislation, particularly any threatening property rights, may cause widespread loss aversion and fear of political muggings. Politics have more impact on market risk aversion than even their narcissistic little brains can fathom.
Sometimes it has nothing to do with legislation. When Ronald Reagan started his "Morning in America" ad campaign, he may not have appreciated he was advertising America to America. The ads worked marvels, making Americans feel better about our country and boosting sentiment. From there it was a hop, skip, and a jump to Lee Greenwood's 1984 music hit, God Bless the U.S.A., which did the same thing. Sometimes all it takes is a good stump speech to be a political driver.
Generally, capital markets fear change, which is why the presidential term cycle capital markets technology works. The market is never sure if a poli-tic is a zealot, a phony, a genuine phony, or just a moron. Usually the best thing, politically, is gridlock, as we saw in the mid- to late-1990s, because it implies little change. The markets doing so well from the November 1994 election into 2000 with perfect gridlock isn't coincidence. The market wasn't worried about much legislation getting passed by a Republican Congress with a tiny majority and a Democratic president embroiled in multiple scandals and obsessed by polling numbers.
A Question One political myth you already know you can make a market bet on is the belief (by many) that tax cuts lead to budget deficits, which are bad for the economy. The Op-Ed pages and media commentaries are full of otherwise rational people advancing their political agenda by making you believe tax cut-based deficits rob the government of desperately needed capital to run the government correctly, which leads to recession, bear markets, high unemployment, and dashed hopes. Nonsense. Those folks don't understand what we covered in Chapter 6—deficits have generally and measurably resulted in zippier GDp growth and strong stock market returns. Most important, the government doesn't run anything very correctly—regardless of whether you have a Democratic or Republican Congress or administration—or as President Ford once said, "If the government made beer, it would be 50 bucks a six-pack and taste bad."
The third driver, investor sentiment, is pure emotion. Sentiment is constantly moving—weekly, daily, even second to second. It's everything else that impacts investor's feelings. In many ways, it isn't any more complicated than that party we mentioned earlier. It got you feeling great. The next morning you didn't feel great. The day after that you'll likely feel better. It is partly that we can't sustain our emotions at extremes for long, as mentioned earlier. But we can artificially push them there temporarily.
When headlines are most dour and your friends and colleagues are bemoaning how terrible things are, you can be confident they will feel better later and sentiment will improve. Those who were most worried and sold their stocks low with hindsight bias gradually regain confidence and begin buying again. An initial reaction to higher prices is glee. You get pulled back to the middle of your emotional bandwidth by fear of heights. New higher prices scare people. Since they didn't expect stocks to rise as much as they did, they now fear they may fall. Since investors fear losses more than they enjoy prospects of gains, this creates rising anxiety. This is the proverbial "wall of worry" bull markets climb. The higher it goes, the more angst those who didn't predict it feel. Since they didn't see why it should go up, they can't see why it shouldn't go down. Since they hate losses much more than they like gains, the fear of downside dominates.
A good illustration of this is the first-year returns following a bear market. When people assume they face the most market risk, they miss out on a remarkably low-risk period. First-year returns following true bear markets are super above-average, as shown here:
Table 7.1. Stock Market Returns Following Bear Markets
Bear Market Bottom | S&P 500 12-Month Returns from Bottom |
|---|---|
Source: Global Financial Data. | |
July 8, 1932 | 171.2% |
March 31, 1938 | 29.2% |
April 28, 1942 | 53.7% |
May 19, 1947 | 18.9% |
June 13, 1949 | 42.1% |
October 22, 1957 | 31.0% |
June 26, 1962 | 32.7% |
October 7, 1966 | 32.9% |
May 26, 1970 | 43.7% |
October 3, 1974 | 38.0% |
August 12, 1982 | 58.3% |
December 4, 1987 | 21.4% |
October 11, 1990 | 29.1% |
October 9, 2002 | 33.7% |
Average | 45.4% |
The reason the bell curves I showed you in Chapter 4 worked for equities is they're a good measure of sentiment. The bell curves showed where sentiment was at a point in time, not where it was going. If you know and accept that, you can game the future direction. For example, in the late 1990s, the forecasting consensus wasn't bullish enough. Markets came in high because demand was too low and had to move higher. The bell curves were a good capital markets technology innovation for measuring investor sentiment.
Supply is like an unending accordion that can be expanded or contracted continuously. Other than what the market can bear, there is no limit to how many shares may be issued in IPOs or re-issues or how much debt can be raised if underlying economics justify it. Or how many shares can be bought back and destroyed through stock buy-backs or cash-based takeovers.
When there is sufficient incentive to flood the market with new supply, prices will eventually drop, overpowering any demand. This is how it works. Take a hot sector, like tech in the late-1990s. As prices appreciate rapidly, everyone wants in on the action. Suppose Firm A makes a novel product and has a total private market value of $1 billion. It floats a hot offering at a high price raising lots of money while giving up very little control of the company—they raise $250 million but only give up 20 percent of the company in newly created shares to do so. The prior existing 80 percent of the shares remain as previously held. Effectively that values Firm A before the money at $1 billion. With the money the deal is completed at $1.25 billion. The founders and other shareholders who initially had private stock of questionable liquidity now have a public security with a daily price making them multimillionaires. They're happy. The investment bankers are thrilled with their 7 percent of the $250 million—$17.5 million in fees!
Eager observers watch the postoffering price rise and hope the market can handle an offering from another similar outfit. So they find an entrepreneur and venture capital and create privately held Firm B, which is a Firm A look-alike. They get their investment banker to take Firm B public to get in on the cheap money. Maybe they have just a plan and no revenue, like many of the 1990s dot-coms. If B's offering goes well, someone else will attempt it with Firms C, D, E, and even F. This can go all the way to A-2, B-2, C-2, and on.
Firm A now realizes, as the high-quality, granddaddy of this product line, it can raise more capital with more newly created shares. It senses it can garner premium valuations over the group of inexperienced newbies and wannabe outfits. This time it raises another $350 million, but only gives up 17.5 percent of Firm A in newly created shares. Now Firm A is valued at $2 billion.
Now Company X, a mature, boring firm worth $100 billion, decides it can't take the risk of not being in on the hot new product category. They initiate a hostile takeover bid to acquire Company A for $3 billion, paid for with new Company X stock. Company A shares disappear and are replaced with new Company X shares worth $1 billion more than the $2 billion Company A previously had been selling for. Again, Company A shareholders get rewarded but, suddenly, there are a lot more newly created shares. Earnings are the same as before. This, like most stock mergers, was dilutive to earnings. It's the same amount of earnings but many more shares. All the IPOs and new issues start flooding the market with shares in the hot category. Eventually, supply drowns demand and prices roll over. If demand drops, prices implode.
Just as they did when the tech market crashed close on the heels of the tech-IPO craze in March, 2000.[136] Demand fell all the way to the market's ultimate global double bottom in 2002 and 2003.[137] The scapegoats were many for the tech bubble. People blamed tech companies for being overvalued. I'm not sure what that means—companies are worth what people pay for them at a point in time. If investors pay a high price for a dopey outfit with no discernable business strategy, that's the investor's fault, not the company's. Greedy CEOs got their share of blame, too. Corporate accounting rules were deemed too lax or not expansive enough.
The reality was the tech bubble burst because the market was inundated with supply and demand couldn't keep pace and then fell. That is the only explanation. Some would blame investment bankers, but that isn't fair or appropriate—no matter how you feel about them. Investment bankers simply respond to investor eagerness for more supply (demand). The real culprits (say it with me) were investors' overconfident brains, letting them run rampant and overallocate to a sector. Investors were too eager—demand was too high. Absent their demand, investment bankers and issuers can't flood the market with supply.
You should pretty much always be wary about excessive euphoria regarding IPOs in the latest "hot sector." Every time we see a hot sector—throughout the entire history of investing—investors claim, "It's different this time." It's never really different this time—just the niggly details. There is never anything different about an inundation of supply surpassing demand and causing prices to drop. (For more evidence on how it's never different this time, see the following reprint of my March 6, 2000, Forbes column "1980 Revisited," calling the top of the tech bubble due to parallels to the 1980 energy bubble.)
Forbes, March 6, 2000. Reprinted by permission of Forbes magazine. © Forbes, 2006.
Supply of stock can increase infinitely (which wouldn't be so good for stock prices in the long term) but may also be reduced when a company, thinking its stock is too cheap, uses cash to repurchase its own shares. Through stock buy-backs, as discussed in Chapter 6, and cash-based takeovers as discussed earlier, supply can be destroyed nearly infinitely. Using Question Two, we know cash-based merger manias should be followed by good stock market returns. If demand remains the same (or even greater) but supply is reduced, prices must rise. What does this mean for you right now in 2007? Because stock destruction has been occurring on a large and sustained scale, this should be bullish as you position for 2007 and possibly 2008 if supply doesn't start growing again. Whereas cash takeovers were less than a $1 billion a year in America in 2002, by 2006 they were running at more than a $50 billion a year. Outside America it was bigger still. All else being equal, massive reduction in supply should help drive demand and stock prices up. Naturally, it won't be your only bullish factor—but it might be a major counter to any bearish concerns.
Suppose you didn't buy this book in its first printing—how does knowing this Question Two truth help you? Simply keep in mind the difference between equity-based (dilutive) and cash (accretive) mergers. Are there a lot of IPOs hitting the market, and on average more equity-based mergers taking place? That's a potentially bearish concern. Conversely, lots of cash mergers probably present a little-noticed bullish surprise—news most investors don't process correctly because they don't know how.
Knowing increased cash-takeover activity leads to better stock markets helps you forecast the broad market's direction. But does that provide additional insight into which sectors you should overweight, and which individual stocks you may want to buy? Abso-positive-alutely! Look at the sectors where the mergers are occurring and work your way, top-down, to a good buy-out target. If you're right on a few of your buy-out targets, you get a nice price bump if (and when) the merger is announced. It's easy, free money. (If you're not sure how to do that, the following gives you ways to identify buy-out targets and a few examples.)
Categorically, you know the bulk of cash-based deals will occur with stocks that are cheap in terms of having a high earnings yield compared to the acquirer's pretax cost of long-term borrowing. Suppose the average company borrowing rate (the BBB 10-year bond rate) is 6 percent and the average corporate tax rate is 33 percent. The after-tax average cost of borrowing is therefore 4 percent. Takeover targets will tend to have earnings yields greater than 4 percent after they've been marked up with a maybe 25 percent pricing premium. Hence, most takeover targets will have an earnings yield above 5 percent before the deal is announced, translating to a P/E below 20. To get the acquirer's earnings per share to rise the most from the deal, the higher the earnings yield the better. Most cash-based takeovers will tend to be value stocks with low P/Es (high earnings yields). Seek those kinds of stocks to capitalize on cash-merger mania.
Supply and demand being the only determinants of stock pricing—and the potential to create or destroy new shares being nearly infinite—is why no correctly calculated index, size, style, country, or category is better for all time. (Remember our graphs in Chapter 4?) While collectors of a particular category type (small-cap value, large-cap growth, Japan, bio-tech) believe the category they like is permanently better, it isn't and can't be.
But when an equity category collector tells you his or her category is permanently better—and they do all the time—you're being told what the teller doesn't understand about markets. Supply creation is infinitely elastic if given enough time in the right circumstances. And demand bounces constantly in the short to intermediate term. There is no evidence supply of any equity category is capped, can't be bought back and destroyed, or is in anyway predictable in the long term. Consider this—if there is a demand for a category, the investment bankers will meet it—they don't care about investor perception about a particular category needing to be superior over time.
Since 2000, small-cap value has been hot. I'll give you a simple tip. Whenever big-cap growth does lousy, small-cap value does well—they are polar style opposites. Saying one does well is the same as saying the other does badly. Nowadays, there are many investors saying small-cap value is permanently better. I started doing small-cap value stocks three decades ago, long before the word small-cap value existed. My first book Super Stocks (published in 1984) was about PSRs—but specifically how to use PSRs to find small-cap value stocks others couldn't find. Even then the term small-cap value didn't exist. The term evolved in the mid-1980s off the heels of that earlier period as small-cap value stocks did well. A period much like the past six years.
In 1989, when Callan Associates, a major consulting firm to institutions (primarily defined benefit pension plans), introduced the very first small-cap value peer group for institutional investors to use in calibrating how well or badly a given manager did, there were only 12 of us included in that initial group. They couldn't find any other pure-play small-cap value managers. That was how primitive this category was not quite 20 years ago.
Today my firm still manages well over a billion dollars in the category for large defined benefit pension plans, endowments, and foundations. It's a perfectly valid part of the market to include in a much broader portfolio (which all these institutional investors have). But the category has times when it shines, and times it's a real dog. Folks forget that—many who should know better.
One of America's top scholarly minds, a novo-unabashed small-cap value fan, penned an opinion article for the editorial page of the Wall Street Journal published June 14, 2006. He stated emphatically small-cap value is better for all time based on long-term history. Wrong! Small value's supposed long-term superiority is somewhat of a data mine. It's in the data, but isn't harvestable in a real sense, as I showed you in Chapter 4. You can go through periods long enough to lose your mind where small-cap value is the worst performing part of the market—decades. If you must wait two decades for superiority, there isn't really superiority.
Despite the period from 1928 (which is as far back as small-cap value has been measured) demonstrating small-cap value stocks doing better than large stocks or the whole market,[144] most of that small-cap return came from terribly tiny stocks—ones too small to own without having a very illiquid and risky portfolio. No one ever mentions that. Also, these companies had much higher bid-ask spreads in early history. Back in the 1930s and 1940s, the bid-ask spreads of these tiny stocks were often 20 percent to 30 percent of the purchase price and those spreads aren't adjusted for in the calculation. Doing an in-and-out ate up most of the return just in the give-up between the bid and ask—all unaccounted for transaction costs.
I'm not arguing against owning small-cap value, or for owning big-cap, or the market as a whole. I'm saying there are painfully long stretches when things seeming to work in the very long-term don't actually work. And these times are too long to not drive everyone, including you, nuts. For periods of 5, 10, or 20 years, it will be shifts in supply determining most of the return of the market and of the subsets of the market. In the very long term, and lots of subsets thereof, all major categories, correctly calculated will have very similar returns. Falling in perpetual perma-love with some category won't get you superior perma-future return.
Can what you know about supply and demand be applied largely to any freely traded security category? Sure. We can apply it to the dollar and discover still more unnoticed Question Two investing truths (while dispelling more myths).
The poor U.S. dollar has been much maligned in recent years. It has been weak, so goes prevailing wisdom, and will lead to our economic undoing. Views down this line are near-religious in their conviction. Investors forget: In the late-1990s, we were all concerned a too-strong dollar would keep foreigners from wanting to trade with us, leading to our economic undoing. Following that logic, what doesn't lead to our economic undoing? Maybe there is an optimal exchange rate with every other world currency we should aspire to achieve. I don't know what that exchange rate would be or how we'd endeavor to maintain it in a free market. And I'll take a free market over a government jigger any day of the week or year of my life. But investors must think such a state of jiggering perfection exists because they love to complain about the dollar and its direction leading us to hell.
Warren Buffet is well-known for betting against the dollar. Unfortunately, his dollar timing hasn't been terrific on average. Mr. Buffett is a super smart guy, but forecasting the overall market, interest rates, commodity prices (yes, make no mistake, currencies are commodities)—none of these are his greatest strengths, nor does he have any special training in them, nor has he done very well forecasting them. In a Fortune magazine article on November 10, 2003, Mr. Buffett warned our trade deficit would cause the U.S. dollar to weaken (forever) and wreak irreparable harm to our economy.[145] Clearly, he was wrong for the intermediate term. As we covered in Chapter 6, our trade deficit is growing, not shrinking, yet we've enjoyed impressive average annual real GDP growth of 3 percent since he made his doomsday proclamation and have had positive market returns since the latest recovery began way back in 2002. And while the dollar was weak in 2004 and 2006, it was as strong in 2005 as it was weak in 2004 and 2006 put together. From January 2004 through June 30, 2006, the trade-weighted dollar is down exactly 1.96 percent,[146] hardly enough to get excited about or trade on in any regard. It just hasn't done what Buffett divined.
By now you know from Chapter 6 that big trade deficits are symptoms of strong economies and don't cause weak ones—so, they don't have much to do with making the dollar strong or weak. Here's a Question Two: Does a weak or strong dollar even matter? Pretty hard to fathom that one, huh? Though the dollar is a monetary indicator, it qualifies as an economic driver of demand. Knowing where the dollar is headed and how it can impact the stock market can be valuable if you fathom it while your fellow investors can't. That would be another good Question Two: What is it you can understand about where the dollar is heading? But first we have to hit Question One—what do you believe about what causes currency prices to move that is wrong? Let's hit on some popular myths.
As of this writing in 2006, investors tend to think the dollar has been falling far and forever. Misconception of the relative strength of the dollar is widespread. Ask a friend (colleague, family member, or golf partner) where they think the dollar is, and they usually feel the dollar has continued to do whatever it did the past few years or so up until the past few months. Many professionals based their 2005 and 2006 forecasts on the assumption the dollar would continue to weaken badly. What they miss is the dollar is by no means unidirectional. After being weak in 2004, it strengthened tremendously in 2005. By mid-2006, it had reversed, falling flat relative to 2004.[147] Mind you—during all this time there were ups and downs. Currencies are like any other security traded on an open market—they experience volatility. And yet, the belief remains the dollar is generally weak and always falling.
This is an easy Question One: Is it true the dollar is always weakening (or strengthening)? Let's take a look at some data in Table 7.1 and see.
Table 7.1 breaks down the dollar, euro, and pound sterling against major Western currencies. Years when the dollar was weakening are shaded, and years when the dollar was strengthening aren't. Paying attention to just the shading and not the numbers, you see the dollar clearly doesn't always move in one direction. No Western developed nation's currency does.
It's very clear when looking at currency price moves in this format, major Western currencies typically experience strengthening and weakening cycles against other major Western currencies for no more than two to four years at a crack—rarely as long as four—before reversing. Longer is rare. I call this the Three Year Rule. There are a few places where the Three Year Rule falls apart. First, from 1993 through 1996, the dollar weakened versus the New Zealand dollar for four straight years. However, it might be a stretch to call the kiwi dollar a major currency since New Zealand is about as populous as Colorado. When looking at the yen versus the euro and pound sterling, you get several four- and five-year cycles. But the yen is an Asian currency, not a fully Western currency.

By and large, this rule stands up when comparing Western currencies. They don't seem to want to move in one direction for more than about three years. Hence the name: Three Year Rule. During the tail end of 2004 and throughout 2005, most forecasters foresaw weak stock market returns due in part to an imploding dollar leading to the devil and dismay. Without knowing anything else, I knew to look for a turning point someplace before too long because of the Three Year Rule. I also knew global and domestic markets were likely to be positive in 2005 (as I forecast in my January 31, 2005, Forbes column) due, not primarily, but in some small part because of the positive surprise of a stronger dollar and the lack of a dollar disaster. Note there is no reason by itself a stronger dollar should contribute to stronger markets, except if people have a big fear of a weaker dollar that fails to materialize, they will end up being pleasantly surprised and their sentiment should improve, boosting demand for stocks with it. (It all comes back to supply and demand for stocks.) In 2005, a stronger dollar and the lack of demise therewith was a bullish surprise not priced in—simple as that.
You're a pro on deficits by now, so you already know this is ridiculous. Yet, budget deficits are another favorite patsy for a weak dollar. (Yet again—the assumption that a weak dollar is bad and a strong dollar is good.) But this lunacy runs something like this—foreigners fear our inability to put our fiscal house in order, thus creating less dollar demand.
First, as covered in Chapter 6, a federal budget deficit in the United States isn't bad for the economy or the stock market. Rather, it's a good thing as it increases velocity of money, increases debt (which you know is a good thing, not a bad thing), and puts more money in the hands of the private sector (you, me, and even our heroin-addicted Apple iPod borrower). Historically, as we showed in Chapter 1, time periods following peaks in the federal budget deficit were followed by lush economic times and positive stock markets, whereas budget surpluses were followed by less rosy conditions.
Second, exchange rates are monetary phenomena while budget deficits are fiscal. They are wholly unrelated. One doesn't beget the other. At all! There is no connective mechanism. Yes, if the central bank monetized the debt created by the deficit, it would create new money that might weaken the dollar. But why not just focus directly on the money creation because it's the money creation that does the do? Money creation can weaken the dollar whether there is a deficit or not.
Third, the United States ran huge budget deficits (some even bigger than today as a percentage of GDP) throughout the 1980s and early 1990s. During many of these periods, such as 1992 through 1993, the dollar soared. Today, the British, Germans, and Japanese are running budget deficits, as illustrated in Chapter 6. If a budget deficit is bad for the U.S. dollar, why isn't it bad for the sterling, the euro, and the yen? If the dollar is weak, it will be weak against the aforementioned currencies. If those countries' budget deficits are all causing their currencies to be weak too, against what are they weakening? The Malaysian ringgit? The truth is, no major Western country's budget deficit or surplus has any relationship to the relative strength of its currency.
By now, you have this one cold too. I won't waste much time on it. From Chapter 6, you know this myth is wrong for the same reasons the trade deficit myth is wrong. All the same logic applies. Only two points. The United States has run current account deficits ceaselessly since 1981; yet we've had periods of both a strong and weak dollar. If you run a correlation coefficient against this deficit as a percent of GDP versus the dollar's price, you get basically zero correlation over these 25 years regardless of whether using daily, weekly, monthly, or quarterly data.[148]
The New Zealand and Australian dollars and pound sterling all strengthened relative to the U.S. dollar in 2002, 2003, and 2004, yet those nations were also running big current account deficits then. No one has offered an explanation why our current account deficit is bad for our currency while their deficits are good for their currencies. Probably because there is absolutely no demonstrable relationship. And maybe because people pay no attention when New Zealand and Australia run current account deficits! I bet you never do!
Hereto, trade deficits were largely covered in Chapter 6. You can't argue our trade deficits are bad for the dollar but Britain's, Australia's, and New Zealand's are good for their strong currencies. Trade deficits are never "paid back." Per Chapter 6, this is a mercantilist view and about 250 years behind the times. We have lots of perma-mercantilists and, I guess because they can't catch up, they'll always be around. But you needn't be one of them. We live in world where Apple imports memory chips and other components manufactured dirt cheap overseas, creating a trade deficit. But Apple turns around and sells the latest iPod creation (to heroin addicts and normal people) at a hefty 50 percent profit margin (according to market researcher iSuppli),[149] increasing their earnings per share, which in turn increases shareholder value. The mercantilists' heads would explode if they tried to contemplate a world where trade deficits co-exist with increased wealth for everyone. But that is our world and it's beautiful.
Tied to both this and the current account deficit is the myth that foreigners are "propping up" our dollar. This is often referred to as, "being dependant on the kindness of foreigners." I simply have no evidence of foreigners being kind. Certainly Americans are kinder. Not only does America proportionately engage in vastly more foreign aid than other countries put together, we give away more private charity by far than all the rest of the world combined. And I don't know that many kind Americans. But kind foreigners? What foreigners do you know who act like that? Or a better question is: Why would a foreigner act any differently than you? When you're investing, do you place your money where you think it's likeliest to make money, or do you invest where you think it will do the most good for the world? Where the world needs the most propping? Foreigners aren't propping up anything in America. Mercantilists think foreigners "prop 'til they drop." Those who think correctly know they "invest where they think best." They invest here because they think they will get a better return for their money than other alternatives. If they didn't think this was the case, they would invest elsewhere. No other rational explanation
If you're holding foreign securities during a time when the dollar falls, your foreign securities may seem to net a higher return. The reverse is true as well—stocks domiciled in a country with a relatively weaker currency may seem to perform not as well at exchange time. Don't forget, to invest globally, you needn't trade your dollars for euros, yen, or ringgit. Buying foreign ordinaries (stocks in foreign countries in the local currency) can be an ordeal for individual investors—you may have to establish a custodian account in that country. Skip the hassle. If you're an American, trade in American Depository Receipts (ADRs)—foreign stocks traded in gringo dollars.
Over the long run, because currencies are so cyclical, the currency effect nets out to be close to zero anyway. Since 1970, investing globally using local currencies decreased an American investor's return by a total compounded 27 percent, while the MSCI World has risen a cumulative 2000 percent plus. Over 36 years, a difference of 27 percent compounded isn't much—the currency impact equals 0.7 percent per year—hardly worth hedging, particularly when transaction costs are considered. You were mildly better off leaving your global investments in U.S. dollars. Yes—leaving them in U.S. dollars—but not enough to be doing a little joy dance. Over 36 years, your excess return might have paid for a couple of speeding tickets.
Fine, so the impact is nil, but what can the dollar tell us about where the stock market is going? It can make some sense that a strong U.S. dollar might help U.S. stocks—and vice versa. We can check to see if the facts support this theory. If the dollar is weak, then stock returns would similarly be weak. But we can see in Figure 7.1, stock returns can be strong—very strong—even as the dollar is weakening.
And that is something true in the United States and around the globe. Currencies don't dictate the direction of the stock market, or vice versa (see Figure 7.2).
There is no basis for thinking a strong dollar leads to good stock returns or vice versa. The dollar isn't predictive of U.S. stock performance, global stock performance, Polish stock performance—none of them. Weak or strong, by itself, you shouldn't fret currencies.
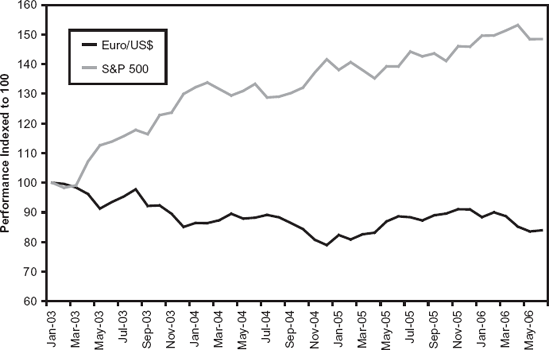
Figure 7.1. A Weak Currency Doesn't Mean a Weak Stock Market Return:United States. Source: Thomson Financial Datastream.

Figure 7.2. A Weak Currency Doesn't Mean a Weak Stock Market Return. Source: Thomson Financial Datastream.
Let's bring in Question Three and think about the dollar the way we thought about the U.S. current account deficit and our stock market versus the rest of the world. When the global stock market explodes upward you know the U.S. market probably will too, right? They're positively correlated. If the global stock market implodes, you know the U.S. will probably be down, too. Sometimes America goes up more than the world, and other times it falls more. But they tend to go the same direction when there is any material direction. And the U.S. is about half the world stock market. So, if the falling dollar is supposedly bad for U.S. stocks, shouldn't the rising non-dollar currencies be good for non-U.S. stocks? They are an equal offset. But there can't be a global falling currency, only global inflation. Likewise there can't be a global trade deficit or current account deficit, yet people act as if the negative is more powerful than the positive though they never explicitly state this. (Although despite them never saying this, there is some behavioralist basis for it—in the concept of myopic loss aversion.) Yuk! Mercantilists!
Said another way, the United States is about 38 percent of global GDP, making the rest of the world about 62 percent. If a falling dollar is bad for the U.S. economy, shouldn't a rising non-dollar be good for the other 62 percent and more than offset the deteriorating U.S. economy with improvements to the non-U.S. economy? Alas, no one thinks globally much so they can't quite get themselves to see it this way. These mercantilists aren't stuck in the 1960s; they're stuck in the 1690s.
Different currencies are simply flavors of money identified by their issuers (central banks), and their banking systems. Because they're commodities traded on free and open markets, they derive their relative value in the same way as other assets, by supply and demand.
An exchange rate reflects the value of one currency quoted in another currency's terms. It's entirely relative and has no absolute meaning otherwise. Each particular exchange rate is driven by a complex combination of the supply and demand characteristics of each of the two currencies. Relative increases in demand or decreases in supply will drive one currency's exchange rate up versus another, and vice versa.
The base supply of a currency is determined solely by the issuing central bank, expedited by banks operating under it. It has a monopoly on the creation or destruction of its currency. Central banks desire relatively stable prices with moderate monetary growth, which in turn should yield relatively low inflation rates. If they act responsibly, major currencies should have fairly stable exchange rates in the long run—though volatility is normal over shorter periods.
However, an irresponsible central bank or a government taking control of its country's central bank can undermine its country's position as a major, developed country. Remember Germany's Weimar years? That was arguably a singular example in modern history, as they completely wiped out the German currency in the early-1920s due to excessive money creation, leading to hyperinflation. Developing countries, like Brazil in the early-1990s, often don't have independent central banks and can experience much longer directional currency moves, almost always on the weakening side. But big countries have reasonably disciplined and independent central banks, like our Fed, and won't experience permanent, unidirectional currency moves.
Demand for currency is determined by several factors. Principal among them is the amount of economic activity conducted in that currency (e.g., a grocery store in Dallas uses dollars, not yen). The more economic activity using a particular currency, the more demand for that currency. Another important money demand source is the "store of value." If investors believe assets denominated in a currency will hold or grow in value versus other assets in different currencies, demand for that currency grows.
Over the long-run, just like with stocks, supply determines relative currency strength or weakness. When a central bank allows excessive money creation relative to real economic requirements, the excess supply depresses the currency price and boosts inflation. More money for the same amount of assets decreases the currency's store of value. The reverse is true if the central bank is too restrictive in creating money—but too strong a currency isn't a goal either. There's absolutely nothing investors can do about the monopolistic central banking system, besides hoping it won't make too many mistakes, nor is there any way to predict the long-term direction of supply. Keep in mind, our central bankers have gotten better in recent years. Make no mistake, the Fed was a disaster between 1929 and 1932 as it shrank the quantity of money at the worst possible time by 30 percent, making the Great Depression vastly worse than necessary and arguably causing it. That was its low point, to be sure. Since then the Fed hasn't always been great, but on average, it has been getting better.
Traditionally, former Fed chairmen were derided for their many mistakes at mismanaging the economy. William McChesney Martin Jr., Arthur Burns, G. William Miller—they were all criticized widely and wildly after their time. Before he became chairman, Burns criticized Martin nearly endlessly. Martin ran the Fed from 1951 to 1970, giving Burns plenty of time to attack him. Burns claimed Martin knew better than to make the mistakes he did. Martin later claimed when you became head of the Fed, you took a little pill making you forget everything you ever knew, and the effect lasted just as long as you were head of the Fed. After becoming head of the Fed, and coming under attack himself, Burns claimed he took "Martin's little pill." (To people under 50, this was a play on a famous health aid called "Carter's Little Liver Pill" that had nothing to do with being good for your liver, whose name was changed to "Carter's Little Pill," and is, in fact, a laxative.) They were all criticized. And rightly so, as they all made many mistakes—but fewer as the decades went on and they learned from prior mistakes.
Paul Volcker was the first Fed head not roundly criticized later—although Volcker forced the 1980 and 1982 recessions in the name of breaking inflation's back. Some would say that was too heavy handed, but overall he did a better job than any prior Fed head. Greenspan was next and did better still because he was capable and could learn further and more. Their predecessors were assuredly not idiots (though Miller might have been politically, but he is another story altogether)—they were just doing the best they could, stabbing in the dark based on largely untested theory with, by today's standards, very primitive data-collection capabilities and vastly inferior electronic analytical capability. Only with the onset of improved technology and 24/7 instant information could Fed heads test theories and check for correlations (i.e., do Question Ones) before deploying policy to horrific results. And they could react faster and learn from prior mistakes. As a result, we've seen fewer policy errors in recent decades.
Errors still happen—like when Greenspan created way too much money in 1999 in fear of potential Y2K problems, flaming the economy. Then, he sucked it back out in 2000 after Y2K wasn't problematic—helping make the 1999 and 2000 boom-bust bigger than otherwise. But mistakes are made less routinely and massively than in the pre-Volcker era. Greenspan's worst mistakes were pretty good compared to the best of earlier decades. The same has been going on overseas. My guess is, as central bankers benefit from future improved information flows and accumulated lessons of the past, on average they keep making mistakes but the mistakes are fewer and not as bad. As major developed nations' central bankers tend to make fewer dumb errors, intermediate term currency volatility may decline somewhat from historical levels (increasing the validity and regularity of our currency Three Year Rule).
Short-term (from minutes to months) effects impacting demand include when a senior government or central bank official jawbones (speaks favorably or unfavorably about a currency or interest rates) which can push short-term sentiment and shift demand. This has fairly fleeting impact—sometimes moving currency markets for a few minutes up to perhaps a month. Think about what happened in the markets whenever Greenspan would make one of his famously indecipherable comments: Mumble/jumble/grumble/fumble—and sound humble! The market would think it could understand what he was getting at, and go through a temporary whip-saw. Usually the next day, the markets would be back to business as usual.
Also, discretionary central bank open market operations—when a central bank buys one currency in exchange for another—can have a short-term impact. But no one bank has a big enough balance sheet to overwhelm all the other factors impacting the currency market by simply exchanging currency.
Even the frequently demonized speculators can have some small and fleeting impact on demand and the relative prices of currencies, but the speculators have an even smaller impact than central banks because their balance sheets are so much smaller. Decades ago, George Soros did take down the Bank of England—down hard—but only because in that earlier era it had put itself in a position to be taken down. And Soros is widely quoted as saying the same could never happen these days. Further dissipating the impact of speculators is the fact they generally don't act in any organized fashion. Speculators speculate on different currencies going in different directions and, to some extent, they cancel each other's impact.
Like stocks, currency movements are exceedingly fickle in the very short term. You shouldn't care much about what a currency does from day to day or even month to month anyway (unless you're betting on currencies—which has all the same qualities of betting on any other commodity).
Time for another Question Two: What can you see driving currencies and demand for them others can't? There are a few obvious factors contributing to short-term shifts in supply and demand for currencies. First, non-discretionary central bank operations. When a country pegs its currency to another currency (the Chinese yuan to the U.S. dollar, for example), the pegging central bank must either buy or sell the other currency to maintain the relationship. Second, when one country's economy grows faster than another, the demand for its currency increases because more transactions take place in that currency. Both of these are easy to fathom—you don't need Question Two for them. But what else could drive currencies? What can you fathom?
Each and every day, speculators make bets on exchange rates through what is called a carry trade. A carry trade works thusly: You borrow short-term money in one currency, convert it to another currency, and buy a short-term bond (though you might choose to make a longer-term bet with a longer-term bond) in the new currency. The idea is to borrow at a lower interest rate and buy a bond yielding a higher rate on the presumption the higher yielding rate won't fall enough to reverse the interest rate spread during the period you hold the bond. The difference between the two rates is free money, and everyone likes free money.
The key is to borrow in a currency you think won't appreciate markedly against the higher interest rate currency where you will park the money—a great Question Two. Since you are selling the borrowed currency and buying the currency you lend into, if many people do this all at once, it tends to make the acquired currency appreciate. Then, you get not only the interest rate spread but also the appreciation on the currency. Icing on the cake. Very attractive.
It would be completely irrational to borrow at a higher interest rate and buy a bond with a lower interest rate. That is the reverse of free money. That's un-free money. So, if Country A's short-term rate is lower than Country B's, investors are more likely to borrow at Country A's lower rate and invest at Country B's higher rate, putting downward-selling pressure on A's currency and upward-buying pressure on B's currency. Currency prices then become a bit of a self-fulfilling prophesy, as carry trades take place in huge volumes daily.
In theory, it makes sense, but let's scope some actual scenarios to see if this is correct. Figure 7.3 shows the yield curves for the U.S., the U.K., Euro, and Japan at the beginning of 2004. At the short end of the curve, the U.S. curve is well below the U.K. and Euro, yet still above Japan. It so happens the dollar was weak that entire year. Investors were borrowing in America and investing in short-term instruments abroad, contributing further to a weak relative dollar. If you borrowed in America at a 1 percent six-month rate and lent into Euroland at above a 2 percent rate, you picked up the 1 percent spread as free and easy money as long as the Euro didn't fall in value. Since lots of people did it all at once, they sold dollars and bought Euros, pushing the dollar down and Euro up. The opportunity was even more extreme if you lent in Britain, which is the reason pound sterling was so strong.

In 2005, after multiple Fed fund rate raises, the short end of the U.S. yield curve had risen above Germany and Japan, and was closing a lot of the gap with the United Kingdom. The dollar strengthened considerably during 2005 against pretty much every major world currency, as the carry trades started going in the other direction. Effectively, as the Fed raised short rates, it choked off the carry trades that had been holding the dollar down (see Figure 7.4).
The evidence supports this theory, but examine it further. Figure 7.5 shows the spread between U.S. and Euroland short-term rates over the past 20 years, as well as the dollar's relative strength (we substitute a GDP-weighted basket of European currencies prior to the euro's introduction in 1999). When the interest rate spread is increasing (meaning our short-term rate is getting higher than theirs), the dollar is generally strengthening against the euro, and when our short-term rate moves lower, the dollar is generally weakening. Not each and every year, as there are other supply pressures at work here as well, but enough to make this a somewhat reliable indicator.
It typically doesn't work when the market can somehow anticipate in advance the lower rate country will raise rates and hence choke off the currency carry trades. Then the currencies move in advance of the central banks, but normally, currency movements are overwhelmed by either interest rate spread differentials or speculation based on future interest spread differentials.


With some exceptions within developed Western nations, countries with higher short-term interest rates that keep moving higher tend to have the stronger currencies. Countries with low short-term interest rates that remain unexpectedly low tend to have weaker currencies. This pattern is compelling, and makes sound economic sense due to carry trade activity. Another way to say that is: Demand for a currency increases and the price with it when appropriately moving yield curve differentials between countries pay people to be more eager to own a given currency. This is why British pound sterling has been so strong, so long—they've kept their interest rates higher than everyone else's. Pretty simple! As the Fed paid up in 2005, people stopped borrowing in U.S. dollars, selling, and investing overseas, and instead started doing the reverse—borrowing overseas and buying dollars—then the dollar strengthened. Demand for currency, more than not, increases when central banks pay people to demand more of their currency—which relates to them adjusting their supply. What I'm telling you isn't unknown, but few notice it, and fewer still believe it, which is why it will have legs for some years. You can use this information to discount strong currency sentiment based on myths we debunked earlier in this chapter. And, you can use it for a rational basis for a market bet.
What if you can see the dollar's direction over the next year or so? First, you could trade the currency directly, like any other commodity. If you know what others don't, you have the basis for a bet. Second, what can you fathom clearly about the stock market if you can understand the dollar's direction? That would be a great Question Two. You now know the dollar's relative strength isn't predictive of stock prices. But the dollar's strength does matter when professionals base their forecasts on the dollar's direction as they did in 2005. When forecasters predict stock market doom and gloom tied to a dollar implosion, you've got something you can bet against. You have an advantage because fear of a false factor is bullish. In fact, if most folks fear a weak dollar will cause weak stock prices, but you can fathom the dollar won't weaken much, that is a bullish surprise helping sentiment and hence demand for stocks—despite no fundamental mechanistic connection—just like in 2005.
Investors talk about supply and demand, and know intuitively supply and demand drive prices, but just aren't applying these concepts to the securities, bonds, and commodities they buy. And if they do, they typically aren't thinking about supply or demand correctly. Now that you know securities pricing is always and everywhere a result of supply and demand, you can focus your energy on what counts and start to make more reliable 12-month forecasts. And that is something you can know that others don't. But how can you make a forecast? And how can you know what the market is more likely to do? For that, we move to Chapter 8.