It's safe to assume if you knew something was wrong, you wouldn't believe it was real and true in the first place. But in a world where so much of industry applied craft has morphed into long-held mythologies, much of what everyone believes is false. This isn't any different from long ago when humanity believed the world was flat. You needn't beat yourself up if you fall prey to false mythologies. Pretty much everyone has and does. Once you know and accept that, you can begin gaming everyone else.
If sorting false mythology from fact were trivial, there wouldn't be so many false truths. While this isn't trivial, it isn't impossible either. One inherent difficulty is this approach requires being skeptical about all your prior beliefs, something most humans dislike. In fact, most humans hate self-questioning and prefer spending time convincing themselves and others their beliefs are right. Effectively you can't trust any conclusion you thought you knew.
To think through false mythologies, we must first ask: Why do so many people believe things that are false? And why do false truths persist—getting passed down the decades as if they were fact? It comes back to the same point: People persist in believing things that are wrong because, individually, people rarely investigate their own beliefs, particularly when what they believe makes sense intuitively—even more so when those around them agree with them. As a society, we are often encouraged to challenge someone else's views, as in, "I know those @&%$#! (insert either Republicans or Democrats as you choose) are full of phony views!" But we aren't trained to challenge ourselves or to question the basic nature of the universe the way an Einstein, Edison, or Newton would. Our instinct is to accept wisdom passed to us by former generations, or smarter people, or both. These beliefs don't require investigation because we believe certain truths are beyond our ability to challenge. Often in life, that is right. I mean if "they" can't figure it out, how could I?
Medicine is a good example. We are correctly conditioned to go to the doctor, describe symptoms, hear prognosis, and accept a prescription. Generally that is good conditioning because medicine is an example of science and craft operating largely in parallel harmony—not perfectly because there are certainly plenty of myths among doctors—but generally because over time science modifies the craft and the craft improves. Because there are so many life examples where our conditioning serves us well, we are blind to the few areas, like capital markets, where it doesn't.
There are myriad beliefs you're likely to share with your fellow investors. These beliefs have been built into decades of literature and are among the first things people learn when they start investing and have been accepted by the biggest names around us. Who are you to question and challenge them?
Exactly the right person!
For example, take the notion high price-to-earnings (P/E) stock markets are riskier than low P/E stock markets. (For those few of you who are newcomers to investing and not familiar with P/E, it's the price per share divided by the earnings per share, and is perhaps the most basic and famous valuation metric for stocks. The same calculation can be aggregated for all stocks of a type or the whole market to create a notion, for example, of the entire stock market's P/E.)
Investors categorically believe when the stock market has a high P/E, it's riskier and has less upside than when it has a low P/E. Think about it casually, and it probably makes sense. A high P/E means a stock (or even the whole market) price is high—way high—compared to earnings. Get too far out on that scale, and it would seem a high P/E means a stock is vastly overpriced and likely to start falling. This belief is so widely held by so many people, seems so logical, and has been a basic tenet of investing for so long that if you start proposing to your friends it's false, you will meet with overwhelming rejection, ridicule, and perhaps suggestions you're morally deficient somehow.
Yet, I proved statistically more than 10 years ago the P/E, no matter its level, by itself tells you nothing about market risk or return. Statistics aside, if you delve heavily into theory (as we do later), you will also learn the P/E shouldn't tell you anything about risk or return anyway. But tell that to people, including the overwhelming bulk of people who have been trained and should know better, and they will think you're crazy—a real whack-job. The cool part comes after we accept the truth that P/Es tell you nothing about future return by themselves—when people are freaking out, fearfully fretting over the market P/E being too high, we can bet against the market falling. While that won't always work because something else can come along and knock the market down (we cover how to see that later), it will work much more often than not. In the same way, if the market's P/E is low and we can sense people are optimistic because of it, we can bet against them also. The key is understanding the truth instead of the mythology. This is basic to the scientific approach.
Many false mythologies—just like the P/E one—are accepted widely by the best and brightest minds and passed to the investing public through all forms of media. They don't inspire questioning from you, me, or anyone. We have faith in them, like Catholics do in the Trinity and Environmentalists in Global Warming, and they require no further proof. Holy! Sacred! No one questions these beliefs. No one offers dissenting analysis. And if you do, you're a heathen. Because there is no dissenting opinion, society feels no need to see proof of these alleged investing truisms with statistically valid data. And mythology continues.
How can it be, with over half of Americans having some sort of investment account as of 2005,[5] almost no one demands hard evidence to support generally accepted investing wisdom? Why do investment decisions not get the scrutiny that car mechanics do? We should be at least as skeptical, if not more so, of the financial industry's pronouncements than we are of a Volvo dealer's. To change the success (or lack thereof) you've had so far with investing, be skeptical. Be a cynic. Be the one to point out the emperor wears no clothes. Look around and assess what you and your fellow investors are accepting as truth. But the most important person to be skeptical of is yourself.
Long ago as I read or listened to media, I'd note things I believed were false and run off to do independent checking to prove I was right. (People love to prove they're right.) I'd gather data and do statistical analysis to prove they were wrong and I was right; and I could prove I was right to my satisfaction pretty often. (It's amazing how often people can prove they're right to their own satisfaction—the plaintiff, judge, jury, and executioner all in one.) But later I realized I was doing the wrong thing. What I should have been doing is looking in the media for assertions I believed were true and then checking to see if they weren't really false. Why?
If I believe the assertion is true, then probably so do many others, if not the overwhelming bulk of investors. Maybe everyone. And if we're all wrong, there is real power there. If I can prove I'm wrong and most everyone else is also wrong, then I've got some useful information. I can bet against everyone knowingly. I've got one provable form of knowing something others don't.
Suppose I believe factor-X causes result-Y. If I believe it, probably most other folks do too. But if I'm wrong, everyone else is wrong. When X happens, people will move to bet on Y happening. Suppose I can learn X doesn't cause Y. That means something else is causing Y. That means after X happens, Y happens sometimes, but it's purely random to X's existence. Now when X happens, people will still move to bet on Y happening, but I can bet against Y happening and I'll be right much more often than I'm wrong. (If I can figure out what actually causes Y, I can take a big step further, but we don't cover that step until Chapter 2 and Question Two.)
With our P/E notion, we can see one such perfect example. Say the market's P/E goes up—a lot. Normal investors notice and conclude risk has risen and future return is lower and bet against the market doing well. Sometimes stocks won't do well, but more often than not stocks will be just peachy because the P/E by itself tells you nothing about market risk and direction. When I see a high P/E market and fear of it, I can bet against the market falling. Sometimes, like 2000, it won't work. But more often, like 1996, 1997, 1998, 1999, and 2003, I'll be right. I don't expect you to believe the P/E thing right now. Right now I expect you to believe the traditional mythology about P/Es and not even be very interested in challenging it. (We get to that later in detail.) For now I just want you to accept in your bones if you can learn an accepted mythology is actually false you can bet against it and win more often than you lose.
A good way to think about successful investing is it's two-thirds not making mistakes and one-third doing something right. Hippocrates is frequently credited with the phrase, "First, do no harm," and it's a good investment principle.
To first do no harm, you must think about what you believe and ask yourself whether it's correct and factually accurate. Go crazy. Question everything you think you know. Most people hate doing this, which gives you a real advantage over them. As stated in this chapter's title, this is the first question: What do you believe that is actually false? If you want, you can change "false" to "wrong."
Asking Question One only helps if you can be honest with yourself. Many people, particularly in investing, are constitutionally incapable of contemplating they're ever wrong. They will tell you they do well and likely hoodwink themselves into believing it—but they don't. And they never subject themselves to reliable independent analysis. You must accept that you and the pundits and professionals from whom you glean information can be and probably are wrong about many basic beliefs. Me too!
Have you ever presented such a question to yourself about capital markets? Asking yourself if what you believe is actually wrong requires introspection. As humans, we're hardwired to be overconfident. This is hardly a new development. Behavioralists will tell you our Stone Age ancestors had to be overconfident to hunt giant beasts each day armed merely with stone-tipped sticks. If they practiced introspection and came to the rational conclusion that tossing a flint-tipped branch at a buffalo was utter lunacy, they, their families, and their communities would have starved. In fact, overconfidence—the belief you can do something successfully for which rationality would argue otherwise—is basic to human success in most fields and necessary to our successful evolution as a species. However, it hurts tremendously when it comes to capital markets as we see in Chapter 3.
Just so, investors are loathe to question generally accepted knowledge. If we started doing so, we might soon realize the market exists solely to humiliate us as much as it can for as long as it can for as many dollars as it can. I refer to the market by its proper name, "The Great Humiliator" (TGH for short). I've come to accept my goal is to interact with TGH without getting humiliated too much. TGH is an equal opportunity humiliator. It doesn't care if you're rich or poor, black or white, tall or fat, male or female, crippled or an Olympian. It wants to humiliate everyone. It wants to humiliate me and you, too. To be frank, I think it wants to humiliate me more than it does you. You're fun to humiliate, but if you're fun, I'm more fun. I have my Forbes and Bloomberg Money audiences laughing at me and over $30 billion worth of clients fussing at me when I screw up. Think how much TGH would love to humiliate Warren Buffett. The bigger you are, the more TGH wants you. But in reality, TGH wants to get everyone and does a pretty good job at getting them all. Can't be sated!
How do you, personally, give TGH the most fun? By making the most bets you can based on the same information everyone else has. How do you spoil the fun for TGH? By restricting bets you make to things you think you actually know that others don't.
Practice using Question One the same way I should have—by scanning the media for things asserted you believe. Make a list of them. They can be about single stocks, whole markets, currencies, or anything. Try looking at a stock, regardless of whether you own it or not, and asking yourself, "What would make me buy or sell this particular stock? What information is providing the impetus for a change?" Make a list of anything influencing your decisions.
Make note of decisions you've made not supported by data or any other information. Underneath there somewhere is something you believe—might be right or might be wrong. Be particularly wary of making a decision simply because of something you know others agree with. Highlight, underline, and asterisk decisions prompted or based on common investor catechism. Ask, what evidence did you figure out for yourself supporting these beliefs? Is there any? For most investors, there isn't much.
For example, you may hold a stock with a high P/E ratio. You believe a high P/E signals an overvalued stock so you decide to dump the stock and buy one with a lower P/E. It's a fairly rational decision you may have made countless times before, and one many people would agree is rational.
But are high P/Es bad for single stocks or the market? Have you personally checked the data? If you have asked the question, where did you find the answer? Did you look at the numbers, or did you rest easy because conventional wisdom or some big-name guru endorsed your belief?
Take another scenario. You hold a stock that does well in rising markets but badly in falling ones, a typical highly volatile stock. However, you know the U.S. federal government is running a growing budget deficit—not only a deficit, but a historically high deficit and one that "can't go on forever." You know federal budget deficits left unchecked are "bad for the economy," and in turn "bad for the stock market." All that debt caused by the deficit must be paid back by future generations, and the market will reflect that sooner or later, right? The burden of the deficit has long-term rippling implications, holding down growth and earnings. The deficit has grown to such a size you know a bear market looms eventually. In that environment, your highly volatile stock would do badly and so you sell.
But how do you know budget deficit peaks are followed by poor stock performance? Is it true? Most folks won't ask the question or check history. If they did, they would be sanguine about stocks rather than fearful. Historically, big budget deficits in America and around the world have been followed by materially above-average stock market returns. Don't fear deficits—it is big budget surpluses that have been soon followed by bad markets, like President's Clinton's surpluses in 1999 and 2000.
That doesn't make intuitive sense to you. Deficits must be bad and surpluses good, right? After all, the word deficit has the same Latin root as deficient—and that must be bad. Most folks won't challenge their own beliefs on these kinds of subjects. The notion that big deficits are bad is overwhelming. Few beliefs have as much broad acceptance from professionals, nonprofes-sionals, and folks from both ends of the political spectrum alike. A good way to get the proletariat on your side at a political rally is to vow to lower budget deficits. It's a crowd pleaser.
Here's a baker's dozen of some general beliefs you probably hold, or at least most people do. We've already covered two:
High P/E markets are riskier than low P/E markets.
Big government budget deficits are bad.
Let's think about some more:
A weak U.S. dollar is bad for stocks.
Rising interest rates are bad for stocks. Falling rates are good.
A tax cut causes more debt, which is bad for stocks.
Higher oil prices are bad for stocks and the economy.
Stocks do well when the economy does well.
Stock markets do better in countries with faster growing economies than slower ones.
Small stocks do better than big ones.
Stocks of firms that grow more do better than those that don't.
Cheaper stocks do better than less cheap stocks.
Current account and trade deficits are bad for stock markets.
America has way too much debt.
They're all familiar to you. This is just a short list—a subset of a much bigger list—of views most folks believe that are partly or wholly false. For example, the notion America is way too heavily in debt is backwards. America needs more debt. As I say that, you may be shriekingly dismissive or maybe the statement makes you mad. It challenges your belief set. If the statement makes you either dismissive or mad, you really need the rest of this book. The most standard reaction to someone stating your belief is wrong is to be dismissive and, if further confronted, to get mad. Anger is a very good warning sign because anger is always, always about fear. Angry people usually don't know they're fearful. But anger is always and everywhere simply a reflection of fear. If you're dismissive or angry, you must question yourself to see how and why you concluded your belief was right in the first place. Was it mythology? Was it basic bias? Are you right or not? Sometimes the items in this list and others beyond it are part true and part false, depending on surrounding circumstances. (We look at all of these and more later on.) But the most obvious question is why would you believe any of these statements?
I'd say you believe myths mostly because of two facts: (1) They make common sense, and you aren't typically prone to challenge your own common sense. (2) People around you tend to agree these things are true, and you aren't prone to challenge widely held views.
As you attempt to debunk investor mythology using Question One, you will find three basic results. Either you were right all along (which you will find happening far less frequently than you might have hoped), or you were wrong, or you were really, really wrong. Any of these outcomes is okay because it tells you how to bet better, later.
Let's examine more closely the instances when you're wrong. You and most of your fellow investors (amateur and professional) often believe something is causal—X happens because of Y—but in reality there is no correlation at all. By now you're willing to embrace that can happen, or you would have stopped reading this book. The example we debunk is the aforementioned commonly held belief high P/E stock markets are risky with subsequent below-average returns. As previously mentioned, it turns out high P/E markets aren't predictive of poor returns—not even remotely. In fact, historically, they've led to some pretty good returns. What's more, low P/E markets aren't predictive of good returns either.
Forgetting for now why the P/E myth is so easy to buy into, we know people overwhelmingly do believe high P/E markets predict below-average returns and above-average risk.
But if it were true, you could show some form of high statistical correlation between the claimed cause and result. A statistician will say you can have high correlation between two things out of quirky luck with no causation. But the same statistician will tell you that you can't have causation without high correlation (unless you run into scientific nonlinearity, which doesn't happen in capital markets to my knowledge—but you could check on your own with the Three Questions when you're finished with this book). When a myth is widely accepted, you will find low correlations coupled with a great societal effort to demonstrate, accept, and have faith in correlations that don't really exist.
Investors will root out evidence supporting their favorite myths and create justifications for their belief—factor-X causes result-Y—while ignoring a mountain of evidence that X doesn't cause Y at all. Now let's suppose everyone is of good intent. Still, with the best of intentions it's easy for people to latch onto evidence confirming their prior biases and ignore evidence contradicting their views. Looking for evidence to support your pet theory is human. Accepting evidence to the contrary is no fun at all. This is done in varying ways. One way is to look at a particular time period verifying the false belief and ignore other periods. Another is to redefine either X or Y in a bizarre way so the statistics seemingly prove the point and then generalize afterward about X and Y without the bizarre definitions. Discoveries of data supporting popular myths become popular discoveries.
A great example of this is the now famous study by John Y. Campbell of Harvard and Robert J. Shiller of Yale.[6] Their paper didn't introduce a new idea because fear of high P/Es had been around forever. Their study merely introduced a new delivery of data confirming the view high P/E periods are followed by below-average returns, an already widely held belief. This was actually a better re-do of a study they presented in 1996. But this 1998 publication got very popular, very fast, because it supported what everyone already believed with new statistical documentation. Campbell and Schiller were and are noted academics. Inspired by the prior study, in 1996 Alan Greenspan first uttered the phrase "Irrational Exuberance," relative to the stock market, which reverberated around the world almost overnight and entered our lexicon permanently.
My friend and sometimes collaborator Meir Statman, the Glenn Klimek professor of finance at the Leavey School of Business at Santa Clara University, co-authored with me a paper not refuting their statistics but reframing their approach more correctly with the same data—and you will see P/E levels aren't predictive at all. We basically asked Question One from beginning to end. Much of what follows stems from our paper, "Cognitive Biases in Market Forecasts."[7]
Campbell and Shiller, in simple English, found high P/Es acted as people always thought they did, leading to risky and below-average returns 10 years later. First, they noted the P/E at the outset of each year and subsequent annual market returns going back to 1872, which is about as far back as we have half-tolerably reliable data. Prior to the inception of the S&P 500 in 1926, they used Cowles data,[8] which is an imperfect but generally accepted proxy for pre-S&P 500 years. (All old databases are imperfect. Whenever you're looking at old data, there is apt to be lots wrong with it, but the Cowles data is the best we have.) Then they graphed the data points on a scatter plot and found a slightly negative trend line.
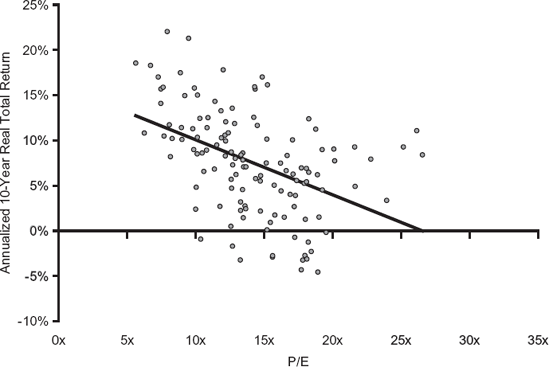
Figure 1.1. Relationship between P/E Ratios at the Beginning of a Year and Stock Returns over the Following Year (1872 to 2005). Source: Robert J. Shiller, Ibbotson Analyst, Global Financial Data, Standard & Poor's, Federal Reserve, and Thomson Financial Datastream.
We can largely recreate their hypothesis for you in Figure 1.1, showing P/Es from 1872 until 2005—again using S&P 500 and Cowles data.
I've included the years since their paper to ensure our findings are relevant today. But you'd get the same basic effect if we hadn't. The period from 2000 to 2002 happens to support their "high P/E is bad" thesis, so we're being fair to them by including it. The negatively sloping trend line shouldn't influence you. You plainly see the scatter points aren't particularly well-grouped around it. The scatter plot is, well, scattered—sort of like a shotgun blast in a mild wind.
Campbell and Shiller based their work on a bizarre definition of P/E—not one you intuitively leap to. They created a "price-smoothed-earnings-ratio."[9] The newly defined P/E divided the price-per-share by the average of "real" earnings over the prior 10 years.[10]Real means adjusted for inflation. Fair enough, but that isn't what you think of when you think P/E, right? But, if so, what definition of inflation would you use? I bet you would use something like the Consumer Price Index (CPI). (The CPI comes up as one of your first few results when you Google "inflation!") Ironically, they chose an esoteric wholesale price index. Again, not what you might default to. So instead of what you think of as P/E, they used a 10-year rolling-average based on inflation adjustments based on an inflation index you wouldn't think of. Got it?
With a normally defined P/E, as you would think of it, there isn't much of a statistical fit at all. Campbell and Shiller's bizarrely engineered P/E gave a result consistent with what society always believed—that high P/E means low returns, high risk. And the world loved it.
In statistics, a calculation is done called an R-squared which shows the relative relatedness of two variables—how much of one variable's movement is caused by the other. (It sounds complicated but it's not—I show you how to find a correlation coefficient and an R-squared in the box.) For their study, Campbell and Shiller's regression analysis gave them an R-squared of 0.40.[11] An R-squared of 0.40 implies 40 percent of subsequent stock returns are related to the factor being compared, in this case, their reengineered P/E. Statistically, not a bad finding (although not an overwhelming one). Though not a whopping endorsement of their theory, this finding still supports their hypothesis.
CAUSAL CORRELATIONS AND THE CORRELATION COEFFICIENT
When asking the Three Questions, you need some very basic statistical capability you can learn right here—nothing fancy. You can do wonders with a correlation coefficient and an R-squared. With these two analytical tools, you can credibly disprove, in many instances, that two events have any connection to each other. It's easy. All you need is an Internet connection and Excel (or paper and pen if you're particularly statistically astute, but it's easier on a computer).
To start, let's get some data to compare. For an easy exercise, we can see how much one stock is correlated to the market over 10 days. (Ten days isn't enough to tell you anything about anything, but will give us short columns of data to work with.)
Step 1
Using Yahoo! Finance as a data source, go to http://finance.yahoo.com. (If you're Internet savvy, feel free to use whatever source you're comfortable with. Just be sure you know how to download or copy and paste into Excel.)
Click on the link to the S&P 500 which is featured prominently—usually on the left hand side of the page. (If you're reasonably Internet literate, this will be a snap for you. If you're not, get a buddy to help you the first time.)
Click on the link for "Historical Prices"—again on the left hand side of the page.
Select "Daily" prices, select a short time frame (Use any time frame you like, just choose the same time period during Step 2. I used January 1, 2006, through January 10, 2006.), and click "Get Prices." Now select "Download to Spreadsheet."
An Excel spreadsheet will pop up with index data for the dates in question.
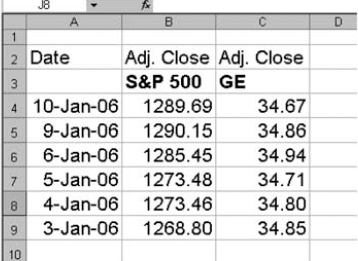
Copy and paste the "Date" and the "Adjusted Close" columns into a new Excel spreadsheet page. You don't need the rest of the data for right now. Note—you'll have missing dates because of weekends and holidays. (You want the "Adjusted Close" because it's adjusted for stock splits and dividends.)
Step 2
Now go back to Yahoo! Finance and get a quote for any stock. I used General Electric (GE) because it's pretty basic. When the stock page pops up, click on the price chart and follow the same steps to get historical prices for your stock. Copy the data into the same spreadsheet, next to your S&P data. Your spreadsheet should look something like this:
Not too hard, right?
Step 3
Now, don't retch when you see this—you won't need it—I'm just showing you this for laughs—but technically this is how you calculate a correlation coefficient:

Don't bother figuring that out if it's been more than six months since you've taken a statistics class. Go to your Excel spreadsheet and click in any empty box. Go to your "Insert" menu and select "Function." Select the "Statistical" category. Scroll down and select "correl." Excel will launch a wizard to calculate the correlation coefficient for you. (Thanks, Excel!)

The wizard asks for two "Arrays." The arrays are just your columns of data. Clicking in each array box allows you to click, drag, and highlight each column of data. You might have to try this a few times to get the hang of it.
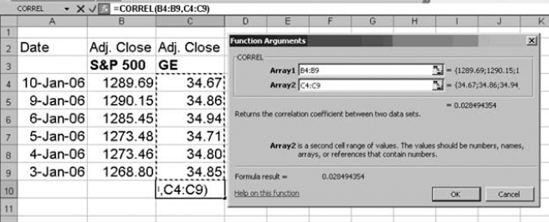
Once you have your array data entered, click "okay" and, ta-da!Correlation coefficient. And without having to do any fancy math or decipher the formula:
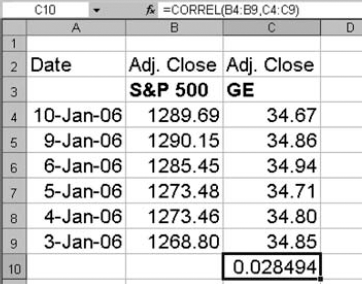
The correlation coefficient tells you how similarly GE behaved relative to the index over the time frame you selected (which was probably pretty small). A number close to 1.0 indicates a positive correlation (you zig, I zig). A number close to −1.0 indicates a negative correlation (you zig, I zag). A number closer to zero means there is little correlation either way (you zig, I Cleveland). Remember, when looking at short time periods, you don't have a basis for making an assumption at all.
Step 4
You aren't quite done. Now you must do something that sounds tough but isn't. To understand the relative relatedness of two variables, you must do a regression analysis and calculate the R-squared. It's way easier than it sounds. Simply square the correlation coefficient. That's why they call it "R-squared." If your correlation coefficient is 0.5, your R-squared is 0.25 (0.5 X 0.5 = 0.25). If the correlation coefficient is 0.85, the R-squared is 0.7225.
The R-squared tells you what percent of one variable's movement you can relate to (or maybe blame on) the other variable. An R-squared of 0.7225 means 72.25 percent of one variable's movement is caused by another (which would be an impressive find!).
You're now ready to find correlation coefficients and debunk causalities that don't exist, and uncover more of what you can know that others don't.
Note: Campbell and Shiller's study, tepid support or not, became wildly popular because it supported the view society had long held. If you present data violating society's myths, those data won't be met with great popularity. That's nice because when you discover the truth, the world won't be trying to take it away from you in a hurry.
By using the same basic data and traditional notions of P/Es at the start of each year from 1872 to 2005 and actual 10-year subsequent returns, we found an R-squared of 0.20.[12] The P/E only potentially explains 20 percent of 10-year returns—statistically pretty random. Something else entirely, or some group of other variables, explains the other 80 percent of price returns. I wouldn't make a bet on an R-squared of 0.20 and neither should you. Said another way, Campbell and Shiller's R-squared was 0.40 and ours was 0.20—so half of their result was based on how they defined P/E differently.
This myth wasn't hard to debunk. You can arrive at the same general conclusion with Yahoo! Finance and an Excel spreadsheet. When it isn't a myth and it's real, you will find you need no fancy statistical reengineering and no fancy math in your analysis.
But even if it were valid, who cares about views of subsequent 10-year returns? Investors want to know how to get positioned for this year and next, the now and the soon, not for 10 years from now. Would you really have cared what the next 10-year return was in 1996, when the next four years rose massively only to be followed by the biggest bear market since 1929 to 1932? Would you have wanted to miss the big up years in a row, and would you have been content to hold on through the big down years? Starting in 2007, if I could tell you with certainty the next 10 years will have a very high return overall but the next two will have a big negative return—would you invest now? Not likely! When you look at simple P/Es on a shorter-term basis, the high-P/E-is-risky thesis falls apart completely as we shall see.
What's more, forecasting long-term stock returns is a near impossibility because stock prices in the long term are the result primarily of shifts in far distant levels of the supply of equities, which in today's state of knowledge (or ignorance) no one knows how to address. Some of my academic friends get angry when I bring this up. But remember, when anyone gets angry, they are afraid and just can't quite put their finger on their fear. In this case, I think it's because very little real scientific work has been done analyzing shifts in supply and demand for securities. Yet, by definition, shifts in supply and demand are what determine pricing. There are great future advances to be made here but so far the progress is minimal despite supply and demand being basic to economics. (We get to supply and demand for securities in Chapter 7.)
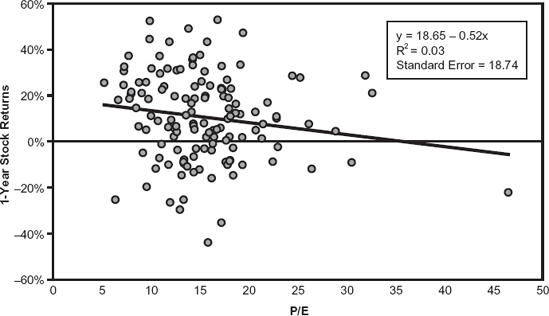
Figure 1.2. Relationship between Annualized (Overlapping) One-Year Returns and P/E Ratios (1872 to 2005). Source: Robert J. Shiller, Ibbotson Analyst, Global Financial Data, Standard & Poor's, Federal Reserve, and Thomson Financial Datastream.
For now, let's take a look at our scatter plot again, this time using normal, nonengineered P/Es and subsequent one-year returns from 1872 until 2005 (see Figure 1.2). Note we have a much shallower negative trend line and the scatter points are even less cooperative. This is our same shotgun blast with a few stray pellets. Does this indicate any sort of correlation at all? With an R-squared of 0.03, the answer is no. If an R-squared of 0.20 is as good as random, an R-squared of 0.03 is randomness itself—pure, perfect randomness.
Finding a correlation where simply none exists is pretty creative; and simply none exists here. To begin debunking myths on your own, you don't need a super-computer and a Stephen Hawking doppelganger (that's probably illegal anyway). If you need ultra-complicated math to support the existence of a market myth, your hypothesis is probably wrong. The more jerry-rigging and qualification your analysis needs, the more likely you're forcing your results to support your hypothesis. Forced results are bad science.
We have shown there is no correlation between high P/Es and poor stock results (or good ones). Even in light of such damning evidence, some may be reluctant to let go of the "high-P/E-equals-bad-stocks" doctrine. Consider this another way. It may further shock and appall you to learn years with higher P/Es had some excellent returns. Moreover, the one-year returns following the dozen highest P/E ratios weren't too shabby—some negative years, but also some big positive years. This isn't statistical but should give you pause.
Need more evidence? No complicated engineering necessary here either. Figure 1.3 shows a basic bell graph depicting P/Es and subsequent annual market returns.
Here is how I arrived at the bell curve illustration on page 18. We noted the broad market's P/E each January 1 going back to 1872 and ranked each year from low P/E to high P/E. Then, I grouped them into intervals creating the familiar bell curve-like shape—with otherwise unrelated years falling into intervals according to their P/Es. The "normal" P/Es fall in the fat part of the bell curve, while the "high" and "low" P/Es fall on the edges. Again, you don't need an advanced degree in statistics for this. Based on this bell curve graph, anything above a P/E of 20 would be "high." In later years, if you do this for yourself, those numbers might move around a bit, but it would take a number of really high or low P/E years to skew the bell curve much.
When you note the P/E ratios for the past 134 years along with the subsequent market return, some empirical truths emerge. Most startling? Most double-digit calendar-year stock market declines—the monster drops everyone fears—occurred when P/Es were below 20, not when they were very high. Most were actually when the P/E was below average. In the past 134 years, there were 19 times the market's total return was negative more than 10 percent. Thirteen times—68 percent of those most negative years—were on the middle to low end of the P/E range, 16.5 being the middle of the bell curve. Only twice, in 2001 and 2002, did a big drop coincide with a P/E above 20. Read the prior four sentences again. Hardly fodder for a myth. Anyone can get these data off the Internet. Anyone can array them. It doesn't take fancy math. It just takes a little effort—it boggles the mind the myth still exists.
So big double-digit drops don't automatically follow high P/E markets. But the myth is so widely and rigidly believed, there must be some kernel of truth to it. For example, high P/E markets must fall more often than those with low P/Es, even if they aren't the monster drops. Right? Well, no! P/Es were below 20 in 117 of those years and the market finished in negative territory 35 times (29.9 percent). Of those 17 years when P/Es were 20 or higher—the historically high end of the P/E range—the market ended down five times (29.4 percent). You needn't be a statistician to see that neither high nor low P/E markets did materially worse. Moreover, in three of the five negative high P/E years, the market's decline was fairly benign: −9.1 percent in 2000, −8.8 percent in 1962, −2.3 percent in 1934. Advantage—high P/E markets. Not enough of an advantage to believe in or bet on, but plenty enough to bet high P/E markets aren't the monster mythology has always cowed us into believing.
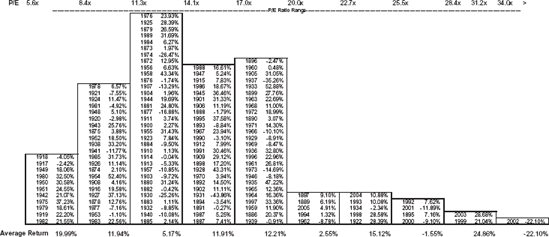
Figure 1.3. 134 Years of Historical P/E Ratios and Stock Market Returns. Source: Global Financial Data.
You've seen the data. You're henceforth unshackled from this investing old wives tale.
Here is a simple test you can use repeatedly. Someone tells you X causes Y in America's markets—like the P/E example—and even has data to demonstrate it's true. If it's really true in America, then it must also be true in most foreign developed markets. If it isn't similarly true in most other developed Western markets, it isn't really true about capitalism and capital markets and hence isn't really true about America—just a chance outcome. I'll not belabor you with the data here—this book already has too many visuals—but if you take the same bell curve approach we used for America's stock market and apply it to foreign markets, the only country where low P/E markets seemed materially better is Britain—and that is based on a few, relatively big years. Elsewhere you get the same randomness as in America.[13] Whenever anyone tells you something works a certain way in America, a good cross-check is to see if it also works outside America. Because if it doesn't, it doesn't really work robustly in America either!
Some will say, "You must see the high P/E problem in the right way." (Warning: a precursor to a reengineering attempt to support a myth and it won't hold.) For example, they may agree it isn't just that a high P/E is worse than a low P/E, but when you get over a certain P/E level, the risk skyrockets and when you get under a certain P/E, it plummets.
For example, they may assert market P/Es over 22 are bad and P/Es under 15 good and everything in between is what confuses everyone—throwing the averages off, leading you to not see things the way they would have you see them. Fair enough! That's easy to test. You take all the times when the market had a P/E over 22 and envision we sold and then bought back at some level—you pick it, I don't care what it is as long as you apply it consistently. It ends up historically, regardless of the level picked, none really beat a long term buy-and-hold in America. The same is true overseas (except, again, in Britain where you can make a weak case a low P/E has had a variety of approaches seeming to work—but only in Britain, which is probably just coincidence—and if you throw out a very few, very big years in Britain from a very long time ago, it falls apart there, too).
Suppose you sell when the market's P/E hits 22 and buy when it falls to 15. That approach lags a simple buy-and-hold. Suppose you change the 22 to 23? Still lags! How about dropping the 15 to 13 or raising it to 17? Still lags. What's more, there isn't a buy-and-sell approach that works overseas. You may disbelieve all this. Great. Prove I'm wrong. To prove it, you must find a buy-and-sell rule based on simple P/E beating the market with one-, two-, or three-year returns. It must work basically the same way in a handful of foreign developed markets and if you start or end your game on different dates. Try to find it. Maybe you're better than I am, but I looked and looked and can't find it in any way anyone would believe.
Every time a high P/E market leads to very bad returns like in 2000, 2001, and 2002, you will find a comparable number of examples where it does well like 1997, 1998, 1999, and 2003. There is simply no basis for this myth.
Investors fall prey to myth because they are used to seeing investing truisms in accepted and normal ways—as they were taught. Once you start thinking even a bit differently—not in a complicated way, just differently, like graphing a bell curve or looking for the same phenomenon overseas—myths tend to fall apart. Whenever you're confirming an investing belief, try it from a fresh angle. Go crazy. Be creative. Flip things on their heads, backwards, and inside out. Hack them up and go over their guts. Instead of trying to be intuitive, think counter-intuitively—which may turn out to be way more intuitive.
For fun, let's look at why, intuitively, high P/Es don't spell disaster for stocks. Most investors look at stocks with high P/Es and assume their prices are too high relative to the companies' earnings. If a price is proportionately much greater than earnings (so goes the thinking), the stock must be overpriced; what goes up must come down. What investors forget is the P isn't the only moving variable in the P/E.
In years following high P/E markets, earnings often rose faster than share prices. And often after low P/E years, we ran into unexpected rough economies where earnings vanished. In fact, in 1929, the most famous market peak of all time, P/Es were low, not high, because the soon-to-disappear earnings were too high in 1929, making the P/E low.
When we buy stocks, we're buying future earnings. At some times we're willing to pay more than at others. In high P/E markets, earnings often exceed expectations (as in 2003) and the market prices in higher earnings before we can see them coming. Just by considering what is happening with the denominator side of the P/E—looking at it differently—you can reason for yourself why the myth is wrong.
The myth that high P/E markets are dangerous and low P/E markets are safe persists. But anyone with a dial-up modem and a pencil can see high P/E years are, of themselves, not any worse than lower P/E periods. Why does this myth persist? Because fundamentally TGH is perverse and counterintuitive. It can be painful to accept whatever is fueling your water-cooler debates is wrong or already priced into markets. It's humbling, but true.
Now, I'll steal a page from Chapter 3 and focus on how our brains blindside us on the P/E issue. There is a genetic reason people fear high P/E markets. I can't prove this, but I believe it's true. And you can't disprove it. It's a pretty different way to see this dilemma. You inherited your genes and the information processor that is your brain from your parents, as did they from theirs. Your far-distant ancestors had brains adept at processing certain types of in-formation—that which related to problems they encountered dealing with passing on their genes successfully. Were that not true you and I wouldn't be here. The folks back then who didn't process information well relative to those problems don't have descendents walking the earth now.
Your brain wasn't really set up to deal with the stock market. It was set up to deal with those problems of basic human survival. One problem your ancestors learned to process was heights. If they fell from greater heights, the risk of death or crippling (pretty much the same thing) was exponential. Higher heights increased risk. Falling from two feet is just a stumble. Falling from 10 feet isn't all that tough for a 10-year-old jumping off a roof, but bone breaking for older people. Falling from 40 feet kills usually and a 400-foot height always. Folks learned well when confronted with problems appearing in a framework of heights—more height meant more risk. Greater heights meant you could fall further—exactly how people think of P/Es. They envision higher P/Es as further potential falls and lower P/Es as less distance to smack into the floor, so there is less smacking risk. Any time I present information to you in a form appearing as a heights framework, more height scares you and less height seems safer. If I can present the same information in a way not involving heights, your fear fades instantly. (We do that in a few moments.)
When the market's P/E is higher than normal, most investors know it. Even those who don't know what P/E stands for can tell you "these days" the market is frighteningly overvalued. Their resulting fear of heights and concern over possibly sustaining a loss can be explained by a behavioral finance truism: People hate losses much more than they like gains.[14]
People talk about investors being risk averse, but that isn't quite right. Investors are provably loss-averse. Two pioneers in the field of behavioral finance, Daniel Kahneman and the late Amos Tversky, demonstrated and proved normal Americans (yes, you're probably pretty normal) hate losses about two and half times as much as they like gains.[15] Investors feel the sting of a monetary loss much more intensely than they enjoy the pleasure of a gain. In your heart, you probably already knew that was true for you. And because loss is more agonizingly painful than gain is pleasant, investors will do more to avoid losses than to achieve gains.
Investors will actually adopt additional risk if they believe it can help them avoid a loss they would otherwise incur. Kahneman and Tversky described this phenomenon in what they called "prospect theory." They discovered normal investors (again, you) confuse actual risk with the perception of risk, all in the effort to avoid the possibility of a loss.[16] The perception (or one could say, misconception) of possible losses long mis-associated with high P/E markets is what keeps investors fearful in what would otherwise be a relatively low-risk market environment. The same powers are at work at the bottom of a bear market. Investors are typically most fearful at the end of bear markets when risk is diminished and upside potential considerable. Investors' perceptions are just off.
Investors, particularly many who consider themselves "value investors," have had violent and near-religious reactions to this notion. Instead of practicing introspection and asking themselves Question One—what do I believe that is wrong—they grab at any straw to disavow they're influenced by a very natural bias. In rebuttal, they claim the phenomenon occurs because ultrahigh P/Es come from suppressed earnings posted at the end of a recession. Not quite. This sometimes happens, but it's far from universal. It certainly wasn't true in 1996, 1997, 1998, and 1999. To excuse that, investors say the markets are just irrational. Investors' vehemence that ultra-high P/Es must have a high risk is another aspect of the perverseness of TGH.
We've demonstrated how to use Question One with a well-entrenched misconception. As you strike out on your own, testing your own mythology, make sure you're thorough. A good scientist doesn't stop once he gets the answer to a question; he looks at it repeatedly from different angles.
First, be realistic about your findings. Don't jump to conclusions too fast. One might consider the previous data and create a new myth—high P/Es are predictive of above-average returns. Don't fall for that trick. The evidence here is enough to utterly decimate any wrongheaded belief about high P/Es being bad for stocks. Anything more is inconclusive. It isn't enough. It isn't overwhelming. It won't let you bet and win much more often than you lose. Ultimately, you should take away P/Es aren't, by themselves, a predictor of future results.
Furthermore, if you get just one result supporting your hypothesis, no matter how remarkable, it's happenstance, not a pattern. This is true for anything you encounter or study. You don't want to make a bet based on happenstance. For example, you might be tempted to conclude ultra-high P/E markets tend to be low risk and high reward. Yes, it is true ultra-high P/Es have led to some great stock returns. But there haven't been enough occurrences to make this anything more than an interesting observation and probably coincidence. As you create and test, you must test as many occurrences as you find.
We now know P/Es have no predictive power, so is the P/E good for anything? To find out, we need to steal a page again from Chapter 2 and Question Two. What can we fathom about P/Es that is hard for others to fathom? A standard trick to help you see better and see things others don't is to look at it from a different perspective. One powerful way to test your belief and results is to flip your myth on its head and see what you see then.
So take the P/E and flip it on its head to find out. By putting the Earnings over the Price in this equation, you have the exact same information in a different framework—the earnings-to-price ratio, better called the earnings yield. This is simply the inverse of the P/E—the E/P. Investors are used to seeing expected returns of bonds and cash quoted in yields; whereas most investors are accustomed to valuing stocks by their P/Es. By inverting the P/E and looking at the earnings yield, you can compare apples-to-apples. What's more, you also escape the heights framework just discussed. Table 1.1 shows how to take a P/E and arrive at an earnings yield—a P/E of 20 is really a price of $20 divided by $1 of earnings. So the E/P for this is 1 divided by 20 or 5 percent. When you think of the relationship as an earnings yield, it compares to interest rates (as we see later, it should) and the heights framework scaring us about P/E disappears instantly. The P/E of 20 scares you, but the earnings yield of 5 percent doesn't. It's pretty easy math—again, no Stephen Hawking automaton necessary.
Table 1.1. What Is an Earnings Yield?
P/E | E/P | = | EY% | |
|---|---|---|---|---|
33 | 1/33 | 3% | ||
25 | 1/25 | 4% | ||
20 | 1/20 | 5% | ||
15 | 1/15 | 6% | ||
10 | 1/10 | 10% | ||
7 | 1/7 | 14% | ||
5 | 1/5 | 20% |
This comparison is more rational and straightforward than determining if a stock is cheap or expensive based on P/E. Since stocks and bonds compete for investor dollars, the comparison of bond yields and stock earnings yields gives you something concrete for comparison. For example, if you have a market with a P/E of 20, most folks would say that seems "high." How do you think about a 5 percent earnings yield? Ifbond interest rates are 8 percent, the 5 percent earnings yield might not be attractive, but if bonds are 3 percent it could be. Compare that with going bond yields now.
Before you think a stock market (or single stock) with a 5 percent earnings yield is inferior to, say, a 6 percent U.S. Treasury bond, remember the tax treatment. The earnings yield is effectively a company's after-tax annualized cost of raising expansion capital by selling stock. What does that mean? Well, since the P/E is an after-tax number, you know the E/P is an after-tax number too. A company can get expansion capital by selling stock or issuing a corporate bond. But if it issues a corporate bond, the interest paid on that bond is deductible for tax purposes against revenue. The corporate bond rate is a pretax number. The E/P is an after-tax number.
Suppose the stock has a P/E of 20 and it's an average grade corporation, meaning a BBB corporate bond rating. In mid-2006, it could borrow 10-year money through a bond at about 6 percent.[17] Assuming a 33 percent tax rate, the 6 percent cost is really 4 percent after tax. (To get the tax-adjusted equivalent, multiply the 6 percent rate by 1 minus the 33 percent tax rate—or 0.67.) The stock's E/P is 5 percent, already after-tax. So it's cheaper to raise expansion capital by issuing a bond at 4 percent than selling stock at 5 percent. Corporate bond rates would have to rise above 7.5 percent to make it cheaper for that P/E 20 company to get expansion capital by selling stock. That is the firm's viewpoint.
From your viewpoint, it's somewhat different. The earnings yield needn't be above the tax-adjusted bond yield to make stocks more attractive than bonds. When you buy stocks, you do so assuming future earnings will be somewhat higher due to subsequent future growth. Stocks as a group tend to generate earnings growth over time, sometimes more, other times less. But a bond coupon is fixed. You know it has no chance of rising. If you hold it to maturity, you will get that interest rate. When you buy stocks, you're actually buying the future average earnings yield, which is likely somewhat higher than the current earnings yield. When you buy bonds, the future average bond yield is the current yield. For this reason, the current earnings yield needn't be higher than the bond yield to make stocks attractive relatively.
Has the earnings yield for the stock market ever been higher than the bond yield? Yes, but only for a few and far between years, and that is true all around the world—and these times often were outstanding times to own stocks. When the earnings yield is above the bond yield, stocks are extremely undervalued relative to bonds. Translation: Stocks are relatively cheap.
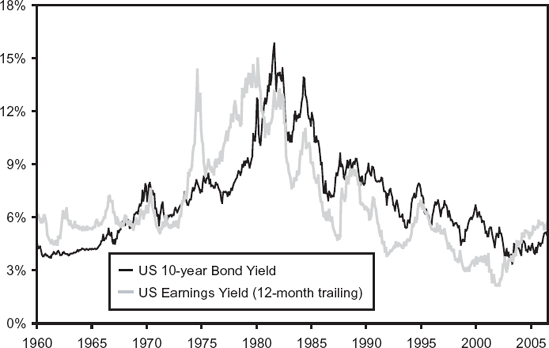
Corporate bond yields bounce up and down based on what happens to government bond yields. Fluctuations in the much bigger government bond market drive shifts in corporate bond rates. Figure 1.4 plots the market's earnings yield versus the government bond yield. You can see times when the earnings yield approached or even surpassed the bond yield, great years in the stock market followed.
Have you ever seen a graph plotting earnings yield against the bond yield? Probably not! They exist but are rare. I think my firm has probably published more of them than all others put together cumulatively. Comparing the earnings yield to the bond yield is a powerful scaling metric you can use over and over to sense relative value and historical norms. Coincidentally, one of the best times to own stocks is when you know they're cheap but everyone else thinks they're expensive. Since 2002, the earnings yield has been higher than bond yields in America, so stocks have been historically very cheap—just when most folks said they weren't cheap but high because P/Es were above historic averages. If you had let high P/Es scare you out of stocks, you would have missed a 75 percent positive move in global markets since the bear market bottomed in October 2002 until June of 2006 (as I write this).[18] Recall what happened the previous time the earnings yield exceeded the bond yield in the early 1980s—uninterrupted years of above-average stock market returns, most of them strong double-digit returns.[19]
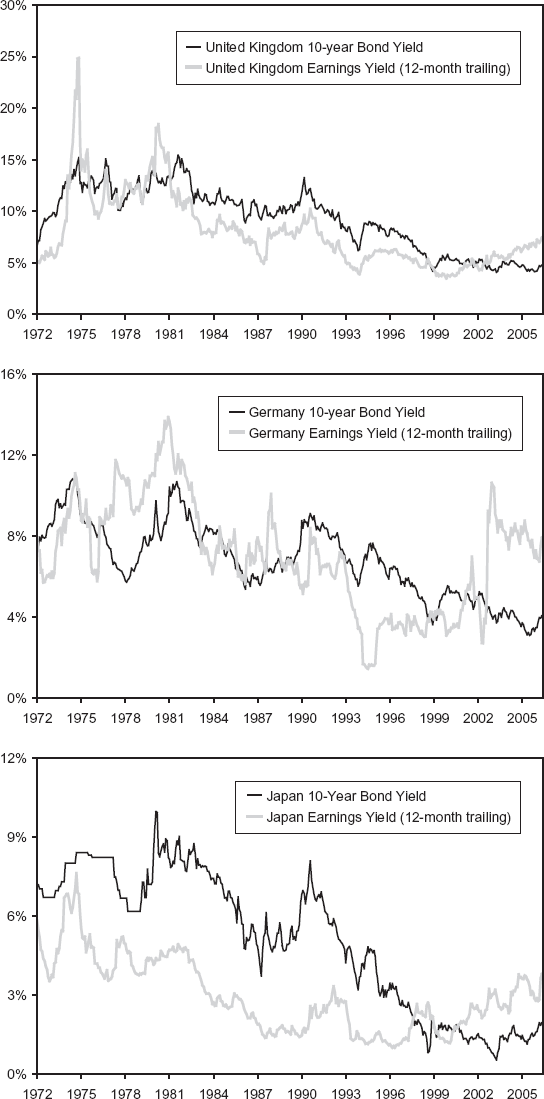
But we aren't done yet. Remember, if something is true here, it should be true in most foreign developed countries. We can see all around the world earnings yields exceed bond yields, and by more than in America—and that too is uncommon. Stocks are cheaper globally in recent years compared to long-term interest rates than they've been in a quarter century (see Figure 1.5).
In the United Kingdom and Germany, stock returns were above average following times when the earnings yield was above the bond yield. Just recently, the earnings yield has been above the bond yield in Japan, and Japanese markets have been experiencing strong stock returns.
We've talked about those myths perpetuated by investors inventing or imagining causal correlations where none exist. What about those myths so wrong the inverse is actually true? Sometimes, when you ask Question One, you discover you have been not only wrong, but really, really wrong. Don't fret. Discovering you have been wrong and uncovering a reverse truth gives you yet another basis for a market bet. A powerful one, because you know for certain everyone is betting on the exact opposite of what you know will happen.
It may be hard for you to imagine something you and your fellow investors can get so completely wrong. But there are some myths in the misguided investor doctrine held so dearly, questioning them is almost sacrilegious. Suggesting such a belief be scrutinized, if only to confirm its veracity, would bring outrage, scandal, and possible excommunication. These myths, the most sacrosanct beliefs in the investor and social catechism, those no one dares question, are sometimes ones we find to be so wrong the exact opposite holds true.
You believe a high federal budget deficit is bad. Everybody knows budget deficits are bad. How do we know? We know because everyone knows. Duh! Pundits, politicians, patriots, perverts, poker partners, your parents, your pet parakeet, and worst of all, Sean Penn, Brad Pitt, and Dolly Parton. Everyone! More important, everyone believes it. There is absolutely no reason to question this belief. I mean how do you question Sean Penn and Brad Pitt? Which makes this sacredly held myth a great candidate for Question One. What do you believe that is wrong? Better yet, reframe and flip it on its head and ask yourself the reverse.
Is a high federal budget deficit good—and good for stocks?
Ask that question too loudly and someone may come after you with a butterfly net and commit you to a nice, safe, padded cell. Believing a budget deficit is bad is part of our collective Western-world wisdom and culture—nay, our civic duty. As stated earlier, deficit has the same Latin root as deficient. Why question something believed for thousands of years? Because it's wrong! We are taught as children to regard debt as bad, more debt as worse, and a lot of debt as downright immoral. Right after we finished making paper turkeys for Thanksgiving, we got a cookie, some apple juice, a lecture on the immorality of debt, and then naptime.
As a society, we're morally opposed to debt. We haven't evolved too far from our Puritan forefathers in this regard. And deficits make more debt. Abhorring a budget deficit isn't just an American sentiment. Other inhabitants of Western developed nations fret as we do over deficits. In many places, more so! Come to think of if, they fret over ours, too—more than theirs. Nosy foreigners! Maybe if they spent less time thinking about American debt and more time understanding capitalism they wouldn't have such laggard economies. But I digress.
Is any of this anxiety deserved? Looking at the past 15 years, America has run a federal budget surplus in just four years. During the budget surplus of the late 1990s, the stock market peaked, leading to a bear market and the start of a recession. That recession was fairly short-lived and shallow, but the bear market persisted three years and was huge. Clearly, the budget surplus didn't lead to outstanding stock returns. If there is no empirical evidence supporting the hypothesis (yes, Virginia, it's just a hypothesis) that budget deficits are bad for stocks, could the opposite be true?
It appears so. Figure 1.6 shows the federal budget balance going back to 1947 as a percent of annual gross domestic product (GDP). Anything above the horizontal line is a budget surplus and below is a deficit. We've noted relative peaks and troughs. The counterintuitive truth is stock market returns following periodic deficit extremes have been much higher than surplus peaks or even decreasing deficits.
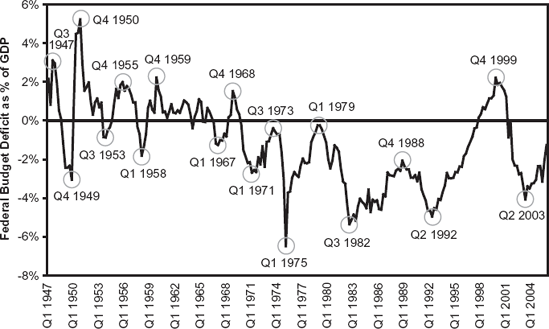
Table 1.2 shows subsequent price returns after surpluses and deficits. Look at the 12-month subsequent returns after budget surpluses and compare with the returns after the deficits. Which world do you want to be living in? The one with the average return of 22 percent, or the one with the average return of 0.8 percent? Now look out over 36-month returns. Those appalling deficits get you an average cumulative return of 36 percent compared with 9.2 percent from the surpluses. Oh, the horror! The plain truth is, since 1947, if an investor had purchased stocks at federal budget deficit extremes, he or she would have seen one-, two-, and three-year returns much higher than average and much higher than if purchased at high budget surplus periods. Buying in the aftermath of budget surpluses would have rendered materially below-average returns.
If you're beginning to think perhaps budget surpluses aren't the best thing to happen to stocks, you're getting it. If you suspect the wry hand of TGH, you're also getting it. Budget surpluses aren't a panacea. They lead to bad markets. Don't wish for them.
Table 1.2. Stock Returns Following Budget Balance Extremes
High Points | Subsequent S&P 500 Price Return | Low Points | Subsequent S&P 500 Price Return | ||||||
|---|---|---|---|---|---|---|---|---|---|
Date | 12 mo | 24 mo | 36 mo | Date | 12 mo | 24 mo | 36 mo | ||
Source: Global Financial Data. | |||||||||
Q3 1947 | Annualized Cumulative | 2.6% 2.6% | 1.6% 3.2% | 8.8% 28.8% | Q4 1949 | Annualized Cumulative | 21.8% 21.8% | 19.1% 41.8% | 16.6% 58.6% |
Q4 1950 | Annualized Cumulatice | 16.5% 16.5% | 14.1% 30.2% | 6.7% 21.6% | Q4 1953 | Annualized Cumulative | 45.0% 45.0% | 35.4% 83.3% | 23.4% 88.1% |
Q4 1955 | Annualized Cumulative | 26.4% 26.4% | 13.9% 29.7% | 3.6% 11.1% | Q1 1958 | Annualized Cumulative | 31.7% 31.7% | 14.7% 31.4% | 15.6% 54.5% |
Q4 1959 | Annualized Cumulative | −3.0% −3.0% | 9.3% 19.5% | 1.8% 5.4% | Q1 1967 | Annualized Cumulative | 0.0% 0.0% | 6.1% 12.5% | −0.2% 0.6% |
Q4 1968 | Annualized Cumulative | −11.4% −11.4% | −5.8% −11.3% | −0.6% −1.7% | Q1 1971 | Annualized Cumulative | 6.9% 6.9% | 5.4% 11.2% | −2.1% −6.3% |
Q3 1973 | Annualized Cumulative | −41.4% −41.4% | −12.1% −22.7% | −1.0% −2.9% | Q1 1975 | Annualized Cumulative | 23.3% 23.3% | 8.7% 18.1% | 2.3% 7.0% |
Q1 1979 | Annualized Cumulative | 0.5% 0.5% | 15.7% 33.9% | 3.3% 10.2% | Q3 1982 | Annualized Cumulative | 37.9% 37.9% | 17.4% 37.9% | 14.8% 51.2% |
Q4 1988 | Annualized cumulative | 27.3% 27.3% | 9.0% 18.9% | 14.5% 50.2% | Q2 1992 | Annualized Cumulative | 10.4% 10.4% | 4.3% 8.9% | 10.1% 33.5% |
Q4 1999 | Annualized Cumulative | −10.1% −10.1% | −11.6% −21.9% | −15.7% −40.1% | Q2 2003 | Annualized Cumulative | 19.1% 19.1% | 6.3% 8.6% | 26.6% 37.6% |
Average | Annualized | 0.8% | 3.8% | 2.4% | Average | Annualized | 21.8% | 13.0% | 11.9% |
Average | Cumulative | 3.5% | 8.8% | 9.2% | Average | Cumulative | 21.8% | 28.2% | 35.9% |
This may not make sense at first blush. Conventional wisdom depicts a deficit as some sort of gigantic anchor, holding down the economy and ramming debt down its over-indebted throat. As consumers, we're careful to not overdraw our checking accounts and believe the government should do the same. Many politicians will have you believe deficits must be reduced, and now. There are no politicians saying more debt is good (although there are often politicians advocating tax cuts which can cause a similar effect).
If you don't know the origin of the word politics, let me enlighten you. The word politics comes from the Greek poli meaning "many" and tics meaning "small blood-sucking creatures." Unless a poli-tic stands up and announces, "I routinely lie, cheat, and steal to help my career and care nothing about you, whoever you are," you should take anything he says with a grain of salt. (Presume you can tell when they are lying because it's when their mouths move.) You may be affronted. Maybe you married a poli-tic. That's not a big problem. Get a divorce! Maybe you're one yourself. I'm sorry—there is nothing we can do for you. You're permanently mentally ill and need a different book.
People have some difficulty with this. You know you dislike any scumbag poli-tic saying things ideologically you dislike. And you know he is dishonest, a slime-ball, and someone if whom your daughter planned to marry you would instead seek a cult deprogrammer to protect her. What you have difficulty accepting is when another poli-tic says things you like and believe in, that he or she is simply lying. (Again, when their mouths move.) Of course, that's just my view. Suppose I'm wrong.
Poli-tics, overwhelmingly, aren't students of capital markets. More than anything else they tend to be lawyers (some exceptions—like Presidents Eisenhower, Carter, Reagan, or Bush. Or even Arnold Schwarzenegger). Don't look to them to be experts in finance or economics. They may be honest enough until they become Beltway blowhards, but still aren't experts on markets and economics and will never use the Three Questions. Poli-tics never think about when they're wrong, how to fathom what others can't fathom, and how to see when their brains are misguiding them. Poli-tics couldn't use the Three Questions if they had to. (Perhaps I've been bombastic for comedy's sake in the past few paragraphs, but you'll be a better investor and sleep better at night if you tune out approximately 97 percent of what poli-tics say.)
That budget deficits are good for stocks isn't a lucky fluke. Economically, it makes sense if you can get yourself to think about debt and deficits correctly. (We cover that in Chapter 6.) For now, suppose budget deficits really are good for stocks in America and surpluses really are bad. If that is true, we ought to be able to see it happening close to the same way in other developed Western nations. That trick is a really nifty one most folks never use. And we do see it overseas.
In other developed nations (as I demonstrate for you in Chapter 6), budget deficits have preceded good stock market returns, and surpluses have preceded gloomier times. This isn't a socioeconomic-political statement. All we are doing is looking at cold hard facts and encouraging you to do the same. Folks who are hamstrung by bias are plagued with misconception and can't see the truth even when it's right there in front of them. Instead, always ask if what you believe is actually false.
The federal budget deficit isn't the only deficit boogeyman getting investors' knickers knotted. The dreaded "triple deficits" never fail to make panic-inducing headlines. As soon as I tell you the budget deficit isn't bad for stocks, your reaction may be dismissal, anger, and then a framework shift—that other deficits, like the trade and current account deficits, must be bad. You've heard it so often. You've also heard they're bad for the dollar.
We look at such assertions in both Chapter 6 and 7, but I'm telling you here and now if you read those chapters, you will become permanently convinced these two forms of deficits aren't bad for stocks or the dollar. I mention this here as another version of something everyone believes that is false. Note you've heard it, accepted it, believed it was true, winced every time a new record trade deficit number was announced but never stopped to ask, "I know I believe it's bad; but is it really and how would I check?" Because you know in your heart, if everyone is wrong, and trade and current account deficits aren't bad for the stock market and the dollar, it would be tremendously bullish because that would be one less thing to fret that to most folks is a huge burden. As Forrest Gump would say, "One less thing!" And that is something you can know others don't.
Part of the reason investors freak out about deficits—budget, trade, and otherwise—is they forget to think relatively (a cognitive error). They hear as of 2006 we have an estimated $423 billion dollar budget deficit.[20] "Holy Cow! That's a lot of moo-laa!" they think. "Four hundred billion??? I don't have four hundred billion. Not even Bill Gates has that much." News editors and talking heads lambaste whomever they think is responsible, using words like "record-breaking," "staggering," and "irresponsible" to describe the deficit's size. Well, duh. Of course it sounds high. But is it? Are our perceptions right?
To see this correctly, the first thing we always have to do is scale. We must look at our budget deficit as a percentage of our overall economy. If you think $423 billion is a lot, what do you think about $13 trillion? That is the size of America's GDP as of July 2006.[21] As a percentage of our national income, the budget deficit is a mere 3.25 percent. What's more, as a historical average, it's nothing to sweat about either. The media won't mention the budget deficit as a percentage of GDP, however, because they assume you're rational and won't get exercised over a budget deficit that is 3.25 percent of our overall income.
This doesn't work just with deficits. Anytime the media tries to scare you with huge numbers, think about it relatively—think scale. Another frequent boogeyman is the cost of the Iraq war, which, at $80 billion per year (including our effort in Afghanistan),[22] will cripple our economy, stall growth for years, and usher in another era of stagflation and presumably sideburns, polyester, and more bad disco music. Eek! The media wanted you, the consumer, to choke on your corn nuts and cry out, "Eighty billion dollars! I'm writing my senator. It's just not worth it." Surprisingly, starting at a relative low point in the market in 2003 just before the onset of the Iraq war, the U.S. market shot up 41 percent, to finish the year a net positive 29 percent.[23] The global market was even rosier at a total return in 2003 of 33 percent.[24]
I'm not here to comment on the validity, or lack thereof, of the war in Iraq or the War on Terror. Not my turf. Smart or stupid as foreign policy, the market knew something the media and most poli-tics didn't want you to figure—$80 billion, or $100 billion, or even $200 billion (if it ends up costing that much) per year just isn't that much compared to the size of the American economic juggernaut. We also must remember, America is just a small part of a much bigger world with a global GDP tending to go the same direction at the same time as America. Later we'll come to think globally, but doing so makes the numbers get bigger still. When faced with large numbers that our brains always want to think are scary, we must scale—we must think relatively. Smart or stupid, the cost of the Iraq war just doesn't matter much economically because it's a tiny percent of American GDP and an even tinier, microscopic percent of global GDP.
Success in investing requires you to question everything you think you know; particularly those things you think you really, really know. Using Question One properly gives you discipline to prevent some basic errors. The ability to just avoid mistakes is key to successful investing. As you examine mythology and begin discovering faulty logic, don't simply correct it once and forget about it. Investing is an applied science, not a craft. If you get a validated answer to a hypothesis, don't assume you can apply the results always and everywhere and get the same result. TGH is an ever-changing opponent requiring constant retesting of hypotheses.
Knowing big federal budget deficits signal good times ahead for stocks is fairly shocking, though undeniably true. Some day, in some future universe, the investing public may relinquish this myth and realize the whole world has been wrong on this point. Should that occur, you will have lost your edge. Then you will no longer know something others don't. When everyone knows federal budget deficits are to be cheered not jeered, the market will efficiently price it in. By using Question One and constantly retesting your investing doctrine, you won't fall prey to such an event, implausible though it is.
You may say (and it's a great thing to say), "But if you tell me in this book the market's P/E has nothing to do with future returns and big budget deficits are bullish not bearish, won't the whole world know? And then won't it stop working?" If the world embraces these truths, then because the market is a discounter of all widely known information, these truths would become priced into markets and knowing them wouldn't help you beat markets. They wouldn't work because you wouldn't know anything others don't widely know. But I'll bet that doesn't happen in 2007. I'll bet most folks who read Chapter 1 will think the notions expressed about P/Es and deficits are so screwy they ignore them completely and fall back on the mythologies. That would be comfortable and easy. Most investors will never see this book, and of those buying it, half won't read it. Of those that do, many won't get past this chapter in disgust. They will reject the truth, prefer mythology, and see me as silly. I hope they do because when I see them see me as silly and wrong, I know I will be able to use these truisms for a long time. If they adopt most of these truisms, I'll need to come up with new ones to know something others don't.
Just as the Campbell-Shiller paper was rapidly embraced and quickly became globally famous and popular because it supported the standard mythology—evidence contradicting market mythologies fortunately tends to be about as noticed as a rock thrown into a lake, a minor ripple followed by near-instant absence from societal memory. This isn't the first time I've written about the high P/E myth. I first started 10 years ago. I'll bet it is as prevalent 5 and 10 years from now as it is today, and you can still make gameable bets on it. But, of course, I could be wrong and then you move onto the next myth. That's life.
The real benefit of Question One is it allows you to know something others don't know by knowing where you otherwise would have been wrong but thought you were right. Once you master the skill of doing this, you will be able to improve yourself forever with it. You can keep learning things others don't know while reducing your own propensity to make mistakes.
Discovering new investing truths is a coincidental result of asking Question One—a lucky accident. If you're purposefully seeking what no one else knows, you must also learn to use and apply Question Two: What can you fathom that others find unfathomable? Even contemplating such a thing seems pretty unfathomable to most people, but that is exactly what we start doing if you simply turn the page and continue to Chapter 2.