
CHAPTER 5
Speech as a Form of Participation: Floor Time and Perceived Influence
Only one thing is more frightening than speaking your truth. And that is not speaking.
—AUDRE LORDE
DO GENDER INEQUALITIES EXIST in deliberating groups? Are they significant? What conditions exacerbate or mitigate these disparities? To answer these questions we measure the amount of talk. But we do not stop there. To understand why talk matters, we examine its effects on the perceptions of influence.
While talk is only one measure of participation in deliberation, and not as informative as the content of speech, it is a crucial measure for the theoretical debates we are addressing. As Sanders writes, “If it’s demonstrable that some kinds of people routinely speak more than others in deliberative settings, as it is, then participation isn’t equal, and one democratic standard has fallen” (1997, 365). Sunstein concurs: “in some deliberative processes, members of lower status groups speak less and are given less respectful attention. If people are not heard, and if they do not speak, both democracy and deliberation are at risk. And if members of certain groups receive less respectful attention, both liberty and equality are at risk” (2002a, 155). And Thompson argues along similar lines that “equal opportunity, random selection, proportional representation, representative sampling, and equal time are among the versions of the standard that may be applied to assess equality” (2008, 506, emphasis added). Equal talk time features specifically as a good measure of equality in Thompson’s critique of an empirical study of deliberation: “A measure of speaking time (by gender, race, education) might be a more useful test of equal participation” (2008, 507). Furthermore, Knight and Johnson define equality in deliberation not merely in terms of the equal formal right to join the meeting but also as the effective opportunity to influence the deliberation (1997). Talk and the influence it begets are thus important measures of equal effective participation.
Despite this importance, quantitative studies of citizen deliberation that analyze the speaking behavior of deliberators are extremely rare (Bryan’s Real Democracy being the main exception). Yet as the theorists cited above argue, and as Mansbridge (1983) has emphasized, speech is a crucial type of political act in a democracy, and all the more so in deliberative settings. Specifically, the more a person speaks, the more authority they may carry, so inequalities in voice may translate into inequalities in the dynamic of deliberation. And as we discussed in chapter 1, it is just this inequality that theorists who critique deliberation claim exists in deliberation.
A critic of this standard of equal talk time might respond that chattiness is not only produced by inequality but may also be a randomly distributed personality dimension. If the amount of talk is mostly determined by the vagaries of individual idiosyncrasies, then a person’s proportional floor time is irrelevant to normative criteria of equality. Our response is that if a person’s share of the group’s discussion rests in significant measure on the status of the person’s social membership, then talk is not mere chattiness. And then the principle of equal deliberation comes under significant threat.
Another counterargument is that authority produces less talk, not more. When an individual has a great deal of authority, they have no need to say much—the mere indication of the person’s preference winds down the debate. A variation of this argument is that a quiet person may carry a great deal of influence by adopting a concise style and allowing the power of their incisive ideas to do the work. Many people have experienced groups in which the most influential person in the room affects the group’s decisions with a few well-chosen or well-timed words. However, the evidence we present will show that this dynamic is the exception, not the rule.
Instead, we find that in a formal discussion, the proportion of talk is a robust indicator of authority. This evidence is consistent with other studies. For example, when an individual is arbitrarily assigned to be in a formal position of authority in a group, they talk more. This elegant finding is demonstrated in an experiment in which investigators assigned a randomly selected member to be the group’s spokesperson; even though the selection was random, and the selected were no better leaders, they talked much longer than the other members (Shelly et al. 1999; see also Cappella 1988; Johnson 1993). That is, when a person believes they have authority, they talk more. Talk becomes an indicator of an objective measure of power.
Furthermore, because talk is shaped by status, it in turn signals status (Fiske 2010).1 For example, in one experiment, talk participation was more correlated than the speaker’s actual expertise with the perceived influence of the speaker, even though the group’s task required expertise and had a correct objective solution (Bottger 1984; Dubrovksy, Kiesler, and Sethna 1991). And as we reviewed in chapter 3, various studies find that when the interaction involves people in a position of unequal status, the member with higher status speaks more. Put differently, if men tend to be “loquacious” and women tend to be “timid” during discussions of matters of common concern, and talk begets power, then women are disadvantaged by their quiescence.2 Consequently, if men speak more than women in settings where speaking is the mechanism for deciding matters of common concern, then speaking becomes an indicator of illegitimate inequality in deliberation. Deliberative design may thus need to concern itself with equal opportunity to speak and with the equal use of that opportunity, much as democracies concern themselves with the formal right to political expression and with ameliorating socially based inequalities in who actually engages in such expression (Burns, Schlozman, and Verba 2001).
In order to characterize the extent and conditions that give rise to inequality in deliberation, we need to examine the volume of voice and the patterns of silence. To fully understand gender inequalities, in other words, we need to look inside the black box of deliberation.
In this chapter we ask whether the critics are correct that women participate less than men during deliberation and thus have less perceived influence in it. We also ask whether the pervasive effort to increase descriptive representation—that is, the proportion of women—raises women’s deliberative voice (speech participation) and authority (perceived influence). We provide the first rigorous test of these claims with a large data set of deliberating groups randomly assigned to treatments, and we link individuals’ speech with pre- and postdeliberation preferences and attitudes. Moreover, we find support for our own interaction hypothesis: the number of women matters, but it interacts with the group’s decision rule. Institutional rules governing deliberating groups affect equality.
HOW WILL GENDER COMPOSITION AND DECISION RULE AFFECT TALK TIME?
As we elaborated in chapter 3, we begin with gender role theory. This theory argues that in groups where women discuss matters of common concern with men, women tend to defer to the assumed expertise or displayed confidence of men. Men tend to be perceived as more competent and to enjoy a higher status than women in discussions of what are perceived to be masculine subjects, including politics (Ridgeway and Smith-Lovin 1999; Sanbonmatsu 2003). Consequently, when women discuss political or legal issues in mixed-gender groups, they may speak less, feel less confident, and exercise less influence than men do, and the more men there are, the more this gender gap grows.3 In addition, as chapter 3 detailed, gendered dynamics of interaction shift with gender composition. Groups with many women tend to adopt communication characteristics associated with femininity, while groups with many men tend to adopt masculine norms of interaction. Gender role theory provides two specific sub-hypotheses, which we introduced in chapter 3 and now briefly review again.
The first and most general is minority status: numerical minority status affects women’s status in the group and thus their participation and authority in group discussion.4 We might expect a gender gap in participation and authority in groups where women are a minority, where there are more active, confident participants to which the women defer, or where masculine norms of interaction might depress women’s participation.5 Both the explanation grounded in confidence and the explanation grounded in group norms lead to the same prediction: the gender gap will shrink as the number of women in the group increases.6
Minority status holds, then, that women are worse off when they are few and that men do not experience these difficulties to the same extent. This perspective thus implies a corollary that addresses the most highly imbalanced gender compositions and that we label as token. Women may be especially disadvantaged when they are the lone female member of their group (Johnson and Schulman 1989; Taps and Martin 1990). Men will not suffer the same disadvantage when they are the gender token (Craig and Sherif 1986). Therefore, “token” women’s participation and authority will be lower than “token” men’s.
Two alternatives to gender role theory contradict the token corollary. First, equal disadvantage argues that extreme minority status affects men and women similarly because it emphasizes the salience of the individual’s gender, leading to more negative stereotypical judgments (Kanter 1977a and 1977c). Thus token men and women participate at equally low levels. Second, violated entitlement asserts that men may be more negatively affected than women by numerical minority status because they are less familiar with it. When men are in a small minority, their expectation that they be more influential than women is violated and their sense of confidence may lessen. Women may be more familiar with being less influential than men and may not be affected as much by their token status (Chatman and O’Reilly 2004; van Knippenberg and Schippers 2007). Thus token men will participate less than token women.
The second hypothesis from gender role theory is the enclave hypothesis: women flourish in all-female settings. Because women are disadvantaged in political discussions with men, they may do best without any interactions with men and may benefit most from their own discussion space (see also Karpowitz, Raphael, and Hammond 2009 on theorists’ advocacy of protected settings for disempowered minorities). Thus women’s participation and authority will be higher in all-female than in gender-mixed deliberating groups.
In summary, gender role theory produces two hypotheses—minority-status and enclave—and a corollary to the minority-status hypothesis, token. They share the premise that women in more masculine situations will do more poorly than men in their group or men in the minority, all the more so the fewer women there are.
The gender role hypothesis is the reigning theory in the literature on gender and discussion. It has received much attention and support. However, we argue that it is incomplete and only partially accurate. Institutions and norms can erase the inequalities that low numbers produce or interfere with the potential advantages of high numbers. Specifically, we focus on the group’s decision rule, and the ways it acts in combination with women’s numbers. As explained in chapter 3, we call this the interaction hypothesis.
The interaction hypothesis begins with the claim that unanimous rule produces a group dynamic in which various types of numerical minorities—including social identity minorities—are included. Conversely, majority rule may signal that the group will operate on the principle of power in numbers. Consequently, minority women do better under unanimous than majority rule. Unanimous rule requires the minority for a decision and thus brings all voices into the conversation, while majority rule means that majorities can make decisions without the minority, and thus excludes them. As a result, when women are a minority the gender gap within the group will be smaller under unanimous than majority rule. But minority men also do better under unanimous than majority rule. Because unanimous rule causes majority women to attempt to be more inclusive of men, these women do not increase their participation. That is, under unanimous rule, majority women do not leverage the advantage of numerical majority status and they participate no more than minority women who use that rule. The inclusiveness effect of unanimous rule also explains why majority women are worse off under unanimous than majority rule, where women are not encumbered to the same extent by the norm of inclusiveness.7
In sum, our interaction hypothesis makes the following predictions: Women underparticipate compared to men in the group either as minorities under majority rule or as majorities under unanimous rule. Minority women participate more under unanimous than majority rule, while majority women do the reverse. Minority men will also do better in groups deciding unanimously than by majority rule. Thus our interaction hypothesis significantly qualifies the minority status and token hypotheses of gender role theory. Our hypothesis makes the same prediction that gender role theory does about the benefits of increasing numbers of women, but only under majority rule. It contradicts gender role theory by arguing that minority women are not inevitably unequal when they are a minority, because unanimous rule protects them. Finally, it adds predictions about the advantages of minority men and the disadvantages of majority women under unanimous rule.
Controlling for Other Explanations
One virtue of our research design is that it allows us to test other explanations for the participatory dynamics of groups. Opposing both gender role theory and our interaction hypothesis are two alternative possibilities. One is preferences: differences due to gender are spuriously caused by preferences or attitudes correlated with individual gender. We discussed this possibility in chapter 4, but recap it here briefly. We are examining deliberation about redistribution, so preferences over the principles of redistribution or attitudes about egalitarianism are relevant. Simply put, a person may speak more, or less, because they have a more liberal, or more conservative, general view about redistribution, and not because the person is a man or a woman or is surrounded by more men or women. Controlling for these preferences is important because they are correlated with gender (Crowder-Meyer 2007; Shapiro and Mahajan 1986). The other alternative hypothesis, efficiency, is that women are quiet not because of gender disadvantage or gendered communication but because others are articulating their preferences. If one’s preferences are already voiced, efficiency dictates that there is no need to waste time or effort on repetition. This would happen if women are members of the preference majority in the group, when the discussion is likely to proceed in their preferred direction. For that reason, to get at the more “pure” effects of gender and gender composition, we control on whether the individual shares the same preferences as the majority in the group. These controls thus help us to isolate the effects of gender, as opposed to other elements of an individual’s relationship to the group.
THE EFFECTS OF COMPOSITION AND RULE ON SPEECH PARTICIPATION
Advocates of deliberation argue that they “create an environment in which [gender or class] inequalities in the broader society do not distort the deliberative process” (Fishkin et al. 2010, 8–9). Critics argue that deliberation entails the “the systematic disregard of ascriptively defined groups such as women” (Sanders 1997, 353). Which is more accurate? Specifically, does deliberation produce gender equality or inequality? To answer these questions, we divide the number of seconds each individual spoke by the group’s total number of seconds to construct an individual’s Proportion Talk (scaled 0–1). This allows contrasts across groups with varying total talk times. (Descriptive statistics, question and response wordings, and scaling information for all variables are in the online appendix.)
Table 5.1: Average Individual Proportion Talk by Gender and Experimental Condition
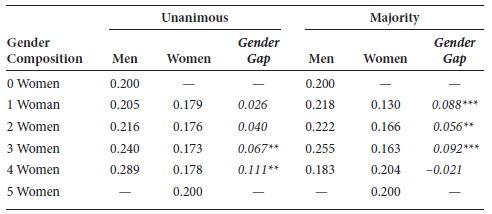
Note: Gender gap is the average male Proportion Talk minus average female Proportion Talk in each condition. Positive numbers indicate male advantage. Stars indicate gender gaps significantly different from 0. *** p < 0.01, ** p < 0.05, * p < 0.10, one-tailed unpaired difference of means test, group-level analysis.
Table 5.1 shows, for each condition, the average male Proportion Talk, the average female Proportion Talk, and the difference between them (with associated group-level t-tests). If men and women participated at equal rates in a five-person group, the average individual Proportion Talk for each gender would be 0.20 (in other words, the average male and the average female would each take 20% of the conversation), resulting in a gender gap of 0.8 But in five of the eight conditions, the t-test indicates a nonzero gender gap (always favoring men), confirming the critics and disconfirming the advocates.
Figure 5.1 shows the magnitude of the gender gap more clearly, displaying the ratio of the average female to the average male Proportion Talk in each condition. In most of the conditions women’s participation is less than 75% of men’s; in three of the eight conditions it is less than two-thirds of men’s. This is consistent with the broader literature on women’s participation we reviewed in the opening chapters. The critics of deliberation have cause for concern—women often participate less than men, sometimes substantially so. Of particular concern is that the high gender gap obtains in the most common configuration in political settings—minority women under majority rule.
But these results also show that the inequality varies with the group’s decision rule and gender composition, consistent with the interaction hypothesis. Table 5.1 largely disconfirms gender role theory’s minority status hypothesis, which predicts equality in the four conditions where women are a majority and inequality in the four conditions where they are a minority; only three of these eight predictions are confirmed. But table 5.1 confirms seven of the eight predictions of the interaction hypothesis. Under majority rule, there is a large and significant gender gap in the one- and two-female conditions but not in the four-female condition. Under unanimous rule, we see the reverse: a large and significant gender gap in the three- or four-female conditions but not in the one- and two-female conditions. Larger numbers help women under majority rule but not unanimous rule.

Figure 5.1. Ratio of average female to average male Proportion Talk. Note: A ratio of 1 means equality of speech participation.
Observing how the behavior of women changes within each decision rule also bolsters this conclusion. Table 5.1 shows that under unanimity, the average woman accounts for a little less than 18% of the conversation no matter what the gender composition of the group. Under majority rule, the average woman’s Proportion Talk moves from a mere 13% of the conversation in groups with only one woman to over 20% in groups with four women—a substantial and statistically significant difference (p = 0.02, one-tailed). This contingent effect of gender composition is not anticipated by gender role theory, but is predicted by the interaction hypothesis.
A small anomaly is the disconfirmation of one of the eight predictions of the interaction hypothesis: under majority rule, women underparticipate men in the three-female groups.9 Our interaction hypothesis does not predict an exact functional form for the relationship between gender composition and speech participation, leaving open the possibility that women’s disadvantage is sufficiently powerful that it requires a supermajority to overcome. It is also quite possible that the result for the three-female groups is simply noise. We are reassured that the movement toward equality in the four-female groups is large and statistically meaningful. In our view, the unexpected result for the three-female groups qualifies, but does not undermine, our interaction hypothesis. The main conclusion remains: gender composition matters largely as expected by the interaction hypothesis.
Having shown a pervasive but contingent gender gap, we directly test the minority status and interaction predictions about what increases or decreases the gap, using OLS with group-level data (table 5.2).10 The dependent variable is the Gender Gap in Speech Participation (scaled –1 to 1), which is the difference between the group’s average female and average male Proportion Talk.11 There is no statistically significant effect of gender composition in Model 1, which includes no interaction terms, disconfirming gender role theory’s minority status prediction. Model 2 confirms the interaction hypothesis: the coefficient on the number of women and the interaction term of number of women and majority rule are each in the expected direction, statistically significant, and substantively large. As the interaction hypothesis predicts, only under majority rule does the gender gap shrink as the number of women increases; the reverse effect obtains under unanimous rule. Furthermore, consistent with the interaction hypothesis, unanimous rule mutes the gender gap in the group when women are few. We see this in part from the coefficient on the majority rule variable, which is large, significant, and positive. When we combine that with the effect of gender composition, we find that in groups with one woman, a larger gender gap is present under majority rule than unanimous rule.12 Small numbers are not destiny for numerical minority women.
Table 5.2: Determinants of the Gender Gap in Speech Participation in Mixed-Gender Groups (Group-Level Analysis)

Note: Dependent variable for all models is Gender Gap in Speech Participation. Standard errors in parentheses. *** p < 0.01, ** p < 0.05, * p < 0.1, one-tailed test.
The results hold when controls for the preferences hypothesis, an alternative explanation to the interaction hypothesis, are included (Model 3, table 5.2). The preferences hypothesis predicts that the effect of gender composition is the spurious result of the group’s redistribution preferences or general egalitarian attitudes that are correlated with the group’s gender composition.13 To test this possibility, we added to our interactive model three variables measured prior to deliberation: the number of group members who scored above the scale midpoint (nearly identical to the mean) on general egalitarianism, the number who favored no redistribution, and the number who favored very high levels of redistribution from rich to poor (see the online appendix for details of all measures). The effect of the interaction between decision rule and gender composition remains strong and statistically significant in the presence of these controls, disconfirming the notion that the gender gap is primarily explained by the preferences or attitudes of group members.14 Patterns of participation are tied to the interaction of rule and gender composition, even when we take the attitudes of the group members into account. This strong effect for the interaction between gender composition and decision rule continues to hold even when we examine fully saturated models that interact controls for egalitarianism or for preference about redistribution with decision rule (see Models 4 and 5). The protective effect of unanimous rule for minority women also holds with controls, evidenced in part by the positive and (nearly always) significant majority rule coefficient and confirmed by predicted values from the models. No matter what set of controls we employ, the gender gap is significantly larger under majority rule than under unanimity in groups with one woman.15 Gender composition and decision rule are thus the keys to the dynamics of speech participation in our deliberating groups.
Table 5.3 conducts an individual-level test of preferences and of the other alternative to our interaction hypothesis, efficiency. As we detailed in chapter 4, we use OLS regression with cluster robust standard errors since individuals are nested within groups.16 The dependent variable is individual Proportion Talk (scaled 0–1). Model 1 is the individual-level test of our interaction hypothesis and includes individual gender, gender composition, decision rule, and interactions between those variables in mixed-gender groups.17 Model 2 adds control variables to test efficiency and preferences. According to the preferences hypothesis, women speak less regarding redistribution not because they are women affected by reason of their gender’s numerical status, but because they have more generous attitudes about redistribution, and what appear to be gender differences may be due to differences in these attitudes instead. Therefore, we include a measure of the individual’s predeliberation level of egalitarianism.18 Table 5.3 also tests the efficiency hypothesis—that women speak less because they are part of the group’s predeliberation preference majority, when they are satisfied with the direction of discussion, not because of the group’s gender composition and decision rule. We thus include a dummy variable tapping whether the individual’s predeliberation preferences about redistribution matched the group’s predeliberation majority preference.
Table 5.3: Determinants of Speech Participation in Mixed-Gender Groups (Individual-Level Analysis)
|
(1) |
(2) |
Female |
–0.001 |
0.000 |
|
(0.049) |
(0.049) |
Majority Rule |
0.045** |
0.043** |
|
(0.024) |
(0.024) |
Female × Majority |
–0.112** |
–0.112** |
|
(0.064) |
(0.063) |
Number of Women |
0.023** |
0.024** |
|
(0.012) |
(0.012) |
Female × Number of Women |
–0.023 |
–0.023 |
|
(0.020) |
(0.020) |
Majority × Number of Women |
–0.024* |
–0.023* |
|
(0.015) |
(0.015) |
Female × Majority × Number of Women |
0.046** |
0.046** |
|
(0.025) |
(0.025) |
Egalitarianism |
|
–0.034 |
|
|
(0.035) |
Match Group’s Predeliberation Preferences |
|
0.002 |
|
|
(0.011) |
Constant |
0.178*** |
0.191*** |
|
(0.019) |
(0.025) |
Observations |
320 |
320 |
R-squared |
0.067 |
0.070 |
Control for Outlier |
Yes |
Yes |
Control for Experimental Location |
Yes |
Yes |
Note: Dependent variable for both models is individual Proportion Talk. Cluster robust standard errors in parentheses. *** p < 0.01, ** p < 0.05, * p < 0.1, one-tailed test.
Both models confirm the interaction we expect: under majority rule, women talk more, relative to men, as the number of women increases (seen in part in the positive and strongly significant Female x Majority x Number of Women term). Predicted values from the model with controls confirm that the findings from basic t-tests persist in the presence of controls: women’s average Proportion Talk increases from a low of about 13% of the conversation in majority-rule groups with only one woman to over 20% of the conversation in groups with four women. In majority-rule groups, the estimated difference between the Proportion Talk of men and women is large (9 percentage points) and significant (p < 0.01) in groups with a token woman, but small (2 percentage points, favoring women) and not significant (p = 0.26) in groups with a token man.
Also consistent with the interaction hypothesis, when women are few, unanimous rule elevates their volume of speech relative to majority rule.19 In addition, under unanimous rule, women’s participation holds steady as the number of women increases, but men’s participation increases, creating a widening gender gap (for a visual representation see chapter appendix figure A5.1). Predicted values from the model show that the size of the predicted gender gap in speaking behavior increases nearly fivefold as the number of women increases under unanimous rule, even when controls are included.20 Efficiency and preferences predict that these effects of gender composition and rule will disappear when controls are added in Model 2, but these predictions are disconfirmed.21 This evidence thus undermines the alternative explanations that women are speaking less than men only because (1) they have different preferences than men or (2) they do not take the trouble to speak because others already articulate their ideas, as may occur when they are the preference majority. The gender gap is due to the difference between women and men in responses to the gendered dynamics in the group, as the interaction hypothesis predicts.22
These findings—that decision rule and gender composition depend on each other—are supported by a second measure of how the talk time within each group is distributed. For each group, we computed a Gini coefficient, which is a well-known measure of inequality—in this case, inequality in the talk time within each group. Lower Gini coefficients represent less inequality. Participants noticed when the group’s talk was distributed more equally. In groups with lower Gini coefficients, participants were significantly less likely to agree that “a few people dominated the discussion.”23 Using this second measure, we find the same pattern: under majority rule, group talk times are more equally distributed as the number of women in the group grows (see chapter appendix table A5.1, Model 1). Under unanimous rule, the effect runs in the opposite direction (though the increase in inequality does not reach significance), with the highest levels of inequality to be found in groups with four women, so that again, unanimous rule alleviates the gender gap when women are few but not when they are many.
The same pattern can be found if we separate the genders and focus on how women’s talk time is distributed among the women in groups with at least two women (chapter appendix table A5.1, Model 2).24 We find that under majority rule, as the number of women grows, the Gini coefficient for women falls, meaning that talk time among the women in the group is more equally distributed. The most equal distributions of women’s talk time—those with the lowest Gini coefficients—are found among majority-rule groups with many women.25 Put differently, this analysis shows that not only are women accounting for more of the conversation as their numbers grow, they are also sharing the floor time more equally among themselves. Under unanimous rule, the effect of women’s numbers is the reverse.
Whether the dependent variable is the gap in average talk time or the Gini coefficient, the results are the same. Women speak more and share the floor in more egalitarian ways as their numbers increase under majority rule. This increased willingness to share the floor equally applies to the women in the group and to the group as a whole. Under unanimous rule, women achieve equality of floor time (and a more equal sharing of the floor among themselves) when women are few, and the greatest inequalities occur in mixed-gender groups with many women. Groups where the combination of numbers and rule has equalized women’s status produce a more egalitarian discussion process.
The token corollary from gender role theory also makes specific predictions about women who are the lone females in their groups: that they will be uniquely disadvantaged compared to token men. By contrast, the equal disadvantage and violated entitlement hypotheses predict that token men participate equally or less than token women. Table 5.4 tests these three competing hypotheses by analyzing the Proportion Talk of tokens. As the results in the table show, violated entitlement and equal disadvantage are disconfirmed, and gender role theory’s token is supported: the “female” term is negative in Models 1, 2, and 3. Female tokens talk less than male tokens, whether the decision rules are analyzed separately or pooled. On average, the difference is about 9 percentage points. However, as the interaction hypothesis predicts, Model 3 shows that token males and females each perform better under unanimous rule than under majority rule (see the negative, significant coefficient on the “majority” term). The difference-in-differences in the effect of decision rule on the two gender tokens, represented by the interaction term in Model 4, is not statistically significant; in other words, the effect of unanimity is roughly the same for men and women. This equal effect, combined with unequal starting points under majority rule, means that unanimous rule elevates the token male above his female group members while it equalizes the token female with her male group members. As the interaction hypothesis predicts, unanimous rule helps minority women but hurts majority women.
Table 5.4: Effects of Gender and Decision Rule on Token Speech Participation (Group-Level Analysis)

Note: Dependent variable for all models is Proportion Talk. Standard errors in parentheses. *** p < 0.01, ** p < 0.05, * p < 0.1, one-tailed test.
Figure 5.2 explores the enclave, the final expectation from gender role theory: that women do best in their own all-female discussions, away from the forces that produce gender inequality, while men do not benefit in this way. Here we use Talk Time, men’s and women’s average talk time in the group in minutes, since it allows us to examine the gender-homogeneous groups.26 Consistent with the enclave thesis, female participants do tend to talk longer when surrounded only by other women.27 The average woman talks more in enclaves than in the pooled majority-female groups (significant at p < 0.04, one-tailed, group-level test and at p < 0.01 in a one-tailed test with individual-level data). This test is not significant for men. Further evidence in favor of the enclave thesis comes from the Gini coefficient: women in enclave groups also distribute their talk quite equally—under majority rule, about as well as groups with four women, and under unanimous rule, much more equally than groups with four women. Enclaves seem to provide some benefit to women, and not to men, as the enclave hypothesis predicts.

The final evidence regarding enclaves comes from the group’s overall length of discussion. When we explore the group’s total talk time, we also find evidence that groups composed entirely of women speak longer than all other groups. The average discussion time for female enclaves is about 22% greater than the average for all other groups (pooled). This difference is marginally significant at p < 0.10 (one-tailed group-level t-test), and average talk times are longer in women’s enclaves across both decision rules.28 Results hold in regression models that also control for decision rule and experimental location. Group talk times for all-male groups are indistinguishable from the length of mixed-gender discussions (pooled). Clearly, women’s quiescence in mixed-gender groups is not because they have nothing to say; under the right conditions, they are willing to talk for much longer than they do with men.
The evidence shows that rules and numbers both significantly affect women’s relative contribution to the group’s central activity—its talk. Why is that? It is not because the number of women happens to stand in for what really matters—the number of individuals who prefer that the group make the more egalitarian decision. Rather, it is because the rule and the numbers create norms of interaction. We shall have more to say about that in later chapters, but for now, we can point to one piece of evidence that rules beget norms. If unanimous rule works in part by signaling the need for more inclusion, as we contend, then we should observe longer talk times in groups told to use that rule. And that is what we find—unanimous rule prompts mixed-gender groups to talk somewhat longer.29 Putting all these findings together, we can conclude that rules and gender composition work because they set in motion interaction norms, not merely because they affect an individual’s strategic behavior regardless of gender.
THE CONSEQUENCES FOR PERCEIVED INFLUENCE
As we have argued, speech participation matters because it may produce authority, specifically, perceived influence. We have two measures of influence: self-assessments and the assessments of the other group members.30 For self-assessments, immediately after the discussion we asked each participant to gauge the extent to which his or her “voice was heard during the group discussion” and the extent to which his or her “opinions were influential in shaping the group discussion and final decision.” The response options were: strongly disagree (coded 0), disagree (coded 0.25), neutral (coded 0.5), agree (0.75), or strongly agree (coded 1). Table 5.5 presents the effect of Proportion Talk on these two measures, separately for men and women. We control for the number of egalitarians in the group, for individual egalitarianism, for the respondent’s predeliberation sense of confidence in his or her ability (to try to isolate the effect of speech during discussion) and for whether the respondent’s preferred principle was chosen by the group (to distinguish the effect of speaking from the group’s decision).31
Table 5.5: The Effect of Proportion Talk on Self-Efficacy, Mixed-Gender Groups Only (Individual-Level Analysis)
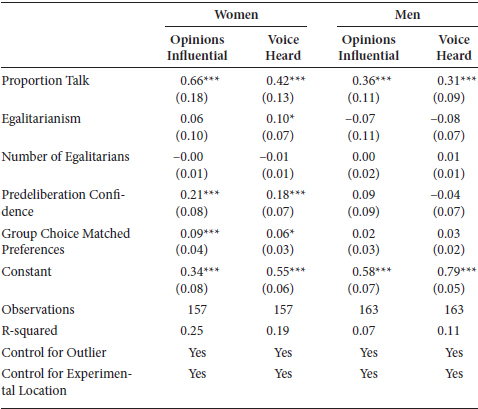
Note: Cluster robust standard errors in parentheses. *** p < 0.01, ** p < 0.05, * p < 0.1, one-tailed test.
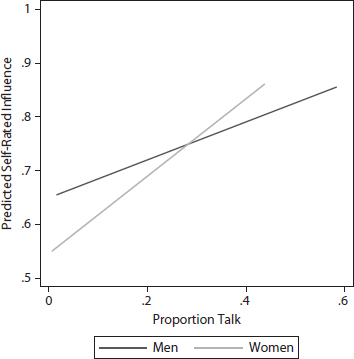
Men as well as women build their self-efficacy on their quantity of talk, but women do so more than men. Figure 5.3 displays the predicted values for the “opinions were influential” question, which are restricted to the maximum and minimum value of Proportion Talk for each gender. As the figure illustrates, women are more strongly affected than men, a result confirmed by the coefficients in table 5.5 for the influence question.32 Women’s coefficients are about double the size of men’s, with the difference-in-differences between the genders significant at p < 0.05 (one-tailed test). The gender differences in the effects of speaking behavior on the “voice was heard” variable are also large and in the expected direction but fall short of statistical significance (p < 0.12, one-tailed).33 The key point is that those who speak more are much more likely to feel that others listened and that they made a difference in the group, and some evidence indicates that speaking more is especially beneficial to women.34
Moreover, we also find evidence of a direct relationship between the experimental conditions and self-efficacy. In the conditions in which women are more empowered—majority rule with many women and unanimous rule with few women—women are more likely to feel that their “voice was heard” during group discussion (see chapter appendix table A5.2). Although the effects are not huge—few participants walked away from the lab discussions feeling deeply alienated or upset—we again see the familiar interaction pattern.35 When women are numerous, they provide more positive assessments under majority than unanimous rule. The reverse happens when women are few, where unanimous rule makes women more likely to strongly agree that “my voice was heard.” More empowering conditions grant women a higher sense of efficacy as deliberators. Among men in mixed-gender groups, for assessments of “my voice was heard,” we see the mirror image of the effects of the conditions on women. Just as minority women are more likely to feel heard under unanimous than majority rule, the same is true for minority men. In sum, when it comes to feeling heard, both men and women are more likely to feel efficacious when the conditions empower their gender.
If speaking up during the discussion can build standing and authority, we should see those effects not only in the participants’ own self-assessments but also in the way others in the group saw each member. We measured Influence after discussion by asking each group member to indicate the (one) person who was “most influential” in the group’s discussion and decisions.36 We tallied the number of votes each individual received from other group members, a measure that runs from 0 to 4. Influence is thus our measure of how other members of the group saw each individual.

Figure 5.4. Proportion Talk’s effect on perceived influence. Note: Figure represents the predicted values generated from a negative binomial regression. The results are as follows: Influence (0–4) = -1.86 + 5.80 (Proportion Talk, SE = 0.49) + 0.33 (Predeliberation speaking confidence, SE = 0.24) + 0.40 (Predeliberation preference matched group outcome, SE = 0.11) + 0.17 (Female, SE = 0.11) + 0.17 (Experimental Site, SE = 0.06) + 0.10 (Outlier, SE = 0.05). N = 470. Log Pseudolikelihood = -515.49. Cluster robust standard errors. Own votes are excluded from the dependent variable.
Figure 5.4 shows the effects of deliberative participation on Influence. As in the previous figure, the lines for men and women only extend as far as the maximum value of Proportion Talk found in the data for each gender. The figures derive from the model whose coefficients are provided with the figure.37 The unit of analysis is the individual, with cluster robust standard errors. We include controls for predeliberation confidence in one’s own speaking ability (see the online appendix for wording) and whether or not the individual’s predeliberation preferences matched the group’s eventual decision as controls on individual gender.38 Participants who held the floor for a greater percentage of the group’s deliberation were more likely to be seen as influential by the other members of the group. The active use of voice translates into greater perceived influence for men and women, as we expect.

Figure 5.5. Gender Gap in Perceived Influence, by experimental condition. Note: The Gender Gap in Votes Received is the average number of influence votes in the group for men minus the average number of votes in the group for women. Positive numbers thus indicate an advantage for men; negative numbers indicate an advantage for women. The y-axis is reversed so that women’s disadvantage appears as numbers below the dashed line of equality.
And again, the experimental conditions help to produce these effects. Figure 5.5 illustrates the predicted interactive effect of rule and composition on the Gender Gap in Influence.39 In table 5.6, we test our interaction hypothesis using the same group-level OLS models we used to test the Gender Gap in Speech Participation, this time with the Gender Gap in Influence as the dependent variable (the average number of influence votes in the group for men minus the average number of votes in the group for women, scaled –4 to 4). Model 1 tests the minority status hypothesis, and just as in our analyses of speech participation, we again find no significant effect of the number of women in models that do not include an interaction term. Model 2 adds the interaction effect and yields strong evidence that the gap in influence narrows as the number of women increases under majority rule, but expands significantly in groups with more women under unanimous rule. Model 3 adds the familiar controls from the alternative hypotheses, efficiency and preferences, which again receive no support.40 As the interaction hypothesis predicts, the interaction term is significant whether or not the controls are included.
Table 5.6: Determinants of Gender Gap in Influence (Group-Level Analysis)

Note: Dependent variable for all models is Gender Gap in Influence. Standard errors in parentheses. *** p < 0.01, ** p < 0.05, * p < 0.1, one-tailed test.
To better illustrate the magnitude of the interactive effect, consider who wins the influence vote count; when women are the majority, a woman is much more likely to win under majority rule (73%) than unanimity (53%), but as the minority, women win more often under unanimous (25%) than majority rule (13%).41 Women’s low influence ratings in the groups with few women and majority rule are striking. In majority groups, no token woman ever wins. Influence within the group is thus structured by the interaction of gender composition and decision rule, as the interaction hypothesis predicts; the same conditions that create disproportionate silence by women also create disproportionate authority for men.
The remaining question is whether speaking behavior mediates the effect of the conditions on influence, as the interaction hypothesis leads us to expect. Baron and Kenny (1986) suggest that a test of mediation includes three models: one that shows a relationship between the conditions and the Gender Gap in Speech Participation, another that shows a relationship between the conditions and the Gender Gap in Influence, and a third that shows a smaller or nonexistent relationship between the conditions and the Gender Gap in Influence when the Gender Gap in Speech Participation is included in the model. We have already reviewed the results of the first two models. The remaining model is Model 4 in table 5.6, which shows that the interaction in Model 2 disappears once the Gender Gap in Speech Participation is included. Thus the effect of the conditions on influence is mediated by speech participation. The conditions affect how much men and women speak, which in turn shapes their influence within the group.
We employ the formal test of mediation of Imai, Keele, and Tingley (2010). Table 5.7 shows that a significant percentage of the effect of our interacted experimental conditions on the Gender Gap in Influence—59%—is mediated by the Gender Gap in Speech Participation.42 A Sobel test yields similar results. Together, the regressions and mediation tests show that speech matters—it affects influence.43 Conditions that increase speech increase influence and thus authority, and they do so in interaction, as the interaction hypothesis predicts.
SUMMARY
Our analyses provide mixed support for gender role theory. Our first supportive finding is that women are often disadvantaged in speech participation, while men are never disadvantaged. Second, women participate less than their equal share when they are a minority and at equal rates when in a large majority (at least under majority rule). Third, women tend to do best in enclave groups. Fourth, female tokens participate less than male tokens. Finally, women’s influence gap shrinks as their numbers grow (under majority rule). Further support for gender role theory comes from disconfirmation of the competing hypotheses to the token corollary, equal disadvantage and violated entitlement, and from its ability to withstand the effects of controls on predeliberation attitudes and preferences.
Table 5.7: Results of Mediation Analysis
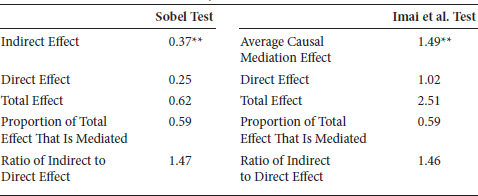
Note: The analysis shows how much of the effect of the interaction between gender composition and decision rule (Unanimous*Number of women) on the Gender Gap in Influence is mediated by the Gender Gap in Speech Participation. Analyses are group level; models include main effects for group gender composition and for decision rule, controls for outlier group and experimental location. Asterisks indicate a statistically significant mediation effect. ** p < 0.05, two-tailed test.
However, opposite to the expectations prompted by gender role theory, in groups assigned to unanimous rule, women approach equality in voice and authority when in the minority. Unanimity substantially boosts the speech participation of minority women, relative to majority rule. Finally, and most troublesome for the gender role hypothesis, under unanimous rule, the gender gap in voice and authority is biggest when women are a majority, not a minority.
The interaction of decision rule and group gender composition best explains this pattern of results; the gender role hypotheses about gender composition are largely correct under majority rule but largely incorrect under unanimous rule. Unanimous rule protects minority women, and under this decision rule they take up their equal share of the conversation, but it is a double-edged sword because it also protects minority men. Minority women leverage unanimous rule to reach equality, while minority men leverage it to exacerbate inequality. These conclusions about rule would not be possible without interacting it with gender composition. Rule protects or hinders numerical minorities depending on who these minorities are.
Advocates and critics of deliberative democracy posit equal meaningful participation as a necessary requirement of deliberation. Our results show how far actual discussion deviates from that ideal standard, at least in this study, where women speak substantially less than men in most mixed-gender combinations. Further, speech is a crucial form of participation that meaningfully shapes perceptions of authority. As critics of deliberation contend, deliberation can produce inequalities of participation that affect deliberators’ influence.
Unequal time used, not merely unequal speaking opportunities given, is problematic for democratic deliberation especially when it is associated with lower authority. Even if men and women enter deliberation with the same preferences and equal formal rights, the disproportionate exercise of these rights by men erodes the political and civic standing of women, a group not yet equal in society. The evidence that less speech leads to less efficacy and authority lends further weight to the importance of speech as a criterion of equal participation. In deliberative settings, speech is not mere “chattiness”—it is the heart of the group’s purpose and thus represents a meaningful opportunity to build standing and influence with the other members of the group. Our results show that the critics of deliberation are right to worry; inequalities of voice have a strong tendency to translate into inequalities of authority.
The philosopher Miranda Fricker explains why and how deliberation that devalues women matters. According to Fricker, when a speaker’s credibility is given less weight simply because of the social identity of the speaker, this is a form of “epistemic injustice” that wrongs the speaker as a subject of knowledge (2007, 4). Social injustice tends to cause epistemic injustice; the hearer perceives the speaker to be less credible because of stereotypes about the speaker’s identity that create shared, distorted prejudgments about who is credible. Credibility in turn shapes who can exercise power and influence in the dissemination of knowledge and information. The capacity to be a “subject of knowledge,” to be a source of information and wisdom, is “essential to human value,” argues Fricker (2007, 5). The hearer wrongs the speaker by devaluing her as a “giver of knowledge.” This is an important meaning of standing, worth, and authority.
But our point is that this inequality, and injustice, must be understood in light of the gender context and institutional rules within which men and women deliberate, because the effect of gender is contingent on the structure of the group setting. This has direct implications for the debate among political theorists about whether deliberation is a positive force for democracy and its precept of equality or instead undermines the voices of subordinate group members. We suggest that a way to resolve this debate is to focus on the conditions that give rise to one or the other. Both views are empirically correct but contingent on circumstances. The fact that gender inequality disappears under some conditions means that deliberation can in fact meet the standard of equality, as its advocates contend.
Our results allow us to address several alternative explanations. First, one might argue that low talk time is not a problem if it is caused by efficiency—if it occurs when there is no need to repeat what others already say because one is in the preference majority. In response, we showed that women speak less than men whether their preference is widely shared or not. In addition, if women are silent because they are the preference majority, that does not explain the interactive effects.44 Thus less voice is an indicator of less influence, not the product of desire to avoid redundancy with preference allies. Neither is it the result of the judicious exercise of subtle power. Quiet neither reflects nor begets power, but powerlessness.
Second, the controls reassure us that the differences between women and men are not due to a correlated difference in attitudes about redistribution, but to the divergent responses of men and women to the interaction taking place. Third, the rule shapes talk and influence in part by shaping the norm of interaction—unanimous rule does not matter merely because it sets individual strategy, but because it produces a more inclusive exchange. Finally, while randomly distributed chattiness may partially explain why some people talk more than others, it does not explain the gender gap or why it changes as it does. There are likely considerable differences among men and among women, but there is also a difference between the sexes.
One might raise the argument that social equality must be traded off against another important purpose of deliberation—reason and the search for truth. Deliberative advocates rely on public discussion as a path to public enlightenment, or less grandly, as a means to aid the collective search for valid and accurate knowledge that serves group goals. Our response is that in addition to the question of justice, the analysis of talk time sheds light on the question of collective reason. Available evidence suggests that justice does not compromise reason, but that justice serves reason. In a recent study of group problem solving, researchers found that the number of women in the group substantially affects the group’s ability to solve problems collectively—even when accounting for the capacity of the individuals in the group (Woolley et al. 2010).45 The gender composition affects group ability through the members’ average empathic ability. These effects held even after controlling on the members’ intelligence. That is, some groups were “stupider” than the sum of their parts, and that is partly due to the dearth of women, because the presence of more women was correlated with equal talk and with the presence of empathetic people. Neither the group’s average intelligence nor the intelligence of a few brilliant members affected the group’s problem-solving ability; what did affect it was equally distributed talk and a high average ability to empathize, both of which were produced by having lots of women. The implication of these results is that gender inequality matters not only for justice but also for the group’s ability to solve problems accurately. Deliberative theorists often argue that an important mission of discussion is to uncover truth, hence their emphasis on reason and rationality. Gender inequality may undermine that mission, aside from violating the deliberative precept of equal voice.
We will return to the question of external validity later, when we analyze patterns of talk on school boards and in our concluding chapter, but our results so far lead us to some preliminary conclusions about practical implications for policy making to enhance democratic participation.46 It is possible to produce equal voice in citizen deliberation by adopting specific decision rules and assigning deliberators to particular gender compositions. Many government and nongovernmental organizations that run discussions can do so since they control the conditions of deliberation. The results provide some simple guidelines for promoting gender equality of participation and influence. When women are outnumbered by men, use unanimous rule; when women are a large majority, decide by majority rule. To avoid the maximum inequality, avoid groups with few women and majority rule. To minimize male advantage, assemble groups with a supermajority of women and use majority rule. To maximize women’s individual participation, gender homogenous groups are best.47
More generally, the results so far yield important implications. Perhaps most importantly, political science has something unique to add to the study of gender relations: the notion that the institutional rules under which men and women participate in collective decision making have a significant effect on gender dynamics. Studies of women’s representation in legislatures recognize the importance of institutional rules and norms, as we noted in chapter 1. Our results suggest that rules and norms also shape interactions among citizens.
The results also reinforce the notion in several recent studies of political behavior that gender matters but does so contingent on the environment. As we reviewed in chapter 3, Burns, Schlozman, and Verba (2001) find that the gender composition of civic groups can increase women’s level of political information, interest, efficacy, and participation (see also Crowder-Meyer 2010). Our study seconds this finding. Together, these studies’ results imply a conceptual distinction between individual gender and gender composition and other gendered aspects of the setting (see Sapiro 2003). Studies of political behavior or of political decision making may not capture all that gender does if they only account for individual-level gender and omit gender composition and gendered interaction.
In addition, the results add to our understanding of decision rules. Unanimous rule helps not only preference minorities but also identity groups that find themselves a numerical minority in a deliberation. However, there is an asymmetry to the influence of rules on identity groups’ participation. Unanimous rule helps women and men equally, but given men’s advantaged default, it exacerbates the gender gap within the group when men are the minority, even as it shrinks the gap in the group when women are the minority. We also found that while majority rule helps women when they are the majority, it takes a supermajority for the benefit to materialize to women, but a small majority for the benefit to accrue to men. In this sense, the results here underscore the notion that rules work differently for different types of people. To predict the effect of a rule on a group, we must first know who is in it and what are the members’ relative proclivities to speak.
But while the results are in line with some existing hypotheses about gender composition or about institutional rules, our chief result goes beyond the existing literatures. The interdependent effects of gender composition and decision rule in small group interaction have not been a focus of any literature. We find that these effects matter for both men and women, and for the ability of democratic institutions to reach normative goals of equality.
Finally, our results have implications for the debate over substantive or descriptive representation. As Mansbridge (1999) notes, “In theory, deliberation seems to require only a single representative, or a ‘threshold’ presence, in the deliberation to contribute to the larger understanding … in practice, however, disadvantaged groups often need the full representation that proportionality allows in order to achieve several goals: deliberative synergy, critical mass, dispersion of influence, and a range of views within the group” (636). We argue that the same logic applies to the volume of voice. Mansbridge is correct that “getting the relevant facts, insights, and perspectives into the deliberation” is not enough for substantive representation; it is also necessary that many members of the disadvantaged group air those facts, insights, and perspectives, and that they do so more than once.
1 For more on this point, see chapters 3 and 8. Studies of talk time and number of turns taken often cite the early work of Bales (1970) and Zimmerman and West (1975) and include Aries, Gold, and Weigel 1983; Carli 1989; and Karakowsky and Siegel 1999.
2 We borrow here the terms used by Hibbing and Theiss-Morse (2002, 203).
3 See Aries 1998; Bowers, Steiner, and Sandys 2001; Croson and Gneezy 2009; Eagly 1987; Giles et al. 1987; Hastie, Penrod, and Pennington 1983; Huckfeldt and Sprague 1995; Karakowsky and Siegel 1999; Ridgeway 1982; Strodtbeck, James, and Hawkins 1957.
4 Throughout the book, “minority” and “majority” refer to numerical minority status in the group, not to race.
5 Support for the “minority status” hypothesis can be found in Aries 1998; Johnson 1994; Piliavin and Martin 1978; Smith-Lovin and Brody 1989; see also Mendelberg and Karpowitz 2007.
6 No specific functional form is expected and nonlinear effects are not considered disconfirming evidence.
7 See chapters 3 and 4 for details on the hypotheses.
8 For a graphical representation of these patterns, see chapter appendix figure A5.1.
9 Specifically, under majority rule, the three-female condition is not statistically different from the one-female or two-female conditions.
10 All regressions also control for one outlier group in the one-female, majority-rule condition. This outlier is well over 2 standard deviations away from all other groups in that condition (as well as all groups in the experiment). No other majority-rule group is that far from the other groups in its condition. We follow Choi (2009) and control for the outlier (see also Bollen and Jackman 1985) rather than discard it. The key interaction terms are statistically significant regardless of the presence of this control or the control for experimental location.
11 This variable is created by subtracting the average male Proportion Talk from the average female Proportion Talk for each group. The empirical range of Gender Gap in Speech Participation is -0.27 to 0.48. We employ this difference measure as our dependent variable in the regressions because the interpretation of the coefficients is easier. With the ratio measure, the predicted values from the model exceed the bounds of the dependent variable. Patterns of significance are the same.
12 Technically, the coefficient for majority rule represents the effect of decision rule at the gender composition intercept. The effect of majority rule varies with the gender composition of the group, so when we take the gender composition into account, predicted values from all models in table 5.2 indicate that the difference in the gender gap between decision rules is significant in groups with one woman (p = 0.02, one-tailed). The difference between decision rules is not significant in groups with two women.
13 Results do not change when we substitute a measure of the number of liberals in the group for our measure of the number of egalitarians in the group (see online appendix table C5.2).
14 Alternative measures of group preferences, including measures of the gender gaps in predeliberation egalitarianism and preferences for redistribution, produce similar results. We find no relationship between gender composition and the gender gap in predeliberation egalitarianism under either rule.
15 For groups with one woman, the difference in the predicted gender gap is significant at p < 0.02 (Models 3 and 4) and at p < 0.03 (Model 5). All tests one-tailed.
16 This method achieves the same end as multilevel analysis, without requiring such strong assumptions. Other regression approaches, including random-effects regression (with a random effect for each group), produce nearly identical results.
17 The interactions are also significant in models that include gender homogeneous groups.
18 The size and statistical significance of all key terms in the model remain the same if a control for the number of egalitarians in the group is included (model not shown).
19 For groups with one woman, a test of predicted values from the models indicates that the difference between decision rules in women’s Proportion Talk is significant at p < 0.05.
20 Specifically, the gender gap in predicted Proportion Talk is only 2.3 percentage points (p-value of the difference = 0.49) in unanimous groups with one woman. The gap in groups with four women is 9.3 percentage points (p = 0.04).
21 Results are identical if we substitute controls for liberalism for our measure of egalitarianism. Substituting controls for the number of group members above the median age or income or the number of group members who are college graduates also makes no difference.
22 As a robustness check, we replicated the results with an alternative measure of deliberative participation, Percent Speaking Turns. See Figure C5.1 in the online appendix for a graphical depiction of the means for men and women in each condition. Results hold when we substitute controls for liberalism in place of the control for egalitarianism (see table C5.3 in the online appendix), and adding controls for age, income, and education do not change the basic patterns either (not shown). In no model do age, education, or income come close to statistical significance, so we do not include them in our standard model.
23 The two measures are correlated at 0.46 (p < 0.001) and the relationship remains large in a regression with a control for location (p < 0.001).
24 The dependent variable here is the Gini coefficient computed only for the women in the group.
25 Predicted values from the model estimate a Gini coefficient of 30.4 for majority-rule groups with four women. This is lower than the predicted value for any other mixed-gender experimental condition.
26 In mixed gender groups, there is no effect of the rule-gender composition interaction on the group’s total talk time.
27 This finding also argues against the alternative that gender homogeneity spuriously represents preference homogeneity; preference homogeneity would produce shorter rather than longer talk times.
28 Mean talk times in female enclaves are longer than the average for all other groups regardless of decision rule, though when we disaggregate by rule, the limited number of enclave groups (eight majority rule and seven unanimous) means that the statistical tests fall short of standard levels of significance (p < 0.20, one-tailed test).
29 In a regression model with a control for location, unanimous rule groups talk about three minutes longer than majority rule groups (p = 0.06, one-tailed), and this effect is similar without the location control, though when we look separately at each location, the effect is slightly stronger in the eastern site. Figure 5.2 shows that unanimous rule boosts each gender’s average individual talk time in nearly every condition.
30 In chapter 9, we will add a third measure: the relationship between talk and the group’s decisions about redistribution.
31 The details of the confidence measure are discussed further in the next chapter. Findings are similar if these controls are not included and if we use an ordered probit model instead of OLS.
32 Results are identical when we substitute controls for liberalism in place of egalitarianism (not shown). Substituting controls for other characteristics, such as the number of group members above the median in age or education and the number of college graduates, does not change the findings in any way. Age, education, and income do not drive the results, either in individual models or in group-level models.
33 Talk time is also related to women’s overall sense of satisfaction with the discussion (online appendix table C5.1). For men, overall satisfaction is not related to talk time.
34 We also asked participants whether or not they were satisfied with the group’s discussion. But given the lack of deep acrimony in the discussions, this question yields very little variation: 90% of participants said they were “somewhat” or “very” satisfied with the discussion. Even so, women in mixed-gender groups whose Proportion Talk was above the median for their gender were far more likely than women below that median to say they were “very satisfied” with the discussion (63% versus 47%, z = 1.97, p = 0.02, one-tailed difference of proportions test). When we combine the satisfaction variable with other similar questions, we find a greater level of variation (half of participants scored above 0.74 on a scale from 0 for least positive to 1 for most positive about the discussion). These questions included levels of agreement or disagreement with whether the discussion was fair, whether group members shared “the same basic values,” whether group work led the respondent to feel like he or she “accomplished more” or “made everything slower and harder to accomplish,” whether group members treated each other with “respect and courtesy,” whether “all different perspectives were welcome” in the discussion and whether disagreement made the discussion “difficult.” Two items were reverse coded to avoid response set bias (group work made everything “slower and harder to accomplish,” and disagreement made discussion “difficult”). These variables scale together well (α = 0.77) and load highly on a single factor. Women in mixed-gender groups whose Proportion Talk was above the median for their gender scored approximately 4 percentage points higher on the satisfaction index than those who were below the median (p = 0.06, one-tailed test). There is no significant effect on men’s satisfaction from scoring above the median of male Proportion Talk (p = 0.20, one-tailed). In addition, we find some evidence that men are more satisfied in the experimental conditions where men are empowered. That is, predicted values from a linear, interactive model regressing the satisfaction index on the experimental conditions show that men’s satisfaction is highest in majority-rule groups with only one woman or unanimous groups with four women. Women’s satisfaction is not affected by the conditions—in a linear model, there is no significant interactive effect of the experimental conditions on women’s index of satisfaction. However, we do find that women who speak the most in majority-rule groups with few women are less satisfied than women who speak the least in these groups (b = -0.49, SE = 0.22, p < 0.01, one-tailed). In all other conditions (pooled), the relationship between women’s Proportion Talk and their satisfaction index is positive (b = 0.165, SE = 0.11, p < 0.08, one-tailed).
35 With respect to the “opinions were influential” question, the expected interaction effects from the conditions obtain for both men and women, but the effects are smaller than effects for “voice was heard” and not statistically significant.
36 Self-votes are eliminated. Results are essentially identical if own votes are included.
37 We employ a negative binomial regression for Influence since the dependent variable skews toward 0. Just over 60% of the sample, and nearly 70% of women, received 0 votes. Predicted probabilities were constrained at the limit of possible votes.
38 The results are similar without these controls or when additional demographic controls are added, including income and party preference.
39 See online appendix figure C5.2 for the average influence votes received by men and women in each condition.
40 Again, the same conclusions are reached with a fully saturated model that includes interactions with decision rule and controls for preferences (see chapter appendix table A5.3) and if we substitute controls for liberalism for our measures of egalitarianism (online appendix table C5.2).
41 Winning is receiving the highest number of votes in the group, ties included.
42 The results are a partial estimate because Imai, Keele, and Tingley (2010) have not yet extended their method to include the interaction + main effect when the model includes an interaction between experimental conditions. For the same reason we cannot run a sensitivity analysis of the mediation using the method of Imai, Keele, and Tingley; correspondence with these authors tells us that this test is not yet extended to interactions between experimental treatments (e-mail, Dustin Tingley, December 15, 2011).
43 A similar test shows evidence that Proportion Talk mediates the relationship between the experimental conditions and self-efficacy. The average causal mediation effect is significant at p < 0.10, two-tailed.
44 Furthermore, if women talk less when the group has homogenous preferences, and gender simply stands in for preference, that does not explain why women talk most in all-female groups.
45 The problem solving included a wide variety of cognitive, social, and values-oriented tasks.
46 Government units at the local, state, and federal levels are increasingly turning to group discussions for input into policy making or for conflict resolution, and many citizens actually participate in these deliberations when invited to do so (Neblo et al. 2010). Small group discussions are also common in civic life, in voluntary organizations, workplaces, and educational settings (Walsh 2007; Fung 2007; Macedo et al. 2005; Merelman Streich, and Martin 1998; Jacobs, Cook, and Delli Carpini 2009; Ryfe 2005).
47 In addition, to maximize women’s individual average talk time, unanimous rule is always better than majority rule, as figure 5.2 shows.