
CHAPTER 6
GRASP THE CURRENT CONDITION (STEP 2)


Where Are We Now?
Don’t go into an improvement situation with preconceived notions or jump into action without knowing the real current condition. To establish an appropriate next target condition, you should first get a good grasp of your starting position.

Grasping the current condition involves personally observing and studying the focus process to objectively and quantitatively analyze how it currently operates and performs. This chapter gives you a step-by-step Starter Kata for doing that with almost any work process. You may have to make some adaptations in elements of this process analysis routine to make it fit different kinds of processes, but the five basic steps usually stay about the same.

“Process analysis” is a good name for this Starter Kata, because it is designed for grasping the current condition at the level of an individual process. A “process” is the series of activities that a person or a group of persons undertake as they interact with routines, materials, and equipment to produce an output or get something done.
Note that at high levels in the organization, how to grasp the current condition depends on the particular strategic purpose being pursued, and at the value stream level, current-state value stream mapping is often used for grasping the current condition.
Reality Is Not Obvious
A common error in grasping the current condition is to make assumptions. We cannot depend on our impressions and intuition for an accurate assessment of the current condition, no matter how well we think we already know the focus process. In fact, the more familiar you are with a process, the harder it can be to see it objectively. Process analysis is time well spent because it leads you to better decisions and improvements down the line. Go and analyze what’s really happening rather than listening to people’s beliefs, or your own beliefs, about what is happening.

However, you can’t simply tell someone to “go grasp the current condition,” because each of us will see different things as being important. For the same reason, you cannot simply ask people in the process or responsible for the process about the current condition. The process analysis Starter Kata gives you a structured routine to go and see and measure for yourself. Practicing the systematic routine of this Starter Kata helps anyone assess and understand the characteristics of a process in a consistent, objective, mathematical, and efficient way.
The Purpose of Process Analysis
The steps of process analysis are designed to give you a deeper understanding of the focus process than you can get from à la carte observing, interviewing, and looking at past data. It is critical to understand the operating patterns and other characteristics of the focus process before you develop the next target condition.
Note that process analysis is not problem analysis. It’s not about identifying problems, wastes, or potential improvements. At this point you’re just trying to see and understand what’s there, without judgment. Practice that impartial mindset. The purpose is to get a baseline understanding of the current performance and operating patterns of the focus process—that’s all—as a prerequisite for then establishing a next target condition.
Go through all five steps of the process analysis Starter Kata, because the information you obtain from any single step is not enough. It’s the activity of slowing down and going through the entire process analysis that gives you a deeper grasp of the focus process.
However, you don’t need to get a perfect understanding of the current condition at this step. You’ll add information as you move forward and learn more. This chapter is about grasping the initial current condition, and your knowledge about the focus process will keep deepening when you try to establish a target condition, and then as you experiment toward that target condition. The “Current Condition” field on the learner’s story-
board gets updated before each coaching cycle to reflect the learner’s latest knowledge about the latest current condition.
Focus on Understanding Process Patterns, Not Just Outcomes
To deeply understand the current condition, don’t just measure the focus process’s outcomes, such as units/day, productivity, quality, or customer ratings. The process analysis Kata emphasizes also understanding how the focus process is operating that produces those outcomes. That’s why this step of the Improvement Kata is called “current condition” rather than “current results.” You should understand the means, not just the ends of what’s happening. Why? We generally can’t sustainably improve process outcomes—such as productivity or quality—by directly attacking them, since they are a result of how the process operates. Instead, you figure out what the current operating pattern is that generates those outcomes, and then you design a target operating pattern (in the next step of the Improvement Kata) that you predict will generate the outcomes you want.
A common problem in assessing a current condition is relying primarily on analysis of past data, with little or no direct observation of the focus process. With the process analysis Starter Kata, you directly observe and measure the operation of the focus process, live, to the extent possible. You’ll be observing and timing operating cycles of the focus process’s actors and equipment, which lets you spot patterns in the work that were invisible or appeared to be random events. These insights are part of what guide you to developing an appropriate next target condition. In many cases you’ll come to understand the current condition so well that the next process target condition becomes almost obvious. In fact, if what the target condition should be is not clear, it often means you need to go study the current condition some more. Grasping the current condition is an important and powerful step in the Improvement Kata.
How to Get Started
You may already have an approach for analyzing a process. Put that aside for now and practice the process analysis Starter Kata as it is designed, until you absorb its basic steps and can do it easily—like practicing some musical scales.
At the beginning, follow the steps of the process analysis Starter Kata in order, as closely as you can in your situation. Changing the steps or their order at this point just makes it harder for beginners to learn. You’re also creating team skills. Unless people in your organization take the time to practice and learn a common, systematic way of understanding and communicating about a process, they will too easily slip back into shooting from the hip based on each person’s individual perspective and impressions.
Once you develop some proficiency with the steps of the process analysis Starter Kata, you can:
![]() Vary the order of the steps. Experienced practitioners naturally and smoothly move back and forth between the steps of process analysis as they encounter or seek out information.
Vary the order of the steps. Experienced practitioners naturally and smoothly move back and forth between the steps of process analysis as they encounter or seek out information.
![]() Build on the steps and combine them with your existing approach to best suit your organization’s processes, products, and culture.
Build on the steps and combine them with your existing approach to best suit your organization’s processes, products, and culture.
It is easiest to apply the process analysis Kata to repetitive, short-cycle processes, rather than to long-cycle processes or processes where the work content varies a great deal. That’s a good place to do your first process analysis practice, even if it is not your normal focus process.
To illustrate the five steps of the process analysis Starter Kata, the “practice routines” section of this chapter uses a manufacturing process as an example, because it has a fast cycle and is easy to observe. Note, however, that the example focus process itself is not important. The five steps are generic and vary less from case to case than you might think. What does vary is how difficult it may be to apply them to a particular process. Check yourself: Are you skipping a step of the process analysis Starter Kata because it doesn’t work, or because it is hard to figure out how to apply it to a particular focus process? At this point your coach might give you some suggestions and say, “Please try again.”
Guidelines for Practicing Process Analysis

![]() For beginner learners choose a process that is easy to understand and analyze. The first goal here is to internalize the routine of process analysis, not to tackle the most important or most difficult process to improve. Once the learner has developed some familiarity with the steps of process analysis, he or she can practice applying this Starter Kata to more difficult processes.
For beginner learners choose a process that is easy to understand and analyze. The first goal here is to internalize the routine of process analysis, not to tackle the most important or most difficult process to improve. Once the learner has developed some familiarity with the steps of process analysis, he or she can practice applying this Starter Kata to more difficult processes.
![]() Have the learner follow the process analysis steps as closely as possible, one at a time. Don’t let a beginner learner jump ahead, because you’re trying to imprint a pattern. Competent-level learners can then vary the sequence of steps according to the situation.
Have the learner follow the process analysis steps as closely as possible, one at a time. Don’t let a beginner learner jump ahead, because you’re trying to imprint a pattern. Competent-level learners can then vary the sequence of steps according to the situation.
![]() However, as the learner moves through the analysis steps in order, he or she will often have to go back to review or recalculate an earlier step based on what he or she is learning. That’s normal. One can’t get each step right the first time.
However, as the learner moves through the analysis steps in order, he or she will often have to go back to review or recalculate an earlier step based on what he or she is learning. That’s normal. One can’t get each step right the first time.
![]() A key to the process analysis Starter Kata, as with any Kata, is to not overthink it, but rather to go ahead and do it a step at a time. Learn with the body. A routine like this can seem complicated when you’ve never done it this way before, but it will seem easy after you’ve done it a few times. As a beginner, follow the instructions as closely as you can.
A key to the process analysis Starter Kata, as with any Kata, is to not overthink it, but rather to go ahead and do it a step at a time. Learn with the body. A routine like this can seem complicated when you’ve never done it this way before, but it will seem easy after you’ve done it a few times. As a beginner, follow the instructions as closely as you can.
![]() Don’t let the learner use averages, because averages mask process variation.
Don’t let the learner use averages, because averages mask process variation.
![]() Break the practice of process analysis into “chunks”:
Break the practice of process analysis into “chunks”:
![]() Have the learner complete one process analysis step at a time.
Have the learner complete one process analysis step at a time.
![]() Upon concluding one step of the process analysis, have a beginner learner summarize and present that step in a coaching cycle before going on to the next step.
Upon concluding one step of the process analysis, have a beginner learner summarize and present that step in a coaching cycle before going on to the next step.
![]() In coaching cycles, the learner should present current condition information in the same order as the five steps of this Starter Kata. You’re trying to imprint a pattern of thinking, and even a language.
In coaching cycles, the learner should present current condition information in the same order as the five steps of this Starter Kata. You’re trying to imprint a pattern of thinking, and even a language.
![]() Each time the learner presents their ongoing process analysis, have him or her begin the presentation back at step one of process analysis. The learner should go over the entire process analysis each time he or she presents it, to help internalize the pattern, until all the steps are completed and a full picture is obtained. This is a common technique in music practice.
Each time the learner presents their ongoing process analysis, have him or her begin the presentation back at step one of process analysis. The learner should go over the entire process analysis each time he or she presents it, to help internalize the pattern, until all the steps are completed and a full picture is obtained. This is a common technique in music practice.
![]() With a beginner learner, the coach should go along during the process analysis, and to a degree also analyze the process, working in parallel with the learner. This way the coach can better evaluate and give feedback on what the learner is doing.
With a beginner learner, the coach should go along during the process analysis, and to a degree also analyze the process, working in parallel with the learner. This way the coach can better evaluate and give feedback on what the learner is doing.
![]() At the beginning, doing a process analysis may take a few days, but as you gain experience with the process analysis routine you can often do it in a few hours. For practice it can be fun to set an increasingly shorter time to do a process analysis. Pick another process and do it again. Can you get to the point of doing a complete process analysis in just a few hours?
At the beginning, doing a process analysis may take a few days, but as you gain experience with the process analysis routine you can often do it in a few hours. For practice it can be fun to set an increasingly shorter time to do a process analysis. Pick another process and do it again. Can you get to the point of doing a complete process analysis in just a few hours?
QUICK TIPS
Process Analysis with Office and Service Processes
Find the pattern of working!
“Pattern” is a good word to use when you seek to understand any process. There is a repeating pattern in nearly all work that humans do, because that’s how our brain works.

Practicing the Improvement Kata with office and service processes can be difficult at the beginning because the work content often varies, takes a long time, and may even be invisible. However, even when the work content varies, people carrying out the tasks will have certain repetitive ways of doing them. That’s a key part of what you’re trying to see and measure in process analysis with any process: What is the current way of doing things?
It can take longer to observe and measure the current work patterns in office and service processes. But once you start to recognize the patterns you can measure, graph, and sketch them and, based on that analysis, define the next target pattern to aim for.
Process Analysis with a Fully Automated Process
Focus on the surrounding human processes.

Fully automated processes are still dependent on things that people do, such as:
![]() Machine tending (monitoring, stocking, loading, adjusting, etc.)
Machine tending (monitoring, stocking, loading, adjusting, etc.)
![]() Changeovers
Changeovers
![]() Logistics (moving material in and out)
Logistics (moving material in and out)
![]() Reacting to problems
Reacting to problems
![]() Planned maintenance
Planned maintenance
You may be surprised at the degree to which variability in these surrounding human work processes will affect the performance of an automated machine. You can apply the steps of the Improvement Kata, including process analysis, to any of those human-centered processes rather than to the machine itself.

![]() STEP 1: Process Outcomes. Review the process’s outcome performance, which
STEP 1: Process Outcomes. Review the process’s outcome performance, which
gives you a sense for what the process is creating and a frame for the rest of the process analysis.
![]() STEPS 2—5: Pattern of Working. Now get inside the focus process to understand its characteristics and operating pattern, which are what generate the outcomes.
STEPS 2—5: Pattern of Working. Now get inside the focus process to understand its characteristics and operating pattern, which are what generate the outcomes.
QUICK TIPS

The Basic Equipment You’ll Need:
![]() A stopwatch that measures in seconds
A stopwatch that measures in seconds
![]() Graph paper
Graph paper
![]() Pencil, eraser, and ruler
Pencil, eraser, and ruler
![]() Calculator
Calculator
![]() Blank current condition / target condition form (see Appendix)
Blank current condition / target condition form (see Appendix)
![]() Timing worksheet (see Appendix)
Timing worksheet (see Appendix)
Practice Courtesy at the Focus Process!

![]() Approach the process via its manager or supervisor.
Approach the process via its manager or supervisor.
![]() Introduce yourself to the people in the process and explain what you are doing. Explain that you are watching the work, not the person.
Introduce yourself to the people in the process and explain what you are doing. Explain that you are watching the work, not the person.
![]() Do not interrupt people while they’re working.
Do not interrupt people while they’re working.
![]() Before you leave say thank you, and show any notes you’ve taken.
Before you leave say thank you, and show any notes you’ve taken.
![]() Keep your hands out of your pockets while you are at the focus process, because everyone is working here.
Keep your hands out of your pockets while you are at the focus process, because everyone is working here.
Some Process Analysis Terminology:

Facts: Something you observe. Example: The actual occurrence of scrap.
Data: Something you measure. Example: The scrap rate.
Outcome metric: This is a “result” metric, measured after the fact, that summarizes how a process or system has performed in aggregate over several cycles. An outcome metric itself cannot be directly influenced because it is the product of other variables. Examples: lead time, output per hour, cost, labor cost, productivity, quality.
Process metric: This is a metric that occurs in each cycle of the focus process and can be directly observed and measured in real time to assess how a process is operating now. A process metric is often one of the variables that affects the outcome metric and is something that can be directly influenced. Example: The time each work cycle takes.
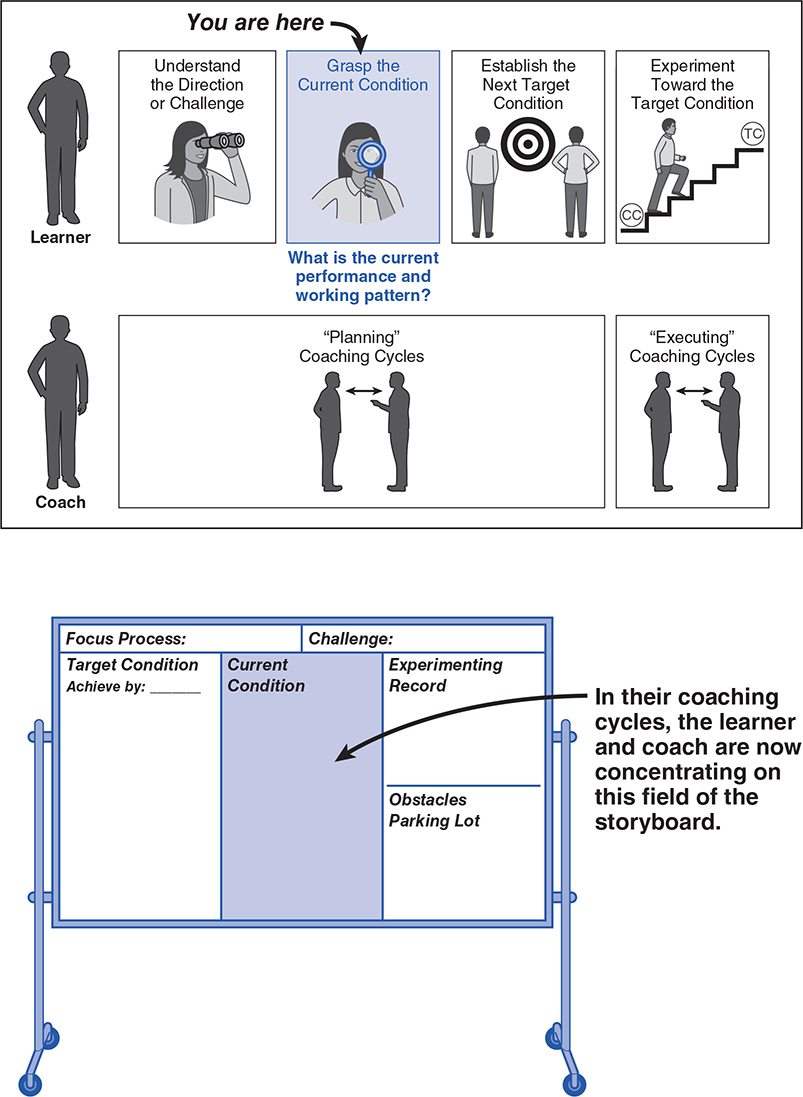
Working with the Current Condition / Target Condition Form and the Storyboard
The current condition / target condition form (see Appendix) is both a process analysis checklist and, together with the storyboard, a place to record your findings. This form plus any additional pages of data, such as your block diagram and run charts, should be posted in the “Current Condition” field of the storyboard.
As you gain experience you can modify and evolve this form to suit your particular environment and needs. However, as with any Starter Kata, first practice using it as designed.
In the planning phase of the Improvement Kata, the spaces for describing the current condition and target condition are together on one form so you can cross-reference characteristics of the current condition and target condition. At this time you will be using the left side of the form. Later, once the target condition is established, the form gets cut into two pieces along the line shown, and each side is placed in its corresponding field on the storyboard.
Remember, what you are working on now is determining the initial current condition. In the executing phase of the Improvement Kata the “Current Condition” field of the learner’s storyboard will be updated before each coaching cycle to reflect the latest current condition.

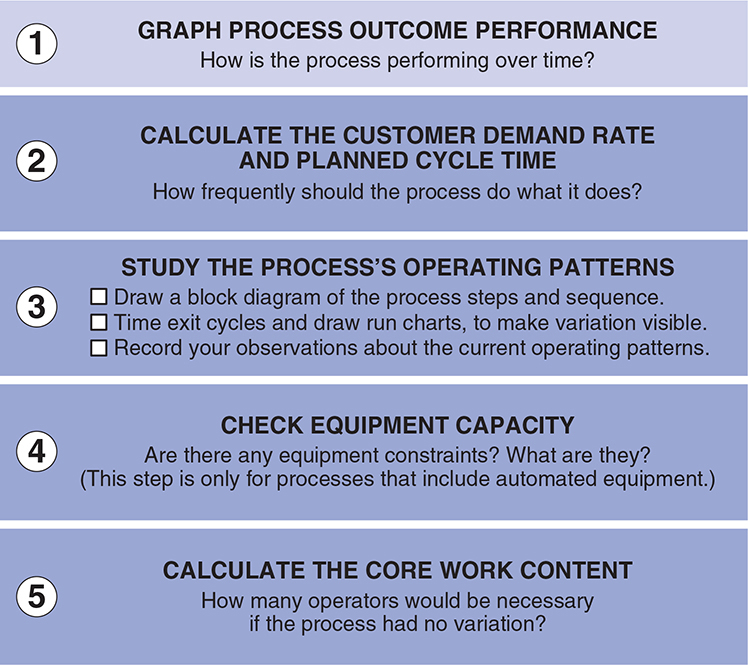
STEP 1: GRAPH PROCESS OUTCOME PERFORMANCE
How is the process performing over time?
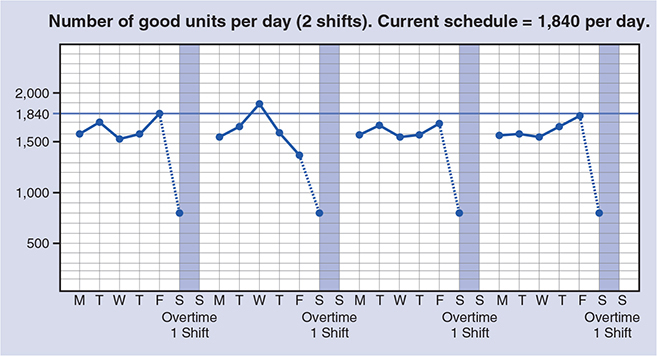
Once the focus process has been selected, begin your process analysis by looking at data on how the process has been performing over time. Doing this should help you understand what the focus process produces, who its customers are, when it operates, and how it is performing.
Some examples of outcome metrics for the focus process include quantity, productivity, quality, cost, wait time, service ratings, and so on. You can change the outcome metric you are following or add outcome metrics at any time. You may already have this information, since it is historical data. Graph it in a simple run chart, as illustrated below, and post it on your storyboard.
An additional piece of information to collect at this step is how much overtime beyond the scheduled work time, if any, has been required for the focus process to produce the outcomes.
Keep in mind that it can be difficult to tell how accurate historical data is. If possible, set up a system to continually measure and collect this data, because you’ll want to keep an eye on the outcome metric(s) as you conduct experiments in step four of the Improvement Kata pattern.
Post this graph in the “Current Condition” field of your storyboard.
STEP 2: CALCULATE THE CUSTOMER DEMAND RATE AND PLANNED CYCLE TIME
How frequently should the focus process do what it does?
In this step you’re trying to figure out at what rate the focus process should be cycling. It may seem strange to be thinking about desired cycle time when you’re analyzing the current condition, but it is an important lens, or benchmark, that you’ll use in the next steps to compare with what is actually happening. The purpose of determining a desired cycle time is to help you understand customer demand and then let you assess where the focus process currently stands relative to that. Notice that cycle time is a process metric.

It may be tempting to simply ask someone what the desired cycle time should be, but don’t rely on that. Instead, base your determination on a calculation that you make, which starts with understanding the needs of the focus process’s customer. With that information you can calculate a desired cycle for almost any work process. Any process has both a customer and a pattern of working. When you bring those two things together, there’s usually some kind of desired cycle.
There are two numbers you are trying to get in this step: (A) the rate of customer demand, expressed in seconds/minutes/hours/days/etc., per unit, which is often called the “takt time,” and (B) the desired or target rate at which the focus process should be cycling, which is often called “planned cycle time.” Later, in step three, you’ll measure and graph the current actual cycle time.

The planned cycle time will usually be faster than the customer demand rate to accommodate problems such as unplanned downtime, changeover time, and swings in demand and still be able to serve the customer in a timely fashion. However, this creates a buffer, so try not to overdo it. An 85 percent planned cycle time guideline is explained on the following pages.
Questions to ask in this step of process analysis are:
![]() What is the focus process’s product or unit of output?
What is the focus process’s product or unit of output?
![]() How often does the focus process’s customer or customer process want this unit of output?
How often does the focus process’s customer or customer process want this unit of output?
![]() How often do we want the focus process to make one unit of its output?
How often do we want the focus process to make one unit of its output?
Note 1: Don’t worry if you can’t get a perfect picture of demand and calculate perfect numbers at this time. Get as close as possible and come back and fine-tune the numbers as you move forward and learn more.
Note 2: Since customer demand changes over time, you’ll need to recalculate takt time and planned cycle time periodically.
A. Calculating Takt Time (TT): Available Working Time Divided by Demand Quantity
The takt time calculation for the focus process is simply the available work time at that process (the numerator) divided by the number of units of process output the customer requires in that time frame (the denominator). See the example calculation on the next page.
Note that the available work time is the time per shift or day or week (etc.) minus any planned downtimes—when the process intentionally pauses—such as breaks. However, do not subtract out any unplanned downtime or changeover time at this point, so that the takt time calculation gives you a picture of the real customer demand rate.

B. Calculating Planned Cycle Time (Pc/t)
This is the actual rate, or cycle, at which you want the focus process to operate. You’ll be using this number in the remaining steps of process analysis. At this point you just need an initial number for the rate at which you think the focus process should cycle, which you can fine-tune if necessary as you learn more.
Once you have calculated takt time (the demand rate), now you subtract your typical losses, such as changeover time, unplanned downtime, scrap, and rework from the available work time (numerator) in order to arrive at a planned cycle time (Pc/t).
A word of caution: The more potential losses you subtract from the numerator of the planned cycle time calculation, the more your cost rises. You end up cycling the process too fast, which requires more operators and easily leads you to overproduce relative to the actual customer demand, resulting in potentially harmful buffers. For that reason there is a useful alternative calculation. A good place to start with planned cycle time is to simply multiply the takt time by .85 (85 percent) to arrive at an initial planned cycle time that is only 15 percent faster than the takt time. Later, as you start experimenting, you’ll learn more about the process and can adjust the Pc/t number accordingly.

You can think of the planned cycle time as a target that you will be working toward. That is, rather than simply covering all process problems with a much faster cycle, strive through your experiments to be able to cycle the focus process no faster than 15 percent below the takt time. That makes you address the problems rather than burying them out of sight.
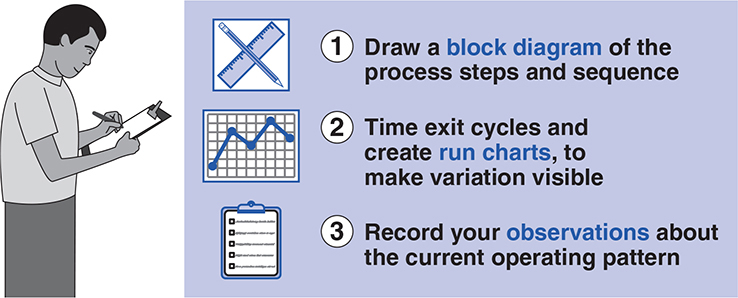
STEP 3: STUDY THE PROCESS’S OPERATING PATTERNS
This step is the heart of the process analysis Starter Kata.
Step three consists of the following three main activities. The findings from each of these activities should be posted in the “Current Condition” field of the storyboard.
Before you do these three activities, first get a sense for the boundaries of your focus process by walking the flow of the product or service. You can refer to a current-state value stream map to see where the inputs to the process come from and where its output goes. However, be sure to go and walk these flows yourself, starting at the “customer” process that receives the focus process’s output, and going upstream all the way through to the process that supplies your focus process. What do you think are the boundaries of where your focus process starts and ends?
Draw a Block Diagram of the Process Steps and Sequence to Show the Flow of Work

A block diagram is a simple but remarkably useful tool. It is a row of squares to which you add information to visually depict the steps and sequence of how the work in the focus process is done. Note that the block diagram is a process-level diagram, not a value stream map. In office/service processes a “swim-lane diagram” can be useful for the same purpose as a block diagram. (Many online resources describe that tool.)
Begin by defining the start and end points of the process you are observing. You may decide to adjust these process boundaries as you draw and get to know the process better.
At this stage you’re trying to understand the current work pattern and flow, not the physical layout. To do this, draw a straight-line sketch of the workstations in the process, with each one shown as a square of the same size, regardless of what the actual workstations and layout look like. Each square simply represents a workstation, table, fixture, or machine. Do not draw to scale or worry much about the physical layout. What you are drawing is the work flow. The block diagram can have multiple branches, of course, if that’s how your focus process flows.

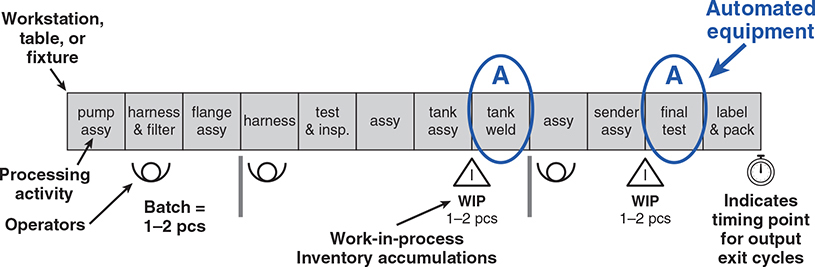
You can add whatever information you like to your block diagram. The example below (an assembly process) illustrates information that typically gets noted:
![]() Name of the workstation or processing step
Name of the workstation or processing step
![]() Number of operators (three in this example) and their range of work
Number of operators (three in this example) and their range of work
![]() Batch sizes (how many units are processed by one person before passing them on)
Batch sizes (how many units are processed by one person before passing them on)
![]() Where work-in-process inventory tends to accumulate (WIP triangle)
Where work-in-process inventory tends to accumulate (WIP triangle)
![]() Where there are fully automated machines that can cycle unattended (useful in step four)
Where there are fully automated machines that can cycle unattended (useful in step four)
You can keep adding details to your block diagram as you go through the other steps of process analysis. Your block diagram may get messy, which is normal.

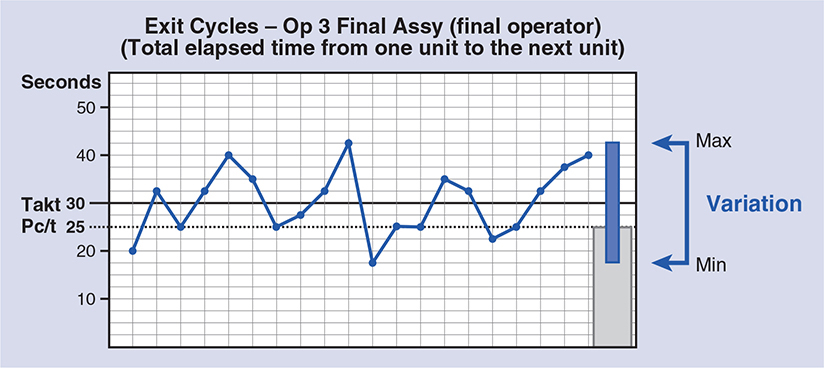
Time Exit Cycles and Draw Run Charts to Make Variation Visible

In this step you’ll be making run charts of a metric called “exit cycles.” These run charts are another highly useful tool for gathering, understanding, and communicating current-condition information. Exit cycle run charts illustrate process variation over time, and making them provides many clues to the current operating pattern of a process. Understanding the variation in a process is important because it can affect so many other aspects of the process. The run charts look like this:
You should always try to make exit cycle run charts for your focus process, even though it can be difficult and time-consuming in the case of long-cycle or custom processes. Preparing them forces you to observe and study the process in more detail than just watching, and leads you to a deeper understanding. You will be getting lots of practice with this, because in the executing phase of the Improvement Kata, run charts often get retimed and redrawn before each coaching cycle, to document the latest current condition.
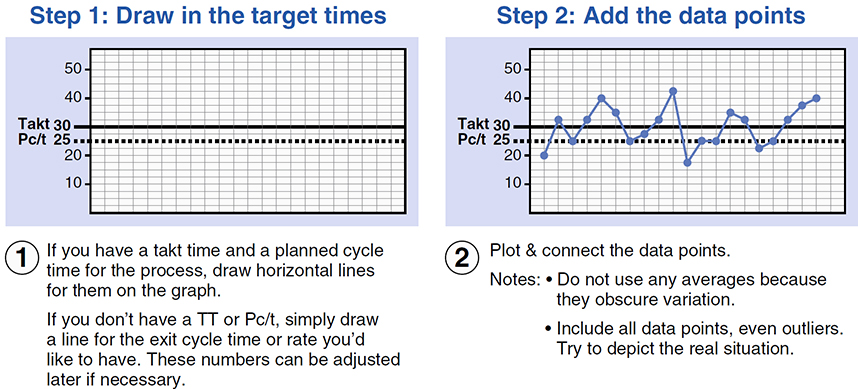
How to Make a Run Chart
First you need to time “exit cycles” for each operator in the process. An exit cycle is the actual time between completed units of the product or service that is coming out of that operator’s portion of the process. It’s not how long, but how often. It’s not the operator’s work content, but how much time elapses from unit to unit.
Exit cycles for the last operator position in a process—the one closest to the output end—often give you a metric for the output variation of the whole process. Check the box on the timing worksheet (see figure) if you are timing the operator exit cycles that represent process output. Timing operator cycles further upstream gives you a picture of variation that is occurring inside the focus process.
Time 20 to 30 “exit cycles” for each operator in the process. To do this, select a reference point in the operator’s work pattern, and start your stopwatch when the operator gets to that point. Now let your stopwatch run until the operator returns to this reference point in the cycle, no matter what interruptions or delays might take place. You are timing full cycles, so just let the stopwatch run until then. Also do not skip or discard any cycles, no matter what happens, because they are all data.

As you do this, please keep in mind that you are timing and understanding process characteristics, not the operator. You’re not trying to change how people work, only to begin to understand the variation that is occurring in the focus process and what may be causing it.
Record the times you measure on the timing worksheet, and be sure to write any observations you make about the current operating pattern in the area provided. Using the data from the timing worksheet and some graph paper, you can now draw your run charts by following the steps on the next page.

Drawing a Run Chart, Step by Step
You can make run charts like this for nearly any process. Maybe it’s a customer issue, maybe it’s your job hunt, maybe it’s a global issue like carbon emissions. Here are current condition exit cycle run charts for the other two operators in our example focus process.

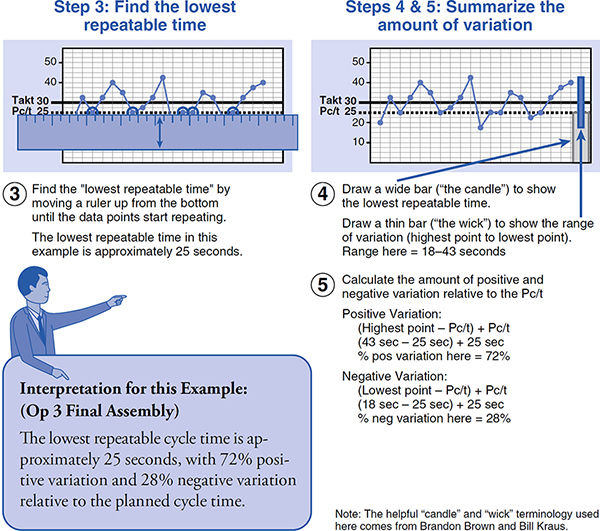
Now summarize your snapshot of the variation in the focus process by combining all the variation summary bars (the “candles” and “wicks”) in a variation summary chart that looks like this.

The individual run charts and your variation summary chart belong on the “Current Condition” field of your storyboard. Regularly making run charts is one of the most useful process analysis practices. Based on them you can visually and numerically describe several key aspects of a process’s current condition, and in the next step of the Improvement Kata you can establish a target condition for those aspects of your focus process.
Record Bullet-Point Observations About the Current Operating Pattern
What else do you notice?

When you stand at a process and time 20 to 30 exit cycles, you are going to see things related to its current operating pattern. What do you notice? As you get the exit cycles data, also jot down any notes in the “observations” column of the timing worksheet. Then summarize your key observations in the space provided on the current condition / target condition form. Simply describe what you see happening in the work, without any judgment, noting your observations in bullet form as shown in the example CC/TC form at the end of this chapter. In our example, these observations include:
![]() Operators get their own parts.
Operators get their own parts.
![]() Work-in-process inventory (WIP) tends to accumulate before the two automated workstations.
Work-in-process inventory (WIP) tends to accumulate before the two automated workstations.
![]() The last operator has to periodically move containers of finished goods out.
The last operator has to periodically move containers of finished goods out.
The tricky part here is tuning your mind to see patterns, not problems. Our mind quickly picks out issues or problems to address, and even solutions, but it’s too soon for that because you don’t have a target condition yet! Your bullet-point observations should mostly just describe additional characteristics of how the focus process currently functions.
It takes practice to learn to see this way. Once you acquire this skill you’ll look at processes a little differently—realizing that there are patterns everywhere—and you’ll move away from making quick judgments and scattershot improvements.
STEP 4: CHECK EQUIPMENT CAPACITY
This optional step applies only to automated equipment.
The point of this step is to ensure that any automated equipment in the focus process is able to cycle fast enough to meet the planned cycle time. It is also effectively a check of the current technical volume capacity for a process.
This check applies only to automated equipment—equipment that is able to go through its cycle unattended while the operator does something else—as found in hospital labs, manufacturing processes, and so on. Many processes do not have any automated equipment. Also, do not worry about equipment that requires operator manipulation, such as hand tools, hand welding, ultrasound scanners, and so on. Their times are already captured in the operator exit cycles that you timed in step three of the process analysis.
First identify any automated equipment with the letter “A” on your block diagram. Then draw a machine capacity chart for those machines, as shown on the next page.
Drawing a Machine Capacity Chart, Step by Step
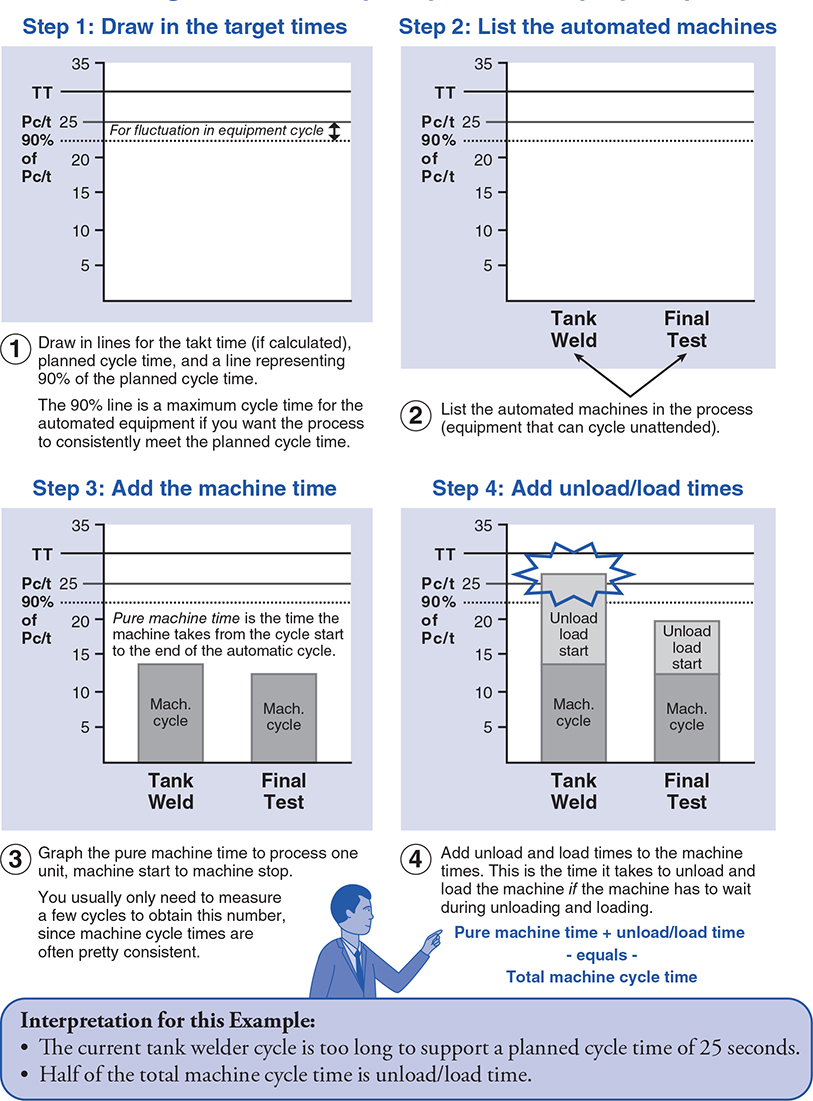
Interpreting the Machine Capacity Chart
Total machine cycle time is the sum of the start-to-stop automatic machine run time plus any time for unloading and reloading, etc., during which the machine has to wait before it can start operating. However, if the machine can be unloaded and loaded while it is already cycling on the next unit, then ignore the unload/load time because it occurs in parallel.
In order to achieve a smooth, consistent work flow, a basic guideline is that any automated machine’s total cycle time should be no more than 90 percent of the planned cycle time. The extra 10 percent exists to accommodate fluctuations in machine cycles. This guideline applies only to the automated equipment, not to the operators. (In completely automated processes 95 percent may be acceptable.) In other words, the fastest planned cycle time that a process with automated equipment can run is its longest total machine cycle time divided by .90. This is an estimate of the focus process’s current capacity.
If a piece of automated equipment cannot cycle fast enough to meet the planned cycle time, you will need to either reduce that machine’s total cycle time or lengthen the available work time in the takt time calculation, which lengthens the planned cycle time for the focus process.
In the example shown on the previous page, the current tank welder cycle time is too long to support the planned cycle time of 25 seconds. Interestingly, though, half of the total machine cycle time consists of unload/load time. Looking ahead, three options to keep in mind for dealing with this capacity bottleneck are listed below.

STEP 5: CALCULATE THE CORE WORK CONTENT
How many operators would the process require if it had no variation (was problem free)?
The purpose of this step is to help you understand the core work activity that has to be done to give customers what they need. When we look at a process, many things catch our eyes, which can make it difficult to see and understand the essential.
One way to help get a sense for the core work is to calculate the theoretical number of operators if the process had no variation. This is not about reducing the number of operators, because the calculated number of operators would only be sufficient if you first are able to achieve a tight range of variation in the process.
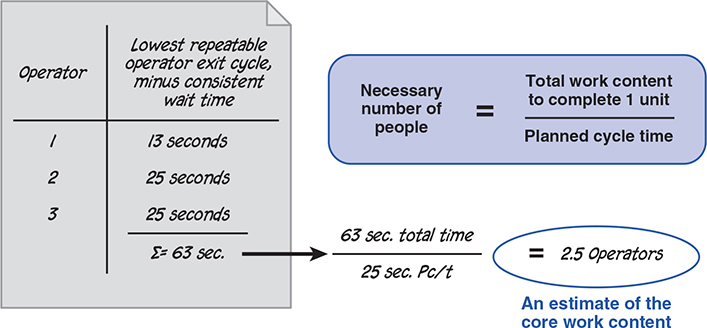
The Number-of-People Calculation in Two Steps
Step 1. You first need an estimate of the total work content necessary to complete one unit of the product or service in the current condition. Get this by adding together the lowest repeatable times from the exit cycle run charts (the “candles”) for each operator in the process.

Step 2. Divide the sum of the lowest repeatable exit cycles from step one (the estimate of the total work content to complete one unit) by the planned cycle time. The resulting number is an estimate of the number of operators required if the process was problem free.
In making this calculation, subtract from the sum of lowest repeatable exit cycles any consistent wait time—occurring in nearly every cycle—that you observed any operators having, since this is not time required to process a unit of the product or service.
Add the resulting number of operators to the current condition / target condition form to represent the core work content in the focus process.
An example calculation is shown below.
SUMMARIZE YOUR ANALYSIS OF THE INITIAL CURRENT CONDITION
You’ve invested some time to conduct a systematic analysis. Based on the steps of the process analysis Starter Kata, you now probably have a good understanding of the focus process. But there are usually still some open questions and knowledge gaps, too, which is normal. You are free to add more current condition information anytime, as you learn more in the next steps of the Improvement Kata pattern. You can also go back and get the missing current condition information now.
Post your current condition / target condition form (see next page) plus your block diagram, run charts, machine capacity chart, any calculations, and other current condition information in the “Current Condition” field of your storyboard.
Then get ready to turn your attention to establishing a target condition. After so carefully studying the focus process, you may already have some ideas about how it should be operating. You can move into developing a target condition by practicing the Starter Kata in the next chapter.
