
Chapter 5
![]()
Macroprocess Principles: Create a Cadence of High Value Flowing to Customers
The supposition is prevalent the world over that there would be no problems in production or service if only our production workers would do their jobs in the way that they were taught. Pleasant dreams. The workers are handicapped by the system, and the system belongs to the management.
—Dr. W. Edwards Deming, quality guru
WHAT IS THE VALUE OF LEAN PROCESS PRINCIPLES?
Principles Are Not Solutions
Principles can help us think about what we want to accomplish; they do not solve problems. Mechanistic thinking seeks “best practices” to imitate. We see an excellent organization do it, we start to do it, and we are convinced we will achieve the same outcomes as the benchmark organization. As Dr. Deming warns, “Pleasant dreams.” We know little about what the benchmark organization went through to achieve the results, and it was almost certainly more than copying someone else’s solutions.
Systems thinking strives for new levels of performance by learning our way beyond our current knowledge threshold. We cannot be sure how to achieve our goals, so we must learn, scientifically, how to do so. In the scientific process of PDCA, the principles primarily help us in defining our future state, developing intermediate target conditions, and thinking through possible countermeasures to test in the Do stage. After that we should leave it to experimentation, deep thought, and the learning that comes from the experiments.
We repeatedly see organizations with a mechanistic orientation adopt lean or six sigma or some combination as a program. They copy the most obvious features of Toyota. Toyota has the TPS house, so they develop their own (company name) operating system, and it often looks like a house. Usually it includes a flow pillar, a built-in quality pillar, and a foundation of stable processes and a management philosophy. We have adapted the TPS house for services, and as an image it seems to be a useful starting point (see Figure 5.1). The basic concepts of one-piece flow to customers, built-in quality, continuous improvement, and stable, repeatable processes are powerful indeed for both manufacturing and services and form the basis of the process principles in this chapter and Chapter 6.
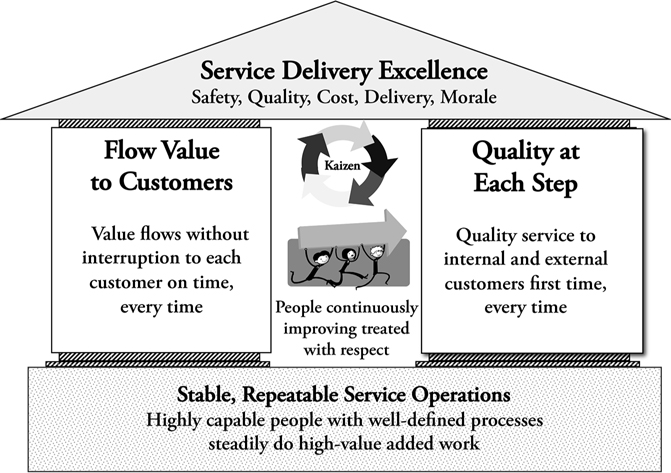
Figure 5.1 The Service Company X operating system
Positive images are a starting point and, as such, can be powerful, but we know that culture runs much deeper than visible artifacts. It makes no difference what the picture shows. What matters is what people do and how they think on a day-to-day basis. Mechanistic organizations do something with those pictures that Toyota actively avoids: they turn them into corporate standards to be implemented and enforced through audits. The elements of the house are broken down into a list of things that thou shalt do . . . or else.
I consulted to a massive Russian company that sought out help to learn TPS directly from Toyota. The CEO used political connections, and Toyota sent its top TPS expert as a consultant for one year. The company president took the advice of the Toyota expert very seriously, treating him as his most trusted advisor and doing virtually anything he asked.
I had a long meeting with the vice president of Continuous Improvement who was perplexed by the TPS expert. He explained that the Toyota guy wanted the company to dismantle almost everything that had already been set up in the name of lean. The company had installed an elaborate auditing system to ensure all plant managers implemented all the lean tools, or it would hurt their annual bonus. The Toyota sensei looked at the auditing system and said: “Please stop doing this. Plant managers will obey, but they will not understand.” The sensei was also not pleased with a macro value-stream map that showed the entire process from getting raw materials from the ground to delivering the finished product to the customer. The sensei bemoaned, “Problems, problems, where will you start?” He seemed to dismiss the macro map. The company executives had begun to bring lean to the office and wanted to spread it enterprisewide, but the sensei discouraged them from enterprisewide transformation and instead focused on one value stream of one factory.
The VP and I had a long talk, and I explained my best guess about the reasoning of the Toyota sensei. Simply implementing tools is not the same as having a living system that continually improves. I also explained that the purpose of the model area in the one plant was to teach everyone, including him, what real TPS is. As it was, there was not a single example anywhere in the company of real lean as a living system. Until the people at the company experienced it firsthand, they would not understand. The VP was very grateful for my explanation, which was much more detailed than anything the Toyota sensei had given, and then the VP confided in me that the company had secretly kept the audit system for grading plant managers.
As we go through our distillation of lean process principles, please do not think of them as a checklist of things to do. Think of them as guidelines or as positive visions to strive for. We have intentionally kept them very general so they apply to any type of work process. The important thing is that each step of your transformation process should be purpose driven, not tool driven.
Value-Stream Mapping to Develop a Macrovision
Value-stream mapping is probably the most popular of the lean tools. It originated within a group of specialists at Toyota called the Operations Management Consulting Division. The purpose was to understand the current flow, or lack of flow, of material and information. From a 30,000-foot perspective, how does material flow through the factory or supply chain, and how is information used to influence the flow? Then the more important question: How should it flow to achieve our desired results? It was originally used as a tool for the TPS master trainers to quickly get a picture of the current state and generate a challenge for the students, for example, suppliers who were learning about TPS. The trainers intentionally did not share the maps, as they believed the students would not understand. Rather the sensei would use mapping to generate challenges that the trainers would present to the students one at a time so that the students unknowingly were building toward the future state. Later, when value-stream mapping became popularized by Mike Rother and John Shook in Learning to See,1 Toyota gave it the name of the material and information flow diagram (MIFD). Since then, value-stream mapping has taken on a life of its own, not always in positive ways.
We use value-stream mapping regularly in technical and nontechnical service work, and it is powerful. The team members learn to map their current process from the customer’s perspective. Often a benefit of value-stream mapping is understanding how to reduce lead time from the customer order/request to when the customer receives the service. Figure 5.2 gives an example of the process steps in an accounts payable process. There are multiple steps being done by multiple people, so the cases are batched before being moved and then worked on. The obvious result—customers wait a long time to get paid. The less obvious problem is that any defects are apt to be hidden for quite some time before the customer discovers them—feedback loops are very long. Seeing this, there is a temptation to immediately implement a variety of “solutions” to eliminate waste. Don’t do it! It will limit your learning and progress. With value-stream mapping a visual image of the current process is developed, but then we go further to develop a future state that flows value more quickly to the customer with better quality.
• Analyze process lead time
• Calculate value-added ratio = VA/total lead time
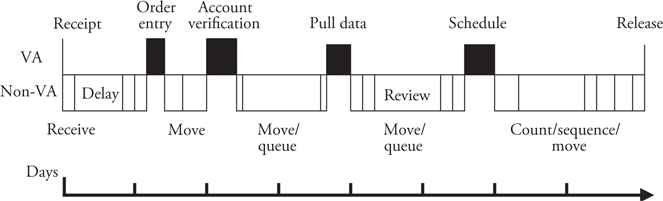
Figure 5.2 A picture of the current state of an accounts payable process
Among the well-informed, value-stream mapping has become a popular approach in lean services to understand the waste and to develop a future state vision.2 It is a common sight in conference rooms for multifunctional teams to place sticky notes on the wall working to represent the current process. This is often done in a workshop format of a few days. Our best experiences include a gemba walk, even if that means talking to personnel sitting at their desks who explain what they do. Rother and Shook warn us not to stop at identifying and fixing wastes in the current state. The real power of the tool is getting the team to jointly envision a preferred future state. Simply fixing problems in the current state will rarely get you to a desirable future state.
When my associates and I use the tool, we do not get deeply involved with technical details, especially when dealing with highly variable service work. The 80-20 rule works well for value-stream mapping—get 80 percent of the benefit with 20 percent of the effort. Mostly what they put on the wall are steps, rough times for a step (sometimes ranges of times), arrows connecting the steps, and some sort of icon for queues of work in process. It is big picture and rough. We have seen lean specialists in companies agonize over detailed data to get precise estimates of value-added time and non-value-added time, and mostly we see this as waste. Many service processes are simply too variable and complex to get so precise, and it is not really the purpose of the tool. The purpose is to get people to see flow and waste and envision what is possible within their value streams. When they get into implementation to achieve the challenge of the future state, they will delve into a more detailed understanding of the current condition and learn far more as they begin to actually experiment with new ideas for improvement.
We often start the current-state analysis by asking several team members to put together a rough process map before the workshop. The team members generally start by mapping the formal system—how they think the process should work. When a cross-functional team comes together for the workshop they dig deeper into the current state, adding a lot more Post-it notes to the wall, and more complex feedback loops are added for rework. In the final analysis it is almost comical how obtuse the process is—so full of waste. And we want the team members to see the contrast between the theoretical formal system and what is actually happening. Most experienced lean manufacturing consultants I know see much more waste in services than in manufacturing.
In Figure 5.3 we show the cleaned-up results of a mapping workshop we led on the process of creating a purchase order. This form of mapping divides tasks by swim lanes. Along the left-hand side are different roles or departments. Across the top is a time scale. The Post-it notes are lined up in rows showing who does what and when. Notice that depending on the type of purchase order, there were three different approaches. Even though you cannot read all the steps on the Post-its, it is clear at a glance that this is an overly complicated process for what would seem to be a straightforward task.
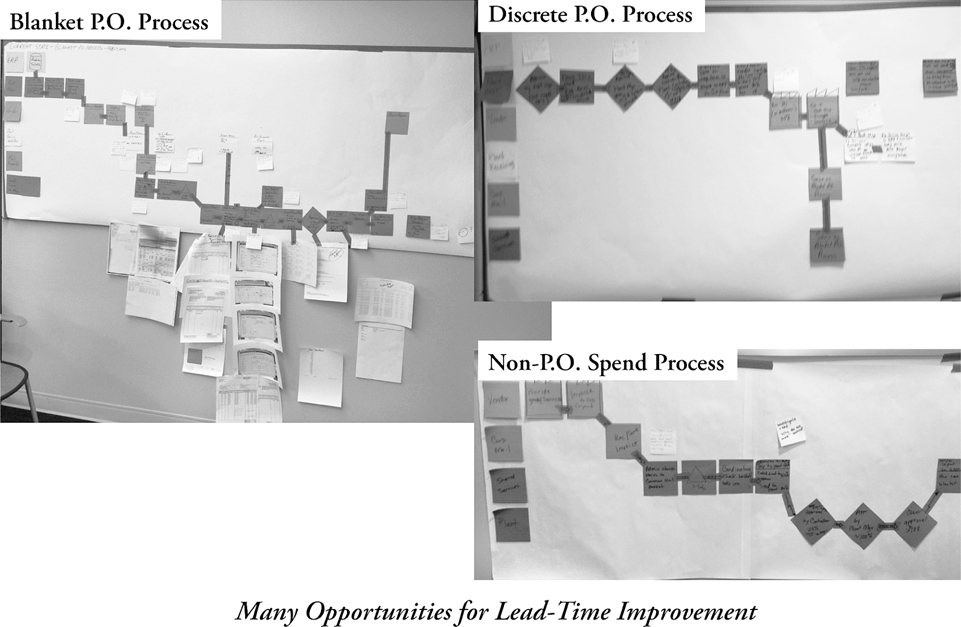
Figure 5.3 Three current-state maps for three types of purchase order processing
The group considered lean process principles and worked to develop a streamlined approach that also improved accuracy and had less documentation. The results are shown in Figure 5.4. In the course of the discussion, one member almost naively asked if it was really necessary to have three different approaches. The initial reaction was “Of course, they are different types of POs with different requirements.” As they dug in, the team came up with one standard process for all three types of POs. The result was a much improved process including the following highlights:

Figure 5.4 Future-state map for purchase order processing reduced to one process for all cases
![]() Documents are digitized upon receipt.
Documents are digitized upon receipt.
![]() Documents move through the entire process in electronic form.
Documents move through the entire process in electronic form.
![]() Only necessary documents are retained in electronic form.
Only necessary documents are retained in electronic form.
![]() The check-printing and mailing processes might be outsourced to a bank (subject to a cost-benefit analysis).
The check-printing and mailing processes might be outsourced to a bank (subject to a cost-benefit analysis).
![]() The process is clearly defined.
The process is clearly defined.
![]() Clearly defined performance metrics are visually posted for daily meetings.
Clearly defined performance metrics are visually posted for daily meetings.
Through a lot of work after the mapping exercise, the team achieved a 50 percent reduction in lead time, reduced the number of steps and reports, and eliminated the waste of 120,000 pieces of paper (minimum) per year, and the group for the first time had clear performance metrics for quality and productivity.
The purchase order maps are by no means complex or elaborate. In fact, compared to most manufacturing value-stream maps they are missing a great deal of information. The rate of customer demand (takt) was not calculated. There is no data at all, nor even times required for each step. Few of the icons that are common in value-stream mapping are used, such as inventory buffers. In this case the process was so variable that it did not seem worth getting to that level of detail. In other cases we have included more data, particularly when the service process is more routine and repetitive. For this team, and all others we have worked with, value-stream mapping has a number of benefits beyond the technical details of the maps:
![]() Teams communicate across functions to understand the perspectives of others.
Teams communicate across functions to understand the perspectives of others.
![]() Team members are shocked at the amount of waste, and that shock therapy ends questions about whether lean was needed or whether it applied to them.
Team members are shocked at the amount of waste, and that shock therapy ends questions about whether lean was needed or whether it applied to them.
![]() Team members increase their appreciation for the customer perspective and begin to identify the causes of customer complaints.
Team members increase their appreciation for the customer perspective and begin to identify the causes of customer complaints.
![]() Team members begin to think about their processes intentionally and scientifically, including how to measure performance and continue to improve.
Team members begin to think about their processes intentionally and scientifically, including how to measure performance and continue to improve.
Lean Principles Inform Target Conditions to Strive For
In Toyota Kata, Mike had a moment of clarity when he realized that tools like pull and standard work were neither process improvements to be implemented nor ends unto themselves. Instead he called them possible “target conditions.” A target condition is a work pattern that we hypothesize will move us a step closer to our desired goals. Consider a sports example. A desired outcome in basketball is to get the ball into the basket a high percentage of the time when we get to the free throw line. We might set as a target to accomplish this 80 percent of the time, and currently we are at 60 percent. Simply telling a shooter that the goal is 80 percent can perhaps lead to more practice, but if the posture, motion, and release of the shooter are poor, there is probably a limit to how well the person will be able to shoot.
A good coach will observe the shooter and notice obstacles to successful outcomes. Perhaps the coach will video the shooter in action and go through the tape in slow motion with the shooter so they both can see what happens. The coach is trying to understand the current process of shooting that leads to the outcome of hitting or missing the basket. A good coach will avoid inundating the shooter with a long list of things to improve. The shooter will simply be overwhelmed in thinking about so many things at once—how to set the feet, how to position the arms, how to hold the ball, how to move the arms and body in the shooting motion.
It is more effective to suggest one thing to practice at a time. Perhaps it is a change in the initial stance of the shooter. The desired stance can be considered a target condition that the coach, through experience, believes will lead to a higher success rate in getting baskets. And perhaps that alone might be expected to increase baskets by 2 percent. Both the way of shooting and the expected result would constitute the next target condition. After practicing that one thing sufficiently to achieve that target condition, the coach will again observe and suggest a next target condition, and so on. In other words, the coach is breaking down the complex task into specific desired patterns, which are learned through practice one by one, and a target for results. After each target condition the coach will decide what is next based on what was learned from the last experiment. The best coach will follow a somewhat different process for each student based on the student’s unique circumstances, even though the coach has a general set of principles and a sense of an approach that works. Through this iterative learning process, the student will get better, though perhaps with setbacks here or there. The setbacks are some of the best opportunities for the coach to teach the student—and for the coach to learn.
Deming taught us to focus on the process as well as the results. Identifying target conditions brings into focus process patterns we are trying to achieve. We often think of a tool such as value-stream mapping or a one-piece flow cell as a generic solution to a problem. We think that we aren’t getting the improvement results we expected from our lean management system because we didn’t create value-stream maps of all our processes, or we may think that if we have a cell, we will automatically get better flow, better productivity, more consistent production, and better quality.
When Mike Rother reflected on value-stream mapping, he realized that the future state map is actually providing a set of challenges and target conditions. Each piece of the map, such as setting up a cell, is actually a bundle of target conditions.3
If we think of establishing a one-piece flow cell as a target condition, it provides a totally different image than the usual one of implementing a tool. First we must answer the question of why. What is the challenge, and why do we believe a cell will get us closer to our particular challenge? A good understanding of the current condition relative to the challenge will help us identify whether this target condition, or some others, makes sense to test. If our analysis and time at the gemba suggests a one-piece flow cell is worth pursuing, then we would view this as a target condition. On a certain date in the future, our goal would be to have the cell operational. The concept of a target condition as something to strive for is well illustrated in Rother’s diagram (Figure 5.5).
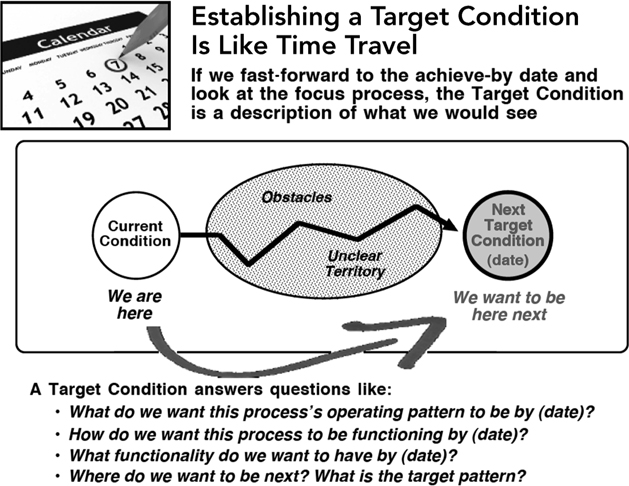
Figure 5.5 A target condition is a work pattern to strive for
Source: Mike Rother
The Role of Process Principles
In short, please do not confuse principles with solutions. A better approach is to view them as guidelines to stimulate thinking. As we show in Figure 5.6, the principles are mostly useful in the Plan stage of PDCA.
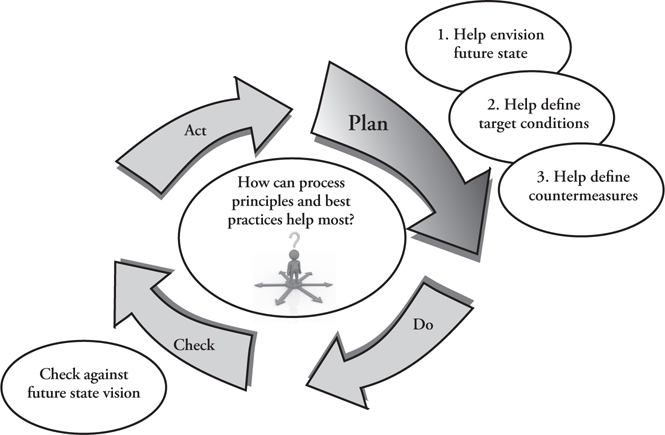
Figure 5.6 Process principles and best practices help most in identifying challenges, target conditions, and ideas for experimentation in the Plan portion of PDCA
They can help us to visualize our future state. They help us define our target conditions. This does not mean we fill in the blank in a statement like “Our target condition will be (principle).” A good target condition should be be far more specific and measurable and appropriate for our situation.
Process principles can also help us to identify possible countermeasures. Again the principles do not provide countermeasures. But they might trigger thoughts about possible countermeasures.
Beyond this we could refer to the principles in the Check stage to help us evaluate how well we did in implementation, but again there are dangers in this. We do not want generic lean audits, but rather we want specific checks that are appropriate for the specific target condition and countermeasure we are testing.
We have identified four macroprocess principles (see Figure 5.7), and we will explain each with examples. The principles were first introduced in Figure 2.11, where all 17 principles are listed.
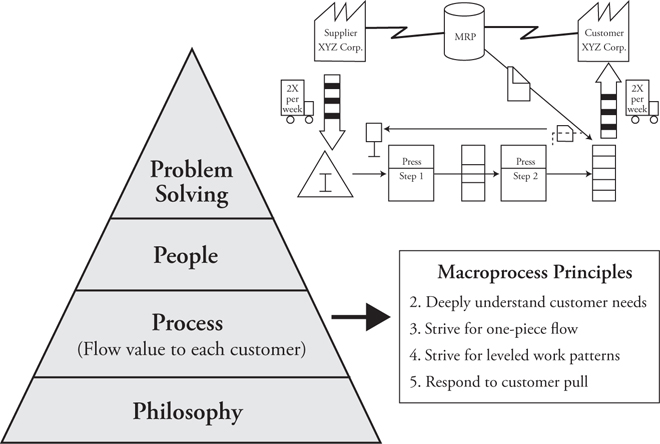
Figure 5.7 Macroprocess principles
PRINCIPLE 2: DEEPLY UNDERSTAND CUSTOMER NEEDS
Menlo Innovations: Creating Joy for Customers
When I think of a customer-centered organization, Menlo Innovations immediately comes to mind. I have visited hundreds of service organizations with some type of lean program, but Menlo is as close to a service organization that practices Toyota Way principles as I have seen, and the company knew almost nothing about Toyota when it formed its system. In fact, one of the founders, Richard Sheridan, learned about me when he was presenting about Menlo at a conference in California and an associate told him about The Toyota Way. Richard became excited and wanted to meet me only to learn we both live in Ann Arbor, Michigan. We became fast friends.
Menlo Innovations, LLC, is a custom software design and development firm for hire, located in Ann Arbor. If you go to the company website, you will see its funky, and very personal mission:
Our mission as an organization is to end human suffering in the world as it relates to technology. For our clients, we do this by creating software that is widely adopted and enjoyably used by their intended end users. We do this through a unique set of practices that include High-Tech Anthropology, paired programming, and working in an open and collaborative environment. Within our organization, we achieve this mission by intentionally choosing to create a culture founded on the Business Value of Joy.
Richard explains that Menlo focuses on three key stakeholders, who are often poorly treated in the software business:
1. Software project sponsors who traditionally have had little hope of steering projects to a successful conclusion before money and executive patience are exhausted
2. End users of the software who, far too often, have no voice at all in the design and yet must ultimately live every day with decisions of people who know little about them
3. The software teams themselves, who typically labor under years of overtime, missed vacations and family celebrations, and broken relationships and unrealistic expectations only to have many of the projects they work on never see the light of day
Menlo, a small but growing firm that by 2016 was up to 70 people, has cast a long shadow on the software development industry. On a typical day one might see tour groups from five different countries, a Fortune 100 company that has sent a team to go through a several-day workshop on the Menlo system, and customers lingering in the offices working with Menlonians (as they call themselves). There are remarkable aspects to Menlo’s culture that we will discuss in Chapter 7. For a detailed description of its systems for customer engagement, software development, and the development of a deliberate culture built on collaboration and learning, read Richard Sheridan’s Joy, Inc.
At Menlo, the customer experience starts with a discussion with the customer about the possibility of working together. The initial discussion can be pretty straightforward if the customers are already familiar with Menlo’s different approach to software development, or rather odd for the customers if they are not. As Michael Porter says, a real strategy includes what you will not do. There are certain givens that the customers must accept, or they are not suitable partners:
1. They must pay for a pair of High-Tech Anthropologists.
2. They must pay for pairs of software programmers who will be rotated every week.
3. They must be active participants in a collaborative learning process, including weekly meetings to review the work completed in the prior five days.
4. They must pay for an up-front stage of developing their requirements before they get a price estimate.
A customer who says no to any of these four conditions will not be a customer, and Menlo will even recommend competitors as service providers. Secretly the Menlonians will be thinking, “You will be back.” They specify those conditions, not to be stubborn or belligerent, but because it is the only way they know to achieve their mission of a joyful experience for all.
The actual development process begins with a pair of High-Tech Anthropologists who live with users to understand their beliefs, values, and work patterns and ensure the software meets actual needs, not simply professed needs. Interestingly Menlo has found the best at this role rarely have anthropology degrees or technology backgrounds. They have a certain combination of empathy, creativity, observational skills, listening skills, and a practical skill of turning what they learn into a vision for the software.
Though it is creative work, the High-Tech Anthropologists have a somewhat standard process that in lean terms starts with going to the gemba to see, without preconceptions, how the users do their work and use any existing software for the task.
An early challenge for the customer is to identify a primary user, and this is visually represented using a persona map (see Figure 5.8). The High-Tech Anthropologists, through their investigations, develop an image of each persona and write a story, a fictional account of a typical user role. The task of the customer is to identify one type of user as the primary persona who will be the focal point when developing the software. Menlo has learned that focusing on an average user, or too many users with different needs, muddies the process and leads to software that misses the mark for everyone. Customers struggle to pick one as they are at first convinced that all types of users are equally important, but eventually the customers settle on one primary user and a few secondary and tertiary users, with all others outside the target area.
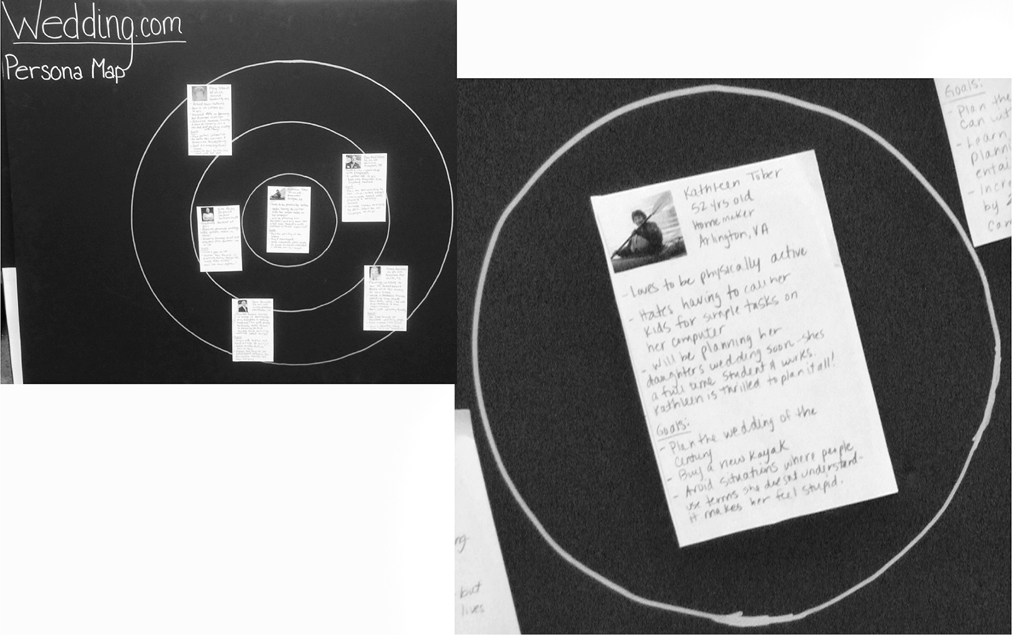
Figure 5.8 Menlo persona map for Wedding.com
Menlo developed a sample persona map based on a fictional company called Wedding.com that helps customers plan their wedding. One could imagine that the bride or groom would be the obvious primary persona, but the anthropologist and customer decided differently. They found the mother of the bride was most often the planner and also had less experience with web user interfaces than the couple getting married. Menlo created a composite profile of the “mother” called Kathleen Tiber. Among other characteristics she “hates having to call her kids for simple tasks on the computer.” Her goals are to “plan the wedding of the century” and “avoid situations where people use terms she does not understand.” Undoubtedly a simple and clear user interface is critical. The wedding couple are in the secondary circle, and the groom’s parents are tertiary users. Their needs will also be considered, but the features they use that are not of value to Kathleen will be a few clicks away from the home screen.
The anthropologists have intense discussions at whiteboards and develop mind maps of characteristics of the users and the software (see Figure 5.9). They spend a good deal of time crafting the purpose and desired features of the software. They consider many alternatives with the customer, often comparing pros and cons.
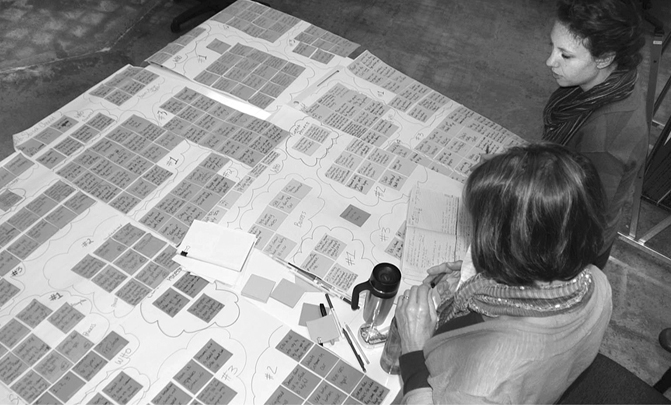
Figure 5.9 Mind maps to see the whole
As the anthropologists get a clearer picture of the users and software features, they write very specific “story cards,” one for each feature. For example, creating a button to call up possible floral arrangements is a feature that gets its own story card. Making a schedule is another feature that would get a story card.
These story cards become the basis for selecting what to include in the software to deliver value determined by the customer, and the cards also become the method for organizing the work of the programmers. In fact, a complete project plan will be built from these cards. The time to develop the actual code for each card is first estimated by several pairs of programmers. Then the cards are laid out on standard sheets to add up to 32 hours of work in a week (the other 8 hours are for various meetings like the customer review). This leads directly to a cost estimate based on a standard cost per sheet for a pair of programmers. The customer works with the team to decide on the actual project scope, “playing cards” and seeing what it adds up to in cost. If the cost is over budget, the customer must either drop some features, by eliminating story cards, or perhaps push them into a later budget cycle.
Every week, the customer meets with the Menlonians working on the project. These in-person meetings are usually at Menlo, or if necessary, at the customer’s office if it is located too far from Menlo. Virtual meetings are a last resort and at least one monthly meeting must be face-to-face. When the software is being developed, the customer tries the results of one week’s work on the computer while the anthropologists and programmers are watching. The customers have the story cards so they know what the feature should do. With no user manual they should be able to make the feature work—and be delighted by what they see. Otherwise it is back to the drawing board. At the end of the customer review, the customer decides what cards to play the next week. This is PDCA at its best, in short cycles with rapid feedback!
Notice that this process makes the standard practice of competitive bidding almost impossible. Typically the customer puts out a request for bid and then compares the proposals of different firms. The assumption is that the customer knows what he wants, or with a little research the contractor will figure out the scope of work, a project plan, and the cost. Menlo needs the customer to pay for a collaborative process to learn what the customer actually needs, which precedes any competitive bidding. If the customer were to shop these requirements to competitors, the competitors would not have the in-depth knowledge to create the software that will bring joy to the users. Menlo simply will not participate in conventional bidding games.
The result of this, and other parts of Menlo’s system we will cover later in the book, is 100 percent customer satisfaction. Often in companies using a traditional software development process, at the end of a major software project that takes one year or more to complete, there are long lists of change orders to correct buggy software that does not meet expectations. At Menlo the software is developed with the customer, and week by week it is either working to the customer’s satisfaction or not. In the last week of the project, all that needs to be reviewed is the last week of work. Menlo has a hotline for any customer complaints, which actually will ring over an intercom for all to hear, only it never rings. The people at Menlo cannot recall the last time they had a customer call to complain. Any issues with the software are uncovered week by week as it is developed and reviewed.
Zingerman’s Five Stupid Ways to Lose a Customer
In our experience a minimum condition for an excellent company is that customers come first. This does not mean that customers are always delightful, but service providers still need to be delightful. Another of the most customer-focused companies we know is the Zingerman’s group of small companies in Ann Arbor, Michigan. Zingerman’s has a number of food-related businesses including the original delicatessen, a restaurant called Zingerman’s Roadhouse, a creamery, a coffee roaster, a bake house, a working farm, as well as a mail order business, which we will discuss throughout the book.
Zingerman’s mission statement is as emotional as that of Menlo and equally reflects the reality of values practiced daily: “Enrich as many lives as we possibly can, make you happy, make you smile, showing love and care in all of our actions.”
Zingerman’s employees in all of its businesses are continually trained and educated through Zingtrain, the training portion of the business. It starts with the “Zingerman’s Guide to Good Service.” It is of, course, in the form of recipes. A three-step recipe card says:
1. Find out what the customer wants
2. Get it for them accurately and enthusiastically
3. Go the extra mile
Zingtrain dramatizes what not to do when dealing with customers by teaching “five stupid ways to lose customers.” For each way there is a Zingerman’s countermeasure or recipe:4
![]() Ignore them. Zingtrain notes that there are many ways to ignore your customers, but among the most popular are not greeting them when they come in the door and avoiding all eye contact with customers in your physical presence.
Ignore them. Zingtrain notes that there are many ways to ignore your customers, but among the most popular are not greeting them when they come in the door and avoiding all eye contact with customers in your physical presence.
![]() Recipe: The 10/4 rule. “When a customer comes within 10 feet of any staff person, we make eye contact and smile. Within 4 feet, we greet the customer.”
Recipe: The 10/4 rule. “When a customer comes within 10 feet of any staff person, we make eye contact and smile. Within 4 feet, we greet the customer.”
![]() Make excuses. Explaining to a complaining customer how he or she caused the problem by failing to follow the rules.
Make excuses. Explaining to a complaining customer how he or she caused the problem by failing to follow the rules.
![]() Recipe: Five-steps to handling customer complaints. Step 1 is “acknowledge the complaint” and step 2 is “sincerely apologize.”
Recipe: Five-steps to handling customer complaints. Step 1 is “acknowledge the complaint” and step 2 is “sincerely apologize.”
![]() Don’t let them into your business. This is my favorite. Keep customers out and they cannot disturb you! For example, don’t answer the phone and your customer will be effectively “locked out.”
Don’t let them into your business. This is my favorite. Keep customers out and they cannot disturb you! For example, don’t answer the phone and your customer will be effectively “locked out.”
![]() Recipe: Immediately answer all calls. Answer any phone after no more than three rings. If a call goes to voice mail during business hours, return it the same day. After hours return the call the next business day.
Recipe: Immediately answer all calls. Answer any phone after no more than three rings. If a call goes to voice mail during business hours, return it the same day. After hours return the call the next business day.
![]() Read them the rules. When you tell your customers what they have to do to place an order or pick it up, you are setting up the rules by which customers have to do business with you.
Read them the rules. When you tell your customers what they have to do to place an order or pick it up, you are setting up the rules by which customers have to do business with you.
![]() Recipe: Avoid the words “should” and “have to.” Staff are authorized to “do whatever it takes to make things right” and to “break the rules to give a customer a great Zingerman’s experience.”
Recipe: Avoid the words “should” and “have to.” Staff are authorized to “do whatever it takes to make things right” and to “break the rules to give a customer a great Zingerman’s experience.”
![]() Make it hard for them to give you money. Businesses say they are in business to make money, yet they make it hard for the customer to pay.
Make it hard for them to give you money. Businesses say they are in business to make money, yet they make it hard for the customer to pay.
![]() Recipe: “Work to eliminate any systems or policies that make it hard for the customers to give us money.” One example is an honor system for customers in the deli who want coffee: they can put money directly into a box with prices and instructions for payment written clearly on it.
Recipe: “Work to eliminate any systems or policies that make it hard for the customers to give us money.” One example is an honor system for customers in the deli who want coffee: they can put money directly into a box with prices and instructions for payment written clearly on it.
Another policy is that whomever a Zingerman’s associate serves, the associate should communicate through actions that “you are the best part of my day.” This policy goes beyond treating paying customers this way to treating in the same way anyone the staff comes into contact with.
Do We Know Anything About Our Customers’ Needs?
Working with many different types of service organizations, Karyn is often surprised by the lack of knowledge that they have about their customers, even in call centers in which customer service representatives talk directly to customers on a daily basis! Karyn often finds that organizations do not have any information at all about what their own customers want or need, but instead the organizations simply use industry benchmarks to set standards for customer requirements such as accuracy of the service or time to deliver the service. When organizations meet or exceed these industry benchmarks, such as 80 percent customer satisfaction or five days to process a financial transaction, they conclude that they are doing well and that their customers are satisfied. But are they really? What about the 20 percent of customers who are not satisfied?
Disatisfied service customers may not complain—or even fill out a customer satisfaction survey—they just simply won’t use the service again. As the Internet makes it easier for dissatisfied service customers to find and switch to different service providers, it is critical for service organizations to find out what their customers want and value and feed that information back to the processes that create those services and service experiences.
An organization that Karyn worked with had a problem with one particular part of its human resources process and did just that. The customers were the employees of the company. When Karyn first began working with the organization, customer complaints about the leave-of-absence process outweighed all other types of complaints. No matter where you went in the organization, or whom you talked with, that particular process was called out as problematic. As Karyn worked with the people on the team who were responsible for leave-of-absence processing, she found that they didn’t have direct access to information about the types or volume of complaints about the leave policy. Although the team members who processed the leave-of-absence transactions worked as hard as they could to improve their process, without information about what the errors were, all they could do was attempt to guess at what to try to change to fix the problems that they happened to hear about.
In order to solve this problem, Karyn and the processing team began to work with the customer service center that was responsible for receiving all customer complaints by call or e-mail. Every time there was a complaint related to a leave of absence, that information was electronically transmitted to the manager of the team who processed the leave-of-absence transactions. In addition, the manager of that team personally contacted each person who had been on leave of absence recently so that the members of the team could understand what their customers’ specific needs and requirements were of the process. A clear picture began to emerge: there was a policy on how customers (employees) got paid what was still owed them when taking a leave of absence. Customers wanted timely and accurate payments.
As the team members more clearly understood what their customers valued, they started to look for obstacles in their process that prevented them from creating leaves in a timely manner and processing payments accurately. And the way that they looked for those obstacles was to use the information about customer complaints that they received from the customer service center. Each time the manager received a service ticket about a complaint, he and the team member who had created that leave-of-absence transaction reviewed the process by which the leave had been created to look for the underlying cause. Once the causes were found, countermeasures were created and tested by the team. After a few months, the team was so proficient at using the information it received from the customer service center that the number of customer complaints was reduced to almost zero.
In services, our customers want us to solve problems for them—and they may not even know what those problems are—so we need to find out so that we can add value. Unless we know that, we are not ready to focus on other process principles, such as flow. There is a clear benefit from direct contact with customers. We saw in Chapter 3 what happened when the new CEO of United took a flight and learned firsthand what ordinary customers experience. Insulating airline executives from normal customer experiences also insulates them from understanding the customer. It is not always so easy to put yourself in the customer’s shoes, but it is always a powerful and sobering experience.
PRINCIPLE 3: STRIVE FOR ONE-PIECE FLOW WITHOUT STAGNATION
Value-Added Versus Stagnation
Have you found any of the following discouraging? Piles of stuff lying around your home or office, a lengthy list of e-mails in your inbox, customers waiting to be served, junk accumulating in your garage, a freezer full of old food? Then one-piece flow is for you.
Dr. Travis Bradberry, coauthor of Emotional Intelligence 2.0, provides what may be the best single white-collar productivity tip you will ever learn.5 He says, “Never touch things twice.” Never put anything in a holding pattern, because touching things twice is a huge time-waster. Don’t save an e-mail or a phone call to deal with later. As soon as something gets your attention, you should act on it, delegate it, or delete it.
Further insight comes from work by a group of academics. They studied what happens when people switch tasks frequently and found it has a devastating effect on productivity. In fact, it can take an average 25 percent longer when we switch between tasks A and B repeatedly instead of completing A before we start B. As the leader of the study, David Meyer, explains: “Multitasking is going to slow you down, increasing the chances of mistakes . . . Disruptions and interruptions are a bad deal from the standpoint of our ability to process information.”6
Karyn experienced this problem firsthand when her husband, Brian, an Asian studies professor, came to her feeling overwhelmed by grading papers. He was teaching three courses and did not have a student assistant to help him grade. He had multiplied the amount of time it took him to grade one paper by the amount of papers he had to grade each week and found he could not possibly complete the task in the amount of time he had. Karyn asked if he would like help to solve his problem, but of course, at first he said, “No. Academia is too different. There is no possible way what you do with lean could work for me.” Karyn waited.
Two weeks later, totally exhausted from very little sleep, Brian decided that he was ready for Karyn to help him take a look at his current grading process. So Karyn went to the gemba, Brian’s home office, to grasp the current situation. What she found was that Brian’s students e-mailed their papers as attachments. As soon as Brian received the e-mail, he would open the attachment to check to see if it had arrived in proper and readable format. Brian would then respond to the e-mail to let the student know that he had received the paper. Then he would go on to the next e-mail. After Brian had let all the students know that he had received their papers, he then went back to each e-mail, opened it and the attachment again, and printed out the paper to grade by hand (an undertaking not so value added for the student, as even Brian has a hard time reading his own handwriting). In order to maintain consistency in grading, Brian would begin by reading a paper, then read another for comparison, and then go back to the first, switching repeatedly between papers before applying a grade to each. After grading all the papers, Brian would then go into each e-mail a third time and respond to the student that the paper was graded and could be picked up at his office. Opening and closing each e-mail three times took a lot of time—none of it really value added to the student.
Karyn explained to Brian what he was doing, and together they generated some alternative methods. After a number of iterations of trying different things to reduce the number of touches and increase readability of comments to students, here is how the process works now: Students submit papers online on a Blackboard application the school uses. This ensures that they are in a correct and readable format, so Brian doesn’t have to check that; nor does he have to e-mail students that he received their papers, as the students can see online that their papers were posted. He types his comments directly onto the electronic copy of the paper, which is much better for readability. In the syllabus, he has given the students dates the papers will be graded by, so when they are ready, the students can just go into Blackboard and “pull” their graded paper. Brian scans through a sample of the papers online to understand some of the variation in approach and then grades the papers one by one, completing one before going on to the next. This has significantly reduced the amount of grading time to a manageable amount. And Brian even gets to sleep once in a while!
What Dr. Bradberry is suggesting, and what Brian began practicing, is striving for one-piece flow. If you watch an assembly cell in manufacturing, you want to see a smooth flow of work from station to station. The product is constantly in motion—going forward—with value-added work being done to it. An interruption in flow is waste. That includes rework because of defects, so automatically this requires zero defects. It requires equipment to function flawlessly all the time, so that preventative maintenance becomes essential. This image is often likened in Toyota to the smooth flow of water. Stagnant pools are the enemy of flow. I have been with Toyota sensei while they are walking through a manufacturing plant pointing and harshly saying, “Stagnation, stagnation, stagnation!!!”
Stagnation is another word for waste. The Japanese word muda (waste) has gotten into the lean lexicon, and unfortunately, sometimes lean is defined as a war on waste—eliminate muda. As we will discuss in later chapters, lean is much more then eliminating wastes one by one, but understanding the wastes in your system is useful nonetheless. The Toyota Production System identifies seven deadly wastes. We use healthcare examples to illustrate each waste:
![]() Overproduction. Duplicate charting, printing of clinical reports in batches to distribute whether they are needed or not.
Overproduction. Duplicate charting, printing of clinical reports in batches to distribute whether they are needed or not.
![]() Inventory. Retaining unnecessary forms or obsolete items, overstocking medications in closets, accumulating blood samples waiting for tests.
Inventory. Retaining unnecessary forms or obsolete items, overstocking medications in closets, accumulating blood samples waiting for tests.
![]() Transportation. Patients walking or being transported from place to place or materials moving around the hospital.
Transportation. Patients walking or being transported from place to place or materials moving around the hospital.
![]() Defects. Medication or surgical errors, incorrect charges and billing, or mislabeled blood samples.
Defects. Medication or surgical errors, incorrect charges and billing, or mislabeled blood samples.
![]() Overprocessing. Taking down unnecessary information from patients on admission, multiple forms with redundant information, requiring lengthy paperwork on release of patients.
Overprocessing. Taking down unnecessary information from patients on admission, multiple forms with redundant information, requiring lengthy paperwork on release of patients.
![]() Waiting. Patients sitting in waiting rooms, waiting for people to phone back, and waiting for equipment from supply departments.
Waiting. Patients sitting in waiting rooms, waiting for people to phone back, and waiting for equipment from supply departments.
![]() Motion. Keeping materials and tools in a location far from work, looking for information, moving or searching for patients, equipment, medication, or charts.
Motion. Keeping materials and tools in a location far from work, looking for information, moving or searching for patients, equipment, medication, or charts.
What customers are actually paying for is value-added work. Value added is any concrete thought or action that advances the work toward satisfying customer needs. For a patient that goes into the hospital because of chest pain, the only value added would be when relevant tests are conducted, doctors conduct the exam, the nurse or doctor explains the problem and its treatment, and the treatment is provided. Track a patient from when she arrives at the hospital to when she is back in her car, and it is likely she will spend three or more hours on a visit like this, even if it was a false alarm, while the value-added work probably takes 15 minutes or less.
If we were to discuss this with a hospital administrator, he might get agitated and explain that it is impossible to beam the customer from her car to the various places where she has to sign in and get examined. There is legally mandated data the hospital must collect on each patient, or it could be sued or shut down. What the administrator is describing is called “necessary non-value-added work.” By adding “work” to the term “non-value added,” we recognize that even someone checking a patient’s identification for the hundredth time is doing work and that it may be necessary in today’s context, but it is still not value added to the patient. It does nothing to address the chest pain. Even necessary non-value-added work can be sped up. What if we could take a thumbprint in a fraction of a second and have all the personal data we need called up and verified? We can do it using our smartphone, so why not in a hospital?
The Concept of Cells in Service Organizations
Cellular manufacturing is manufacturing’s way of making smaller versions of moving assembly lines. While the Toyota automotive assembly line is very long with hundreds of workstations snaking through the plant, a cell is generally small (5 to 10 processes) and may be shaped like a U or L or configured with two parallel banks of machines. The goal is to attain one-piece flow and also to be flexible enough to add or subtract people based on customer demand. Customer demand is represented as takt—the average rate at which customers are buying the product and different variants of the product (see Figure 5.10). When demand is stable or the schedule is effectively leveled by a scheduling group (as discussed in the section on leveling in this chapter), it is possible to accurately calculate the number of people, machine capacity, and work-in-process inventory.
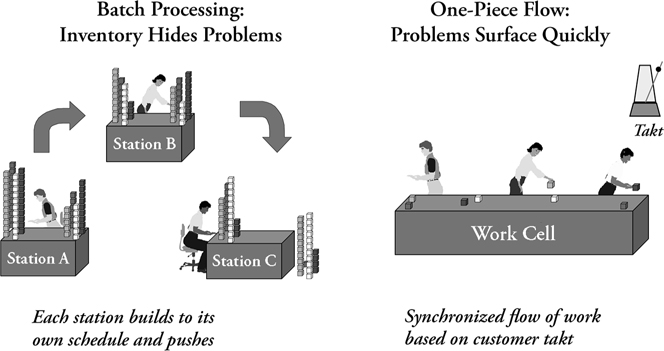
Figure 5.10 From hiding problems in batch processing to making problems visible through one-piece flow
This is all well and good if you have a relatively small number of products that physically flow and it is feasible to calculate a takt. How do we calculate takt and get so precise in highly variable service processes? In many cases the answer is simply that we cannot get so precise and it is a waste of time to try. Sacrilegious! For those who deeply understand lean, there is no religion—just practical realities. For many services one-piece flow is more of a metaphor to help envision a future direction than a precise model to imitate.
As an example we helped an auto rental company with a lean transformation focused on rental sites and all office functions. Behind the scenes of the rental sites that the customers see, there is a fleet office that manages the purchase of cars from auto companies and the allocation of those cars to different rental sites. Frankly, when we began working with the company, it was a mess, and sites never seemed to have the right cars at the right time based on customer needs. Part of the current-state analysis looked at communication patterns and waste of walking in the fleet office’s layout. On a typical workday, each employee walked almost 16,000 feet. They were grouped by specialty, and communication was poor (see Figure 5.11).
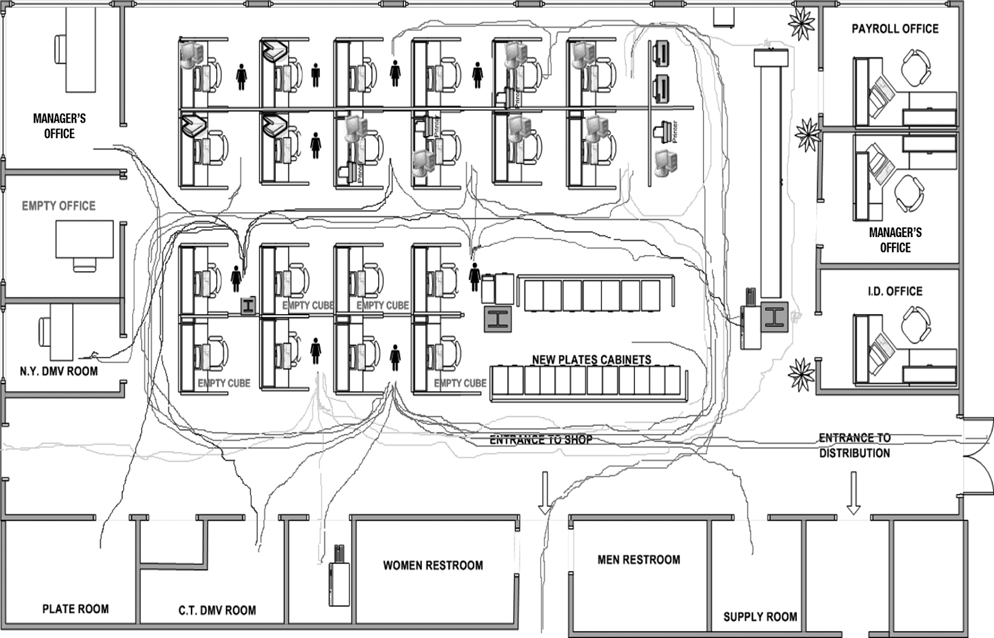
Figure 5.11 Auto fleet office functional layout before—spaghetti chart
A complete redesign of the work area layout to eliminate walls and create work cells composed of people in different functions working side by side cut walk time in half, improved communication, and improved getting the right cars to the right sites (see Figure 5.12).

Figure 5.12 Auto fleet office cellular layout after—spaghetti chart
We worked on a similar issue for a Navy repair and overhaul facility where employees put together work packages. These work packages were documents that needed to be filled out and placed in a folder to authorize a particular job done to repair or overhaul a submarine. Part of the task included researching the repairs needed and creating engineering drawings. Mapping of the current state and a spaghetti chart (Figure 5.13) of the work package process revealed a large number of handoffs (58), often from one department to another, and the documents were very well traveled (almost 31,000 feet).
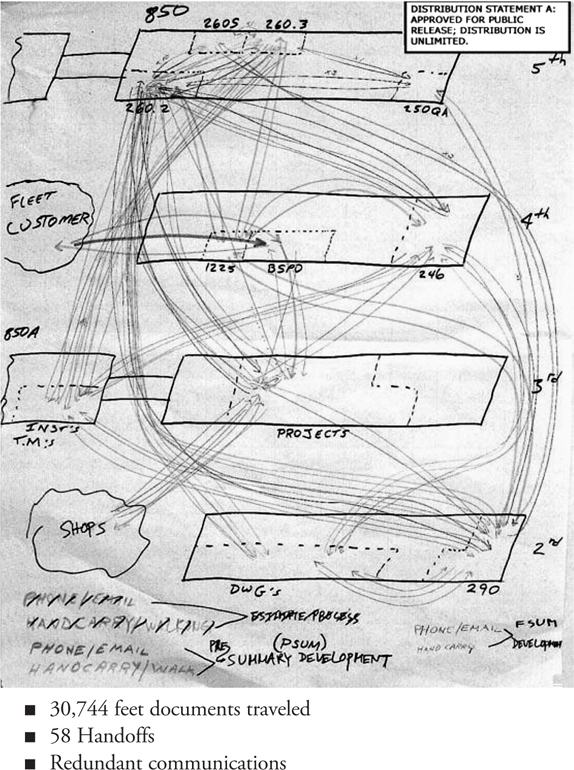
Figure 5.13 Spaghetti chart of moving of paper for work package in Navy shipyard
After changing the work area from people scattered across three floors of a building organized by functional departments to work cells for specific categories of work packages, there was a 55 to 92 percent reduction in travel distance (depending on the nature of the work package), a 67 percent reduction in process steps, and an 80 percent reduction in handoffs (Figure 5.14). Total lead time of creating a work package so that actual repair work could begin was reduced by 73 percent. As the new system was refined within the new layout, quality and productivity also improved dramatically. It is remarkable what can come of people with different expertise sitting side by side and working collaboratively.
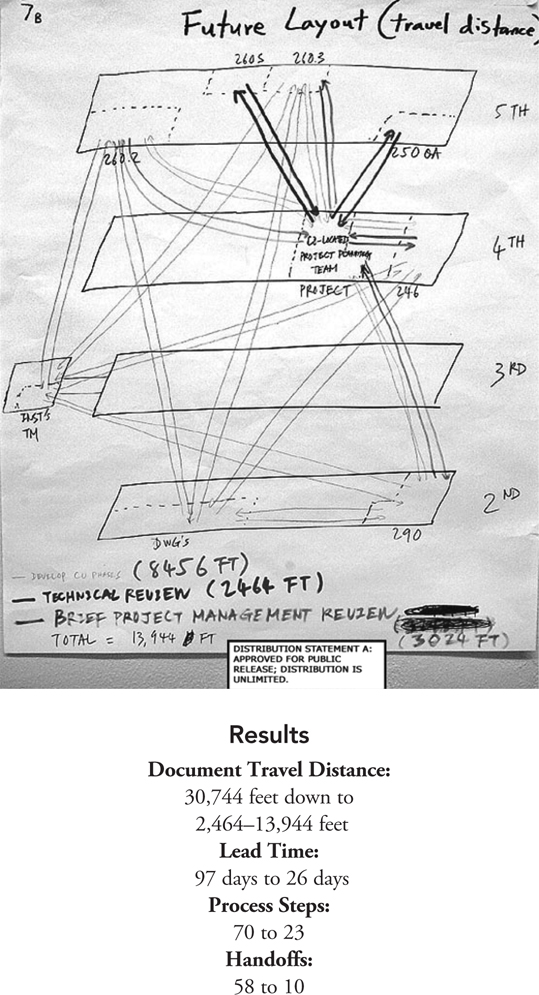
Figure 5.14 Spaghetti chart of moving paper for work packages in Navy shipyard after new layout
This is not to say that creating cells by changing the layout of the office is an ideal lean solution. Once again we emphasize that each organization must understand its own desired future state and find creative ways to achieve the right goals. We only want to emphasize that striving for one-piece flow, which has been so effective in manufacturing, can also be effective for office work to streamline communication and reduce lead time.
Zingerman’s Mail Order and One-Piece Flow
One type of service organization that learned this lesson is Zingerman’s Mail Order. Launched in 1996, ZMO receives and ships high-quality “artisan foods” throughout the United States. The core crew includes about 70 employees, but the workforce can grow to more than 400 during the holiday season, Thanksgiving through Christmas, when the company sells 50 percent of its yearly volume. Fortunately for ZMO, it grew rapidly, but unfortunately that meant even more chaos each year, as it needed to store more stuff and quickly outgrew whatever facility it was in. Every few years ZMO went through the painful process of moving to a larger warehouse where it could store more stuff. It was costly, but the company was profitable, so it thought the situation was one it had to live with.
In 2004 ZMO decided to try its hand at lean and sought help from one of my doctoral students, Eduardo Lander, who was studying lean in high-variety, low-volume organizations. Eduardo immediately noticed stagnation everyplace he looked. Boxes of stuff were piled high, raw materials were scattered everywhere—including in aisles—and there was no discernible flow. ZMO was doing a lot of batching. For example, it prepared all the orders for cheese on trays at the beginning of the day, and then the trays were piled meters high and stuck someplace. Team members seemed to spend as much time walking around finding stuff as preparing customer orders. As Eduardo explained:7
At the beginning of the day each support process would work to prepare the product indicated in the end of day sheets. The line would only start running when all support processes were done with their prep work and all products were available for picking. At this time, the order starter would place pick sheets in tubs and put them on the conveyor as fast as the line would take them. If she saw that a station had little work, she would sort through the orders and release some that increased the load for that person. Alternatively, she would also move people from low to high load areas to try to speed up the line. Unless done very carefully, the combination of these two practices created waves of orders that exacerbated the imbalances and further amplified precisely the problem the order starter was trying to solve.
As a first step, Eduardo recommended creating some semblance of flow using a conveyor system. At the start of the line, employees select the items customers order (see Figure 5.15) and put them in bins. Flowing on conveyors, they go through a variety of checking and boxing steps, and then the packaged orders flow directly to the truck they are loading for shipping. To their credit the senior leaders worked with Eduardo and took the risk of developing and using the flow line just in time for the busy Christmas season. It worked a bit crudely but was a marked improvement. Next, Eduardo said the company needed to stop batching and instead cut the bread and cheese and prepare the dairy products, one customer order at a time. It was rough, but there was an immediate positive impact. Order was being introduced into what once had been chaos. Customers’ orders were being assembled faster, in sequence, and the error rate was reduced. Aisles were cleared, and space was freed up.
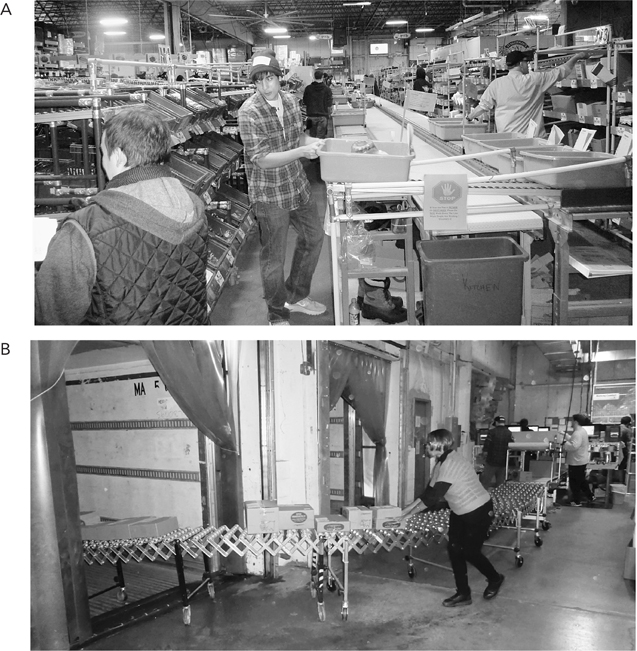
Figure 5.15 Flow through Zingerman’s Mail Order
A. Picking product on a flow line
B. Packaging orders and moving boxes directly onto a UPS truck
ZMO has continued on this path for almost a decade, and now flow is clean and smooth. A daily takt (the minutes in a day divided by expected customer demand for a given day) is calculated showing the number of seconds available to pick an order and put it into a container. This paces the operation. What is interesting is that the number and size of orders varies every day and throughout the day. Under such conditions it is easy to throw up your hands and say takt cannot be calculated. Instead ZMO has developed five standard takt levels measured in seconds, all of which are multiples of 8 (8 seconds, 16 seconds, 32 seconds, etc.). Standard staffing has been established for each takt. Each day, based on actual orders and forecasted orders, the takt is set. At the beginning of the line, in the pick zone, a computer system schedules customer orders based on the takt and prints out the picking list for each customer at the rate of takt. The takt is not precise, as orders are being added as people call in during the day. If there are fewer orders than expected, employees leave early, and if there are more orders, employees will work late. Throughout the day, floor leaders have some latitude to change the takt if they see a need.
Notice on the takt board in Figure 5.16 that there are places to write in the planned takt, the forecasted takt, and the actual takt, along with a column for why. Forecasted takt is what is forecasted based on general trends. Planned takt is what is set for the day based on what is entered into the computer system about actual orders and backlog by that morning. Actual takt is the adjustments made by managers as the day proceeds. Making these differences visible is an important part of the continuous learning system. Differences between what is expected and what actually occurs have many possible causes, and as those deviations from expectations are addressed, the system becomes increasingly stable.
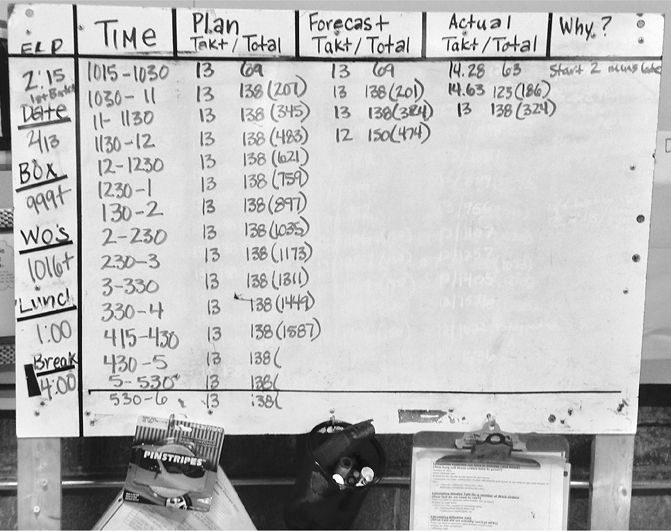
Figure 5.16 Actual versus planned and forecasted takt at ZMO
One of the most dramatic benefits for ZMO is that it has been able to stay in the same facility for almost a decade. It has also seen large increases in customer satisfaction and profitability. In the short term when the changes were first introduced, labor cost as a percentage of sales was reduced by 38 percent, boxes per labor hour increased by 47 percent, defective shipments were reduced by 18 percent, and the cost of mistakes was reduced by 29 percent. Needless to say, the owners are deeply committed to lean over a decade later.
Striving for One-Piece Flow in Payroll Processing
What about service organizations that don’t have a “product” that they can see moving down the line like ZMO does? What if your organization processes bank transactions or answers customer inquiries? In working with these types of service organizations, Karyn often experiences conversations in which people can explain the concept of flow in theory, but they cannot answer the question, “Please tell me what flow would actually look like in one of your processes?” Even if you can’t easily see your “product” moving, it is still possible to create flow. The key is to find the places where batching and stagnation are occurring.
One such organization, a third-party human resources and payroll processing company that Karyn worked with, had a problem that surfaced as customers called to complain about seemingly incorrect delivery charges on their bills. The customers’ bills seemed to show charges for extra payrolls that had not been requested. When the customer service representatives who answered the phone researched these situations, they found that the extra processing and delivery that the customers had ordered had taken place two or three months in the past but had never appeared as a charge on their bill for that time period.
As you can imagine, having extra charges on their bill that they couldn’t account for caused customers to be very unhappy, and the customer service representatives who handled those calls had to spend a lengthy amount of time researching and correcting bills and refunding those charges. The company was also unhappy, as it did not get revenue for extra processing and delivery that customers had requested months earlier. In order to solve the problem, a team of customer service representatives, accounts receivable clerks, and delivery personnel was created. The first thing that the team did was go to the gemba to study the process and deeply understand the current state.
Here is what the team found:
1. When a customer called to order an extra payroll during a billing cycle, the customer service representative would create a paper billing form for the extra processing and delivery fee.
2. The customer service rep would then leave her workstation and walk downstairs to the basement processing area, where she would give the paper billing form to the delivery coordinator. The delivery coordinator would then arrange for the extra payroll to be processed and delivered.
3. After the delivery coordinator had arranged for processing and delivery, he would put the billing form into a pile to enter into an Excel spreadsheet “when he had time.”
4. Since the delivery coordinator was very busy arranging for deliveries, he only had time to enter the billing forms onto the spreadsheet about once a month.
5. After the delivery coordinator entered all the charges from the batch of billing forms that had built up during the month, he would print a copy of the Excel spreadsheet and bring it back upstairs to the accounts receivable department.
6. The accounts receivable clerks would then enter the charges from the Excel report onto each customer’s bill; unfortunately, however, this was sometimes two months after the customer had requested the extra payroll processing and delivery.
The team also found out that there was no way to put a note in the system that would print the original date of the transaction on the bill so that the customer would know when the extra payroll was processed. All extra payroll and delivery charges appeared to be from the current billing month, whether or not they were processed in that month. Since there was no way for customers to tell that the charges were from previous months, and at that point, most didn’t even remember these transactions, they would call their customer service representative to complain.
As the team members examined the process and understood the current state deeply, they realized that what had first appeared to be a billing problem was really a flow problem: batches of billing forms were backed up and waiting to be entered into a spreadsheet; then those same batches of billing adjustments had to be entered onto clients’ bills—stagnation, stagnation, stagnation.
After coming to the realization that the problem was not a billing issue but a flow problem, the team worked together to create countermeasures that would eliminate batching and waiting. With some help from the IT department, the team came up with the following process to use when customers ordered extra payroll processing and delivery:
1. The customer service representative who answered a customer’s call to process an extra payroll and delivery entered the information onto a SharePoint form (created with the help of the IT department) while on the phone with the customer. The form calculated the processing and delivery charges automatically, and on that same phone call the customer service rep would give the customer the total charge that would appear on the next bill.
2. After the customer approved the processing and delivery charges, the customer service rep would immediately submit the form, which was routed automatically to the processing department so that the extra payroll could be created. At the same time, an e-mail, with a standard subject line, was generated to the delivery coordinator so that he could arrange for the delivery. Also, as soon as the form was submitted, the information about processing and delivery charges automatically went into an Access database.
3. Each day, at the end of the day, an accounts receivable clerk would call up the Access database and pull the information for that day’s extra processing and delivery charges and enter the information onto each customer’s bill—the same day the extra processing and delivery took place.
No more batching. No more waiting. Information flowed directly from the customer service representative to all parties who needed it. Charges were entered on the same day that they occurred, and since the customers were already aware of and had approved the charges, they recognized them when they saw them on their bill. No more angry calls to customer service representatives. Also, since the customer service representatives no longer had to leave their desks to walk paper billing forms to the basement, they no longer missed processing other customers’ payroll and HR transactions. Once they hung up from processing the extra payroll a customer needed, they were immediately available to help another caller.
Does the principle of flow apply in nonmanufacturing environments? Of course! No matter what type of service organization we work in, we should aim for a smooth flow of work without stagnation, completing one task before moving on to the next. Whether it is an academic process such as grading papers, a transactional office environment, or a highly variable operation like assembling food orders, it is possible to use the process principle of flow as the catalyst to finding unique solutions to address the unique problems each organization has.
PRINCIPLE 4: STRIVE FOR LEVELED WORK PATTERNS OR BE LIKE A TORTOISE
We have discussed the misconception that lean is only about eliminating waste. In a broader sense, we are striving for flowing value to customers, and as a result of that striving, we will identify obstacles that are wastes and find ways to overcome them; however, the desired future state should include more than what we are doing today, with less waste. We also need to work to achieve a more leveled state. In Figure 5.17 we show the need to overcome obstacles of muda (waste), mura (unevenness), and muri (overburden)—the three Ms. In other words, smooth flow means low variability. We would like to achieve a steady, stable process like the tortoise, not a fast and uneven process like the hare in the famous fable. This will be good for customers and our team members who are no longer overburdened.
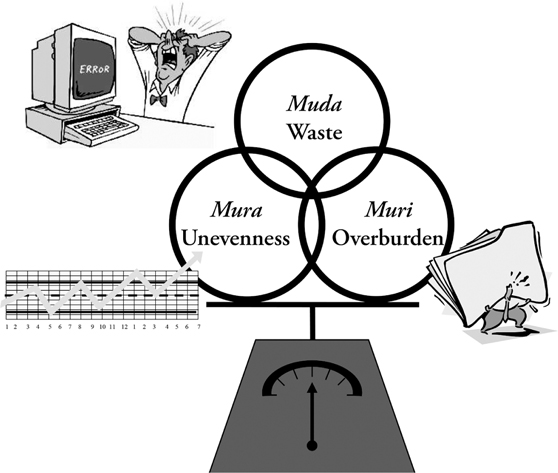
Figure 5.17 Eliminate waste, unevenness, and overburden
Source: Jeffrey Liker, The Toyota Way.
The three Ms are interrelated. Unevenness, or starting and stopping, leads to waste as we restart. Unevenness also means that we will have a light workload sometimes and be overburdened other times. Wastes like defects and overproduction will lead to unevenness and overburden.
Leveling Production at Toyota
Toyota works very hard to achieve a leveled flow. In manufacturing this translates to a leveled production schedule. Customers order vehicles in a somewhat random sequence and timing. We cannot ask customers to order one vehicle each minute in a sequence convenient to build. But if average demand is for one Camry each minute, it would be ideal if orders came in at one Camry per minute. Toyota makes multiple models on the same production line, such as a Camry with a gas power train on the same line as a Camry with a hybrid power train. The hybrid power train requires extra parts and takes longer to build. Building exactly to order would create unevenness, which could mean many hybrids are scheduled in a row, overburdening the assembly line. So Toyota does not build in the sequence of actual customer demand. Production control takes in orders and smooths out production, so that manufacturing and assembly departments build orders in equal intervals and in a leveled mix: for example, three gas Camrys followed by one hybrid, and so on, at a rate of one car per minute (see Figure 5.18).
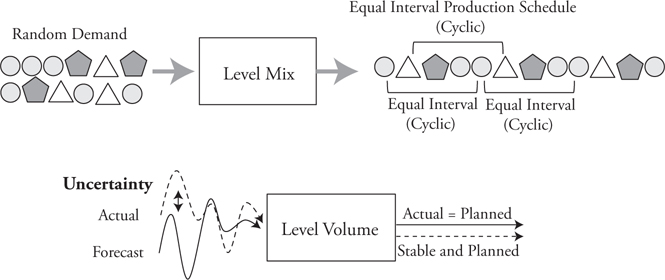
Figure 5.18 Production control levels the schedule
Source: Hiroshi Ozawa and Jeffrey Liker, “Balancing sales needs with supply chain needs: Production control as the arbiter,” Int. J. Lean Enterprise Research, Vol. 1, No. 4, 2015.
Of course, production control can only level within the limits of actual customer orders, which may be overwhelmingly one type of vehicle one day followed by a different type the next day. How production control handles this problem depends on the purchasing patterns of each country. In Japan, customers usually know well in advance when they must sell their cars to avoid large taxes on older vehicles. Since they must plan ahead they order new vehicles months in advance of needing them allowing Toyota to level the schedule. Production control can then schedule production over those months to fit the way manufacturing want to build them.
To achieve a leveled schedule, production control balances sales, operations, and demands on the supply chain (see Figure 5.19). In the United States, production control has divided the country into regions with regional sales offices. The regional offices provide their requests based on requests from dealers and forecasts, and production control allocates the number and mix of vehicles to each region. The regional Toyota offices then allocate the vehicles to dealers. This allows production control to allocate based on the constraints of production and supply chain and balance the interests of these three parties. Since the dealers hold inventory on the lots, this provides a buffer so the factories do not need to produce exactly what the customers want in the order of demand. By leveling the schedule at the final production stop in the Toyota assembly plant, the company also is smoothing production to suppliers, which has an even bigger positive impact.
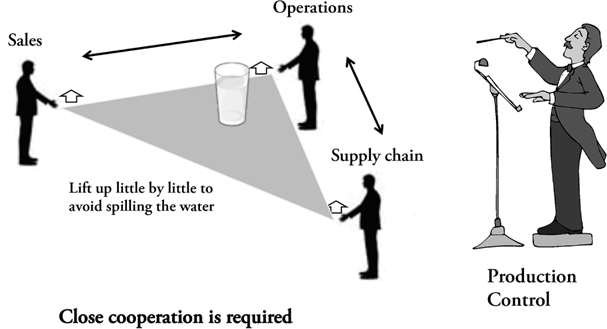
Figure 5.19 Production control balances sales, operations, and supply chain
Adapted from Hiroshi Ozawa and Jeffrey Liker, “Balancing sales needs with supply chain needs: Production control as the arbiter,” Int. J. Lean Enterprise Research, Vol. 1, No. 4, 2015.
The result is that an individual dealer may not have the ideal vehicle for a customer. When this happens, the dealer has several options. (1) Negotiate with the customer on price for a vehicle that is almost what the customer wants, (2) go online and look into the inventory of other dealers and negotiate a swap of the vehicle that is close with a vehicle that has exactly the options the customer wants, and (3) order the exact vehicle desired from Toyota. Toyota has the ability to change the schedule in the factory within days before production. The trade-off is that the customer can either get something similar on the spot, get a swap within one to three days, or order a car to exact specifications that would be delivered within weeks. In the United States, the majority of vehicles are purchased off the lot, about 25 to 30 percent are swapped, and about 5 to 10 percent are built based on a specific customer order. The large majority of customers simply do not want to wait for their special order vehicle to arrive.
Now you may be thinking that you do not have the power of Toyota to manipulate the timing or specific service your customer requests. “We only supply based on actual customer orders, which are uncertain.” This is the case with ZMO, and as we saw, it adjusts the takt every day and even within the day. So at least within a day the work is quite level. The leveling point is when the customer items are picked and placed in bins. A computer system takes in actual orders and levels them as best as possible so the pickers are not walking all over the place to select items. They pick from one zone and then move to another zone in a stable sequence. Depending on the actual orders, this is not always possible, but the computer system still works to level as much as possible, which greatly reduces wasted walk time and improves productivity. Before ZMO learned about lean, it did not even try to level the schedule and incurred the penalty of extra waste and overburden.
Leveling Software Development Work at Menlo
The people at Menlo Innovations also do what they can to level the workload, even though they are doing knowledge work and it is uncertain how long it will take to create computer code for a certain feature. As we discussed, the technical anthropologists create a story card for each feature. Then several pairs of programmers discuss each feature and estimate how long it will take to code in intervals of 1, 2, 4, 8, and 16 hours. They do not attempt to be accurate to the minute. They combine their estimates into one that is then written on the story card. The cards are put onto schedule sheets in full days of work, and the cost estimates are determined by the number of estimated hours. The customer then decides which “cards to play” week by week. The customer is only charged for the actual time taken, which could be higher or lower than the estimates.
The cards for the week are visually displayed on work authorization boards (see Figure 5.20). The names of various pairs of programmers are written on cards across the top, and cards with the days of the week are pinned down the side. The programmers select a card to work on, program it, test it for quality purposes, and then use colored sticky dots to indicate the status of the card; yellow means they are working on it, orange means they have completed the programming but are waiting for a quality advocate to check it, green means it has passed the check, and red means they are behind and having trouble. The program manager can easily see how all the teams are doing against the plan, and the cards show that the teams are working steadily toward the goals. Lateness is not punished. It is expected that the time estimates are rough and often wrong, but on average they are quite close to the actual time. And everyone learns from the differences between planned and actual, so estimates tend to improve with experience.
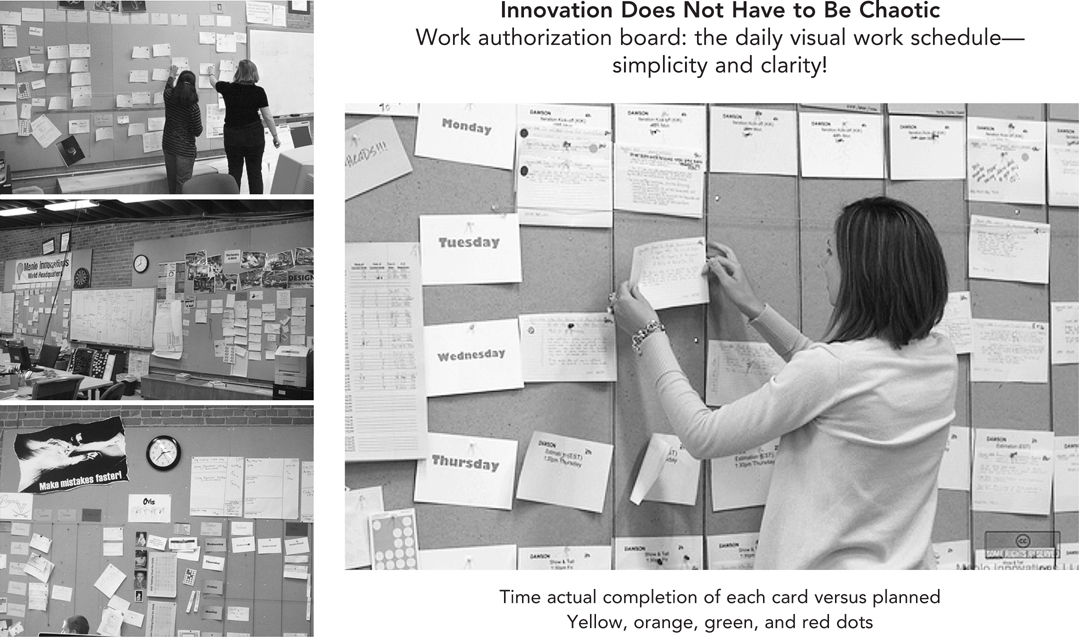
Figure 5.20 Program to a story card to pace knowledge work
Menlo also has a more level workflow because the programmers get rapid feedback and can design in quality as they work. The quality advocates approve each story card when it is programmed. Customers review the software every week. The paired programming allows each teammate to check their partner’s work as they code. In traditional software development, those checks are at milestones that are months apart, so programmers will work at a certain comfortable pace for months, perhaps being distracted by other demands, and suddenly have to hit the gas pedal and go like crazy to finish in time for the milestone review. We all have heard of programmers who work through the night to finish their software. The quality of their work suffers, and they suffer personally from all that stress. The Menlo programmers have a certain level of stress all the time, but it is good stress, the stress of working slowly and steadily, knowing other people care about their work enough to continually review it.
Menlo employees work slow and steady each day like a tortoise and are remarkably productive. Customers are often concerned when they learn that they will need to pay for a pair of programmers working on each task. Most software programmers work alone on their own computers. Comparisons have suggested that even though Menlo insists on people working in pairs, the company is several times more productive than its nonlean competitors. The stimulation of working with another person keeps each programmer focused, and they can work slowly and steadily where the individual programmer often has a burst of energy and then takes breaks. And Menlo employees go home after eight hours and do not work weekends keeping fresh. Menlo speaks of the joy of completing tasks one by one and the joy of going home on time.
Leveling Call Center Work at ZMO
Karyn has found that service centers in direct contact with customers find it hard to imagine how they could possibly level their workloads. Calls, e-mails, and faxes come when they come and have to be dealt with immediately. Service providers lament, “There is absolutely no way for us to predict how many customers are going to call us today.” Yet Karyn will also hear, “Once the West Coast goes online, we see a spike in calls every day between 11 a.m. and 1 p.m.” She has heard operations complain, “It is impossible to know when and how many orders sales is going to be able to sell this month, so there is no way to plan,” while the same groups will then complain, “Since sales has monthly quotas and a deadline during the last week of the month, we’re always light on orders at the beginning of the month and swamped at the end.” As a starting point it is important to study the actual state to see where there are patterns. It is quite common one will find at least some self-inflicted peaks and valleys.
There are two ways to deal with the wild swings in demand: reduce the variability in customer orders or find a way to adjust staffing to the highly variable workload. Reducing variability may require changing sales incentives plans. For example, a cost-benefit analysis might show that, like Toyota, the disruptions caused by end-of-month sales bonuses are not worth the gains. Or it may be necessary to change the way resources are scheduled to deal with uneven demand. In the case of the big jump in calls between 11 a.m. and 1 p.m. each day, further study showed that customer service representatives’ lunch hours all took place between 11 a.m. and 1 p.m. After experimenting with alternative lunch schedules, wait times decreased, customer satisfaction increased, and customer service representatives felt much less burdened.
Zingerman’s Mail Order call center found a creative way to flex resources to deal with highly variable sales calls. The staff members witnessed the remarkable lean transformation of the warehouse while they were on the sidelines and decided to try their own lean concepts.
Throughout the year there are peaks and valleys in calls day to day and within a day, and Zingerman’s policy is each caller is the “best part of my day.” This means that the employees will never discourage callers or try to cut calls short. And when the company studied demand, it found there were some clear busy periods during a day, but not in such a way that ZMO could have staff come to the office for busy periods and then go home. The company decided the answer was to flex resources based on call volume.
Typically, staff members would sit at a computer and wait for calls. Some were busy, while others were waiting, and it was almost random who would answer the phone. The staff had seen the systematic and standard processes in the warehouse and decided to experiment with a “hot seat.” When call center representatives are in the “hot seat,” the only thing that they will do is answer phone calls from customers. They are totally dedicated to taking care of customer calls, and their attention is not diverted, nor is their flow broken, by trying to do other work at the same time. When more calls come in than the person in the hot seat can handle, a second hot seat will be opened up, and so on. Customer service reps rotate through hot-seat assignments, each of which lasts two hours.
While some reps are dedicated full time to the hot seat, other reps are freed to leave their stations to do ancillary tasks in the room, such as deal with web orders, check voice mail, issue refunds and credits, and even water plants and empty compost. In order to ensure that all tasks are completed, each day the call center representatives make the ancillary work “visible” by using a board for all these ancillary tasks (see Figure 5.21) organized by time of day.
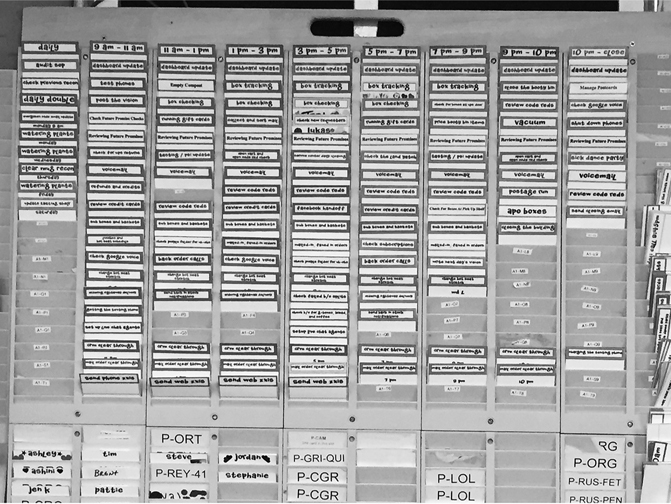
Figure 5.21 ZMO call center ancillary work board
Each card in a slot on the board represents one task and is red on one side and green on the other. Tasks that are not yet completed are red. When reps are freed of the hot seat, they select the next red card and go to work. When they complete the task, they turn the card over to the green side and place it back into the slot; this allows all the call center representatives to see if the tasks are being completed during the planned time frames. If the time slot has passed and a card is still red, the team members can easily see it and make that a priority. They can also study why their planning process failed and improve how they plan.
It was particularly important to work out the system in the quiet part of the year so they could deal with all the chaos of the busy holiday season. By the time the holidays hit, the system was fine-tuned and could be taught as standard work to the temporary workforce. Also, with the huge increase in volume, the hot seat becomes a “hot cell” of a group of service representatives.
Although service organizations often believe that leveling is impossible for them because they cannot simply copy what Toyota does, as we can see from the above examples, with some creative thought it is possible to become more level. Leveling is not something to implement with one solution, but rather a challenge to work to achieve step by step over time. There will always be variability, but there are many ways to reduce variability—making better plans, using standard processes, influencing customer orders, building in buffers, doing the job right the first time, finding ways to assign people to the customer-facing work with ancillary tasks for those available at the moment, and so on. Each organization must experiment over time to get as close as possible to stable, leveled flow to customers. Each service organization, with its own set of customers and circumstances, will have to deeply understand its particular causes of variability and, over time, work to reduce them.
PRINCIPLE 5: RESPOND TO CUSTOMER PULL
Of course, fabulous flow is not useful if too much of the wrong product is produced. Think of a smooth-flowing river that overflows its boundaries and floods the town. Then we need a dam to protect the town. Dams are buffers, which is often part of a pull system.
There are many simple examples of pull in daily life. We go to a coffee shop and order exactly what we want, and the barista makes it to order. In other cases we keep some inventory and then replenish that inventory based on usage. For example, we look in our refrigerator and see how much milk we have and decide whether to purchase more. We may have a general, or even specific, policy—when we are down to one quart of milk, we purchase up to two more depending on our plans for the next three days. In lean terms we are using our refrigerator as a marketplace.
Toyota’s concept of a marketplace in which we store inventory and replenish it based on usage was inspired by supermarkets. No good supermarket will continually bring product out to the shelves regardless of usage. A stock clerk looks at a defined space for a product and sees how much the customer takes away. The clerk replenishes up to the space allotted on the shelf.
Let’s consider the basic concepts for using our refrigerator as a marketplace:
1. A customer (family) and supplier (store)
2. Defined location to store the inventory (specific shelf space)
3. Trigger point for replenishment (e.g., one quart remaining)
4. The batch size to be picked up (e.g., two quarts of milk)
As we can see from this example, if we misjudge usage or fail to replenish according to our plan, we might end up with too much milk and have to dispose of some when it gets old; or we might end up with too little milk and are stuck without milk for breakfast. In other words even a well-designed pull system does not automatically solve all our problems and is dependent on human judgment and discipline.
An even simpler example is the way I use pull for the salt for my water softener. The salt comes in 40-pound bags that I periodically lug home. I pour the salt into the water softener and close the top, and the only way to know how much salt is left is to remove the top and look. Periodically I forget to check, and my wife notices the water is funny. I check, and there is no salt. I do not want it to be empty until I get some more, so I keep one bag in a designated spot and only use it when the water softener is near or at empty. This is my safety stock. The space on a floor with the last bag of salt is a kanban, a signal, telling me when I use the last bag to go to the store and lug some more home.
At ZMO there are small inventory buffers throughout the building. Before lean there were mountains of inventory, and they were stored wherever there was space. Now everything is deliberately controlled by kanban. Pickers use printed-out pick lists to fill customer orders from items on flow racks. When the pickers first pick a product from a new bin, they take out the kanban, a ticket that describes the food and specifies the size tote, the quantity that is kept in the tote, the address in the warehouse, and the address on the flow racks. The addresses are like postal codes. This is an order for the material handler to refill a small tote on her next material handling route to the warehouse—like a shopping list made by the customer. The dry goods inventory is stored in a warehouse in designated locations. Material handlers bring bins of goods to the picking line and load gravity-fed racks from the back that slide to the pickers, and the cycle continues. The process is diagrammed in Figure 5.22. Photos of the labeled racks and kanban are shown in Figure 5.23.
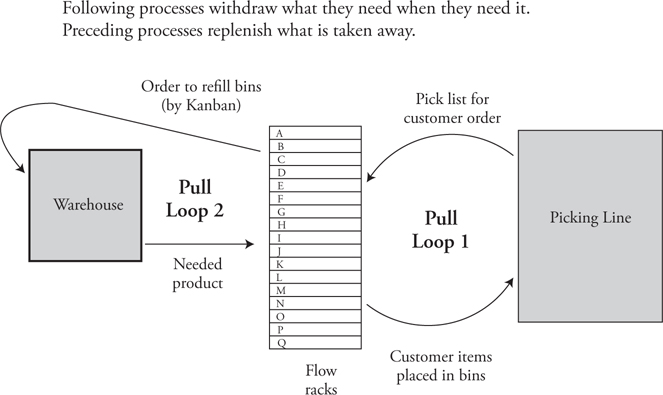
Figure 5.22 Pull system to ZMO line to pick customer orders
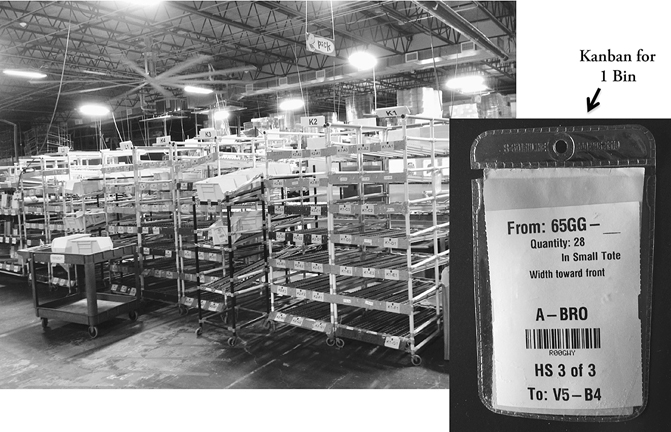
Figure 5.23 ZMO flow racks for pick line and kanban (replenish from back)
A type of pull system can also be used to control the flow of knowledge work. One example is from a company’s engineering analysis department we worked with. In this department, analysts used a sophisticated computer system to determine stresses and strains on automotive exhaust system parts. Customers made requests, and the engineers determined who would do the analysis. In the past it was a push system. As customers pushed work, the tendency of the engineers was to get started on the analysis as soon as possible. There were typically 20 or more active projects in various stages of analysis for three engineers. When a customer called in to complain that his request was taking too long, the status of his project was not even clear. The engineers then tried to expedite the work, pushing back other work. There was concern because the workload was expected to increase, but there was no money budgeted to hire more engineers. The target of the lean project was to eliminate enough waste so the existing engineers could handle 25 percent more work.
The solution was to make the status of projects visible and put a cap on the number of projects that the engineers would have in process at one time. It was determined that 12 active projects was the maximum the group could handle. A work status board showed the active projects assigned to each engineer and the expected start and completion dates (see Figure 5.24). A new project would not be started until 1 of the 12 active projects was complete. Think of the 12 projects as the number of slots in the supermarket. When one slot is empty, it is a pull signal to begin one more project. The engineers also recorded on the board the percent complete on a pie graph. There were a few other changes to support this, such as developing standard work for performing the analysis to make the time to completion more predictable. The result was that the engineers were able to perform the 25 percent additional work, the company didn’t have to hire an additional engineer, and on-time completion went from an average of 80 percent to near 100 percent. Ironically they were starting some projects later but completing them earlier.
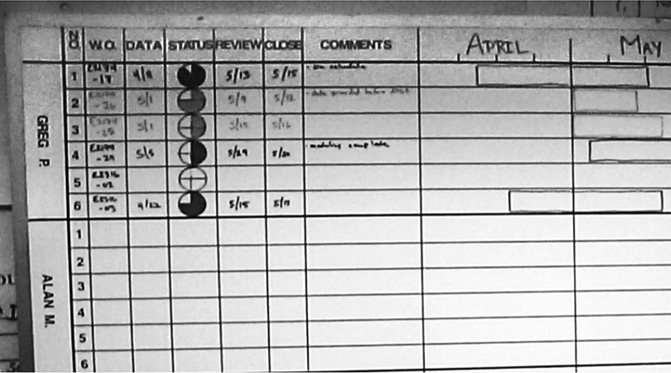
Figure 5.24 Work status board for engineering analysis
USE PDCA TO IMPROVE PROCESSES TO ACHIEVE DESIRED OUTCOMES
Dr. Deming warned, “We should work on our process, not the outcome of our process.” We suspect, as the opening quote at the beginning of the chapter suggests, he was frustrated by regularly observing people struggling to meet management targets while trying to overcome poorly developed processes—or no formal process at all. If your manager asks you to be 10 percent more productive and you do not have the knowledge or tools to improve how you work, the only alternative is to work faster and harder. Rushing work may produce more defects. If your manager then tells you to reduce defects by 10 percent and you lack the capability to create a quality process, you will be more careful, perhaps slowing down or adding in more layers of checking, making it harder to achieve the productivity target.
Karyn has attended morning huddles in many organizations where the leader is frustrated. Although the metrics seem to be improving for the type of task the manager has asked the team to focus on, the metrics for other processes are slipping. Since the members of the team are only focused on the ends of meeting the goal for each metric, they simply work harder, longer, or faster without changing the process, the means by which the work is completed.
Everyone I know who has worked with a Japanese sensei has felt frustration at one time or another when the sensei asks the seemingly very simple question, “Why?” I hear things like “We set up a beautiful pull system with color coding, and it became very clear what to work on next, and our sensei asked, ‘What is the purpose?’ This is basic lean. Doesn’t the sensei know why?”
What the sensei is concerned about is a confusion of means and ends. Pull systems are a means, but setting up pull systems can quickly become an end unto itself: “We must deploy pull throughout the enterprise.” Soon the lean group is mindlessly deploying things that it can call pull systems and see this as the solution to all ills: “Our organization doesn’t respond to actual customer needs. We just push our services on to the next process whether they are ready or not and overwhelm them with paperwork. If we could simply get everybody to respond to real customer needs, we could solve half our customer complaints and improve our productivity.”
It may be true that there is too much push in the organization, and there are many opportunities to improve through well-thought-out pull systems. But does the organization really know if that is going to get it to where it wants to be? Embedded in this frustrated rant are the assumptions that:
![]() Pull everywhere will lead to reduced customer complaints by 50 percent.
Pull everywhere will lead to reduced customer complaints by 50 percent.
![]() Pull everywhere will lead to improved productivity.
Pull everywhere will lead to improved productivity.
![]() Reduced customer complaints and increased productivity are the main goals everywhere.
Reduced customer complaints and increased productivity are the main goals everywhere.
![]() Pull is the best generic solution to generic problems everywhere.
Pull is the best generic solution to generic problems everywhere.
Continuous improvement does not mean applying generic solutions to generic problems. It means finding specific ways to move each part of the system in the direction of clearly established goals. We rarely know exactly how the new tool will work until we try. Therefore, we must experiment and learn.

KEY POINTS
MACROPROCESS PRINCIPLES
1. Process principles are not solutions. They help us think about what we want to accomplish and why; however, they do not solve problems.
2. In service processes, a generalized approach to value-stream mapping may be useful to help see the current state of the process from the customer’s perspective and then develop the big-picture “macrovision” of where we want to go next. However:
![]() Value-stream mapping is not a solution to a problem, but a tool to help us see.
Value-stream mapping is not a solution to a problem, but a tool to help us see.
![]() Many service processes are highly variable, and it may not be useful or necessary to develop the level of detail such as takt time or the inventory between steps that is seen in many current-state manufacturing maps.
Many service processes are highly variable, and it may not be useful or necessary to develop the level of detail such as takt time or the inventory between steps that is seen in many current-state manufacturing maps.
![]() The real power of value-stream mapping is in developing targets to be achieved step by step through PDCA.
The real power of value-stream mapping is in developing targets to be achieved step by step through PDCA.
3. Lean principles can inform the target conditions we should be striving for and help us to identify possible countermeasures.
4. Determine what value means from the point of view of your customers:
![]() All improvement efforts start with deeply understanding the needs of your organization’s specific customers and what value they need you to add for them.
All improvement efforts start with deeply understanding the needs of your organization’s specific customers and what value they need you to add for them.
![]() Customers don’t always know what they need, so go to your customer’s gemba and see what they actually do and what they need.
Customers don’t always know what they need, so go to your customer’s gemba and see what they actually do and what they need.
5. Strive for one-piece flow without stagnation by identifying and eliminating obstacles that are preventing work from flowing from one value-adding step to another:
![]() Customers are only paying for value-added work, which we have defined as any concrete thought or action that advances the work toward satisfying the customer’s need.
Customers are only paying for value-added work, which we have defined as any concrete thought or action that advances the work toward satisfying the customer’s need.
![]() Each service organization and its customers are unique, so be creative in finding the ways that value can flow to customers. Lean concepts such as cells and takt might be applicable; however, they might not.
Each service organization and its customers are unique, so be creative in finding the ways that value can flow to customers. Lean concepts such as cells and takt might be applicable; however, they might not.
![]() Look for places that work is stagnating and then find ways to eliminate that stagnation.
Look for places that work is stagnating and then find ways to eliminate that stagnation.
6. Level work patterns to achieve steady, stable processes with low variability.
![]() Unevenness, or starting and stopping, leads to waste as we restart and also means that we will have a light workload sometimes and are over-burdened at other times.
Unevenness, or starting and stopping, leads to waste as we restart and also means that we will have a light workload sometimes and are over-burdened at other times.
![]() Service providers often believe that it is impossible to level the workload; however, leveling can be accomplished by finding creative ways to reduce variability in customer orders or finding ways to adjust staffing.
Service providers often believe that it is impossible to level the workload; however, leveling can be accomplished by finding creative ways to reduce variability in customer orders or finding ways to adjust staffing.
7. Respond to customer pull by creating supermarkets and using visual management where that makes sense.
8. Use PDCA to learn how to apply the process principles creatively and in ways that make sense to satisfy your customers and meet your business goals.
9. Remember, there are no generic solutions to generic problems. Process principles are not solutions, but ways to guide our thinking about responding to the specific challenges we find in our service organization.