
Chapter 6
![]()
Microprocess Principles: Make Work Patterns Visible for Continuous Improvement
Make your workplace into a showcase that can be understood by everyone at a glance. In terms of quality, it means to make the defects immediately apparent. In terms of quantity, it means that progress or delay, measured against the plan, is made immediately apparent. When this is done, problems can be discovered immediately, and everyone can initiate improvement plans.
—Taiichi Ohno, founder of the Toyota Production System
MICROPROCESS PRINCIPLES
Macroprocesses set the framework for microprocesses. Think of organizations as complex puzzles with thousands of pieces. We generally start a puzzle with the outer edges that frame the puzzle. Then we select big and distinctive objects like faces of people and build those. Finally, we get to the hard work of all the detailed pieces that are difficult to distinguish at first glance, like the sky. Microprocesses are like the detailed pieces in the center of the puzzle (see Figure 6.1). The macroframing is easier, but the tedious detail is what brings the puzzle to life, and this requires the hardest work and discipline.

Figure 6.1 Macroprocesses frame detailed microprocesses.
In lean the macrolevel frame is the overall flow of material, people, and information through value streams—what we would draw as a value-stream map. Usually macroprocesses are the result of decisions about architecture and structure. How will we organize our supply chain? How do we lay out equipment and offices? How do we schedule the overall flow of work in the organization? For the microlevel we zoom into a process box. Macroprocesses establish the framework for daily work. The daily work follows a rhythm of activity, and this is where service excellence happens . . . or doesn’t.
What should be found at the daily level are highly developed people who are passionate about serving customers, continuously improving how they do the work based on what they learn every day. To get to this we must thoroughly integrate process, people, and problem solving. The image we have of how the process should function (standard) provides the framework for excellence and highlights the next obstacle to overcome to get closer to an ideal process.
In this chapter we will talk about standardization, visualizing deviations from the standard, building in quality at each step, and using technology to enable people to perform and improve their work (see Figure 6.2).
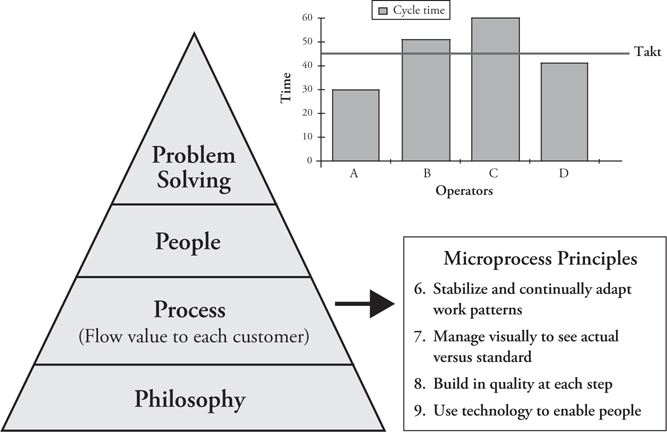
Figure 6.2 Microprocess principles
The idea of voluminous standards and procedures might bring to mind a highly regimented bureaucratic process—the opposite of an empowered workforce creatively solving problems. Yet we will argue that bureaucracy has been misunderstood and misapplied, and if used properly, standard processes are the foundation for continuous improvement. This is difficult to accept, precisely because standards are so often used improperly.
PRINCIPLE 6: STABILIZE AND CONTINUALLY ADAPT WORK PATTERNS
We described leveling as one of the most misunderstood lean concepts in service organizations. Standards are the most abused lean concept by people who think they understand it. It seems remarkably easy to create rules and procedures, more difficult to enforce them, and really hard to embed them in a learning culture.
On the one hand, standards create order, and most of us would agree that without them we would have anarchy. How many people would enjoy a world with no traffic rules or property ownership rules or safety rules? In fact, rules are the foundation of civilization.
On the other hand, think of “bureaucracy,” and what immediately comes to mind is red tape, waiting in long lines, filling out complex forms—in lean terms, “waste.” We have been critical of mechanistic organizations because they fail to adapt to the rapidly changing world we live in. But we do not think the cause of this stagnation is rules. Rather, the way rules are used is a symptom of the deeper way of thinking of mechanistic organizations.
Coercive Versus Enabling Bureaucracy
My colleague Paul Adler made a breakthrough in organizational theory when he suggested bureaucracy is not necessarily limiting. He was not enraptured by Toyota, but as a Stanford professor he worked and lived near the Toyota-GM joint venture—NUMMI. He was intrigued with all that was written about it, and he made a visit, which led to an intensive study. He expected to see continuous improvement in action driven by empowered teams in a highly organic organization. What he actually saw surprised him. There seemed to be endless rules, or in Toyota’s vernacular, “standards.” They were visible everywhere you looked—signs, lights, standard work posted at the workplace, metric boards, signs indicating jobs that were critical to quality, visible safety procedures. Yet a deeper look confirmed what he had read about continuous improvement. Work groups, down to the individual worker, were empowered to alert management to deviations from the standard and to suggest improvements. Procedures normally owned by engineering were the responsibility of the work group. He concluded:1
What the NUMMI experiment shows is that hierarchy and standardization, with all their known advantages for efficiency, need not build on the logic of coercion. They can build instead on the logic of learning, a logic that motivates workers and taps their potential contribution to continuous improvement.
Adler made a key distinction between coercive bureaucracy and enabling bureaucracy. Coercive bureaucracy is what we are used to seeing and is associated with all the negative stereotypes about the inefficiency of governments. In an enabling bureaucracy, rules, procedures, and standards support work groups in doing safe, efficient, high-quality work. Once standards are set, they are to be followed as they are the best we know today. But as Henry Ford extolled in his 1926 classic Today and Tomorrow:
Today’s standardization . . . is the necessary foundation on which tomorrow’s improvement will be based. If you think of “standardization” as the best you know today, but which is to be improved tomorrow—you get somewhere. But if you think of standards as confining, then progress stops.
As we will see, enabling bureaucracy is empowering and a key to service excellence. But first, lets look in on an example of coercive bureaucracy at its worst.
Coercive Bureaucracy in Action at the U.S. Post Office
If we want to see coercive bureaucracy in action, there are fabulously horrifying examples at the U.S. Postal Service. A close friend, Fred (pseudonym), has worked for the post office as a postal carrier since 1997. He loves being outdoors and enjoys parking his mail truck in a neighborhood and walking around. He passed up opportunities to be promoted to management to continue the outdoor work he loves. Fred was never very political and did not have strong opinions one way or the other about the postal union for city mail carriers—the National Association of Letter Carriers. However, after repeated frustration with management, he got involved with the union and was elected to be a representative and eventually became vice president of the local. One of his pet peeves is the way the USPS handled standard work.
The post office first botched the introduction of standard work in the 1970s in what became known as the Kokomo Plan, named after the town in Indiana where it was tested. In order to try to develop a fast and simple way to develop standard work for jobs with standard timings, in 1974 the USPS timed routine tasks done by carriers such as reaching to pick up a package and placing it in a mailbox. Based on these times, the postal service constructed jobs under the assumption that the sum of the individual tasks would accurately reflect the time for the job. Known as predetermined time standards, the USPS could use these times to construct daily routes and assess the performance of carriers against the standard times.
It quickly became apparent to the union that these times were anything but accurate reflections of reality, and the union successfully fought the system. The union saw that there was far too much variation in actual routes to predict the time it should take using standard times. For example, letter mail to households is first put in sequence by machines, and the numbering of houses is straightforward with few errors. On a business route you have the street address and then many different suites, and the mail gets jumbled in the delivery sequence as the carrier walks from suite to suite finding the right mail. If you study the actual situation it will be clear that additional time is needed for these business deliveries, but this was not reflected in the standard times. There are thousands of variations on issues like these that make standard times guesses at best. In 1976 the post office proposed to take the standards nationwide, and this almost resulted in a nationwide strike. The experiment was scrapped.
Fred’s personal experience with standard work was in a later wave in 2004 when a supervisor decided to change the delivery sequence of his route. There is an official route adjustment process in which a management representative walks with a carrier throughout the day and records data on a standard chart from point to point. Fred’s direct supervisor walked with Fred, and also observed him covertly, and decided he could make Fred’s route “more efficient.” Changes were made with no input from Fred, and on the first day of walking the new route, it was clear to Fred that what his supervisor was proposing would take an extra 15 to 20 minutes.
Let’s consider one part of the supervisor’s idea for improvement, probably the worst part. Before the redesign, Fred’s specified sequence for one part of the route was to park, then walk sequentially on one side of the street delivering to each house—for example, the even numbers 2, 4, 6—and then continue walking in a circle to get to the odd-number houses 1, 3, 5 and then back to his truck. In this particular area, one house was separated by about 250 feet from the other houses. So Fred would complete the circle and then get in his truck and drive to that house to deliver the mail (see Figure 6.3). His supervisor changed the walking sequence so Fred was zigzagging back and forth doing houses in exact order 1, 2, 3, etc. Fred could only guess that his purpose was to eliminate the one dismount delivery (getting back in the truck) to the isolated house. If you look at the diagram of movement patterns, it is immediately obvious that the original pattern is more efficient than the new pattern, which involved wasteful zigzagging back and forth and then walking all the way to the isolated house and returning past houses that were already served. From a lean management perspective his supervisor had taken a pretty efficient process and inserted a lot of wasted travel into it.
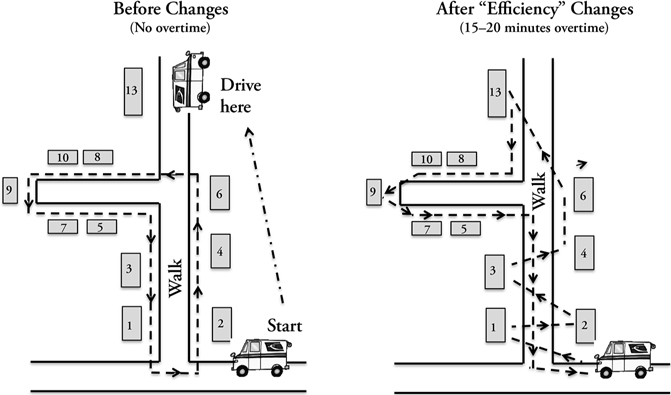
Figure 6.3 Example of before and after supervisor-imposed mail delivery pattern in a coercive bureaucracy
As Fred expected, the supervisor’s inefficient changes added 15 to 20 minutes a day, which turned into overtime pay for one year. Fred appreciated the extra money but did not think this benefited the post office in any way or the customers, who might end up paying more for postage to cover the extra costs of poor decisions. Fred decided to do the right thing and protest to the boss, explaining it added extra time, but the supervisor stuck to his guns. He seemed more determined to be right than to develop an efficient route. It was incidents like this that motivated Fred to become active in the union to stop ill-advised management behavior harmful to the workers, customers, and the USPS.
After one year of the overtime, the region got a new postmaster, and he decided to spend a day walking with Fred—highly unusual in the coercive bureaucracy of the U.S. post office. As they were approaching the changes with the zigzag route, Fred said to the postmaster, “At first I was concerned about spending the day with you, and then I realized this is a great opportunity to show you what one of your supervisors did.” Fred soon started the zigzags, and the postmaster asked, “Why are you doing that?” Fred said, “You have to ask your supervisor. He is the one who made this change.” The supervisor was not around much longer after that.
We should note that bureaucracies aren’t always potent enough to be coercive. I remember working as a cooperative education student in the quality department of a company that built nuclear power plants. What we did was to write procedures—thousands of procedures and addenda. Presumably this would guide the design and building of the power plants, but our real customer was the Nuclear Regulatory Commission. We wanted to pass the commission’s audits. I suspect the people there were the only ones who actually read these thousands of arcane procedures with headings and subheadings and citations. I never saw the site of a nuclear power plant, never went to the gemba, but I wrote great procedures. It is probably more accurate to call this “paper bureaucracy” rather than “coercive bureaucracy.” I doubt many people were coerced by these procedure manuals. What was more concerning is that they were largely invisible to the people doing the work.
Standards in Enabling Bureaucracy
We constantly preach to organizations the power of using standards in an enabling way, and we often get pushback from management: “You mean standards become suggestions, and people without professional training can change them however they want?” One of the underlying causes of this concern is a misunderstanding of what we mean by a standard.
In The Toyota Way Fieldbook we separated different types of standards into a house structure, shown in Figure 6.4. As you can see, there are standards defined outside the organization adopting the standards. These include safety and environmental standards defined by the government. The standards are not to be tampered with, as they are the law. They are turned into standard specifications by internal specialists such as the corporate safety office and the corporate engineering departments. Again, specifications are not to be tampered with unless there is approval of the changes. What brings these standards to life is standard work, which very much should be tampered with to improve it.
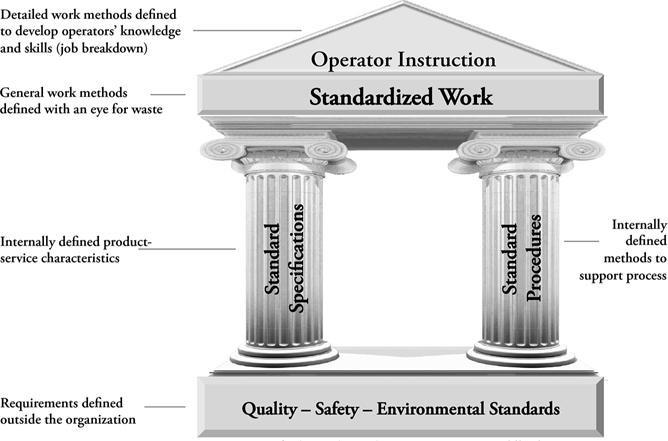
Figure 6.4 Relationship and purpose of standards
Source: Jeff Liker and David Meier, Toyota Way Fieldbook.
Organizational learning not only can coexist with standards but actually depends upon standard methods. If there are no standards, then people have the freedom to do the job however they see fit. If they come up with what they think is a better way, they can use that method as an individual, while others can disregard the “improvement.” Learning means we try something and study it, and if it is a better method, whoever does that job will follow the preferred method until a better one is identified. In an anarchy in which we all are “empowered” to do our own work, individuals may learn, but this will rarely translate to organizational learning.
Robert Cole wrote an excellent essay arguing that the Japanese advantage through the 1980s was because of their capacity for organizational learning, whereas in the West we were better at individual learning.2 He describes organizational learning as the process of turning individual learning into organizational routines, that is, standards that sit above any particular individual:
The process by which we transmit and evolve organizational routines is organizational learning. We, of course, can learn good and bad things. We want, however, to define organizational learning in terms of identifying and creating best-practice work routines, standardizing these practices, diffusing them (i.e., actualizing them) throughout the organization, and then renewing the process.
In order to gain a better understanding of coercive versus enabling standards, let’s check back in on NL Services, Inc. When we left the company, it was at a crossroads: continue to work organically with Leslie, focusing on satisfying the customer and teaching people how to identify problems and strive for constant improvement, or hire a big-box consulting firm to speed up the lean transformation and please shareholders who favor a quick return on investment. And as stated in Chapter 4, the cases below are a composite of experiences that Karyn has seen repeated across many different service organizations. In one form or another these things have actually happened, though the names have been changed to protect the well-intentioned but misinformed.
NL Services: Coercive Bureaucracy—Standards Are Something to Be “Adhered” To . . .
Unfortunately for NL Services, Sam McQuinn, the VP who championed the lean pilot project, decided to leave to take a job as a senior executive at the company where his former colleague Sarah Stevens worked. It was a smaller company, but he felt alive there. At NL Services, responsibility for companywide lean deployment was passed on to Mike Gallagher, who had taken on the role of executive vice president of Corporate Lean Strategy. Mike was brilliant and felt passionate about NL Services, but he knew nothing about lean beyond a few books he had perused. He had visited some of the people Sam worked with in the pilot and was impressed by their enthusiasm and accomplishments, but if he continued to spread lean using the deep pilot approach, he would retire before lean got serious traction across the company. He needed help from real experts.
After a competitive bidding process, NL Services decided to go with Lean Mechanics, Inc., a big-box consultancy specializing in implementing lean management systems for service organizations. Lean Mechanics seemed to have an impressive track record of quick, cost-effective deployments and promised that it would have its lean management system up and running across NL Services within six months.
After an initial investigative period in which a huge contingent of Lean Mechanics’s certified lean experts swarmed the NL Services offices with stopwatches, the diagnosis was made that, like many other service organizations, NL Services’ biggest problem was that it didn’t have functioning standard work. Every credit transaction processor did the work differently, which, according to Ray Kensington, the Lean Mechanics Certified Master Lean Expert assigned to lead the work with NL Services, resulted in huge productivity losses. Ray promised Mike that implementing standard work for all the credit transaction processes would deliver at least a 20 percent productivity gain across the organization. When all the credit processors were doing the work the same, efficient way, it would be easy to share work across different parts of the organization, and the need for specialized regional training would drop dramatically. With the added efficiency, Lean Mechanics promised to deliver savings by eliminating jobs.
Creating the standard work would be a simple and painless process. Ray Kensington and his team of lean experts would time the credit transaction processors in one office to estimate the amount of wasted time that could be eliminated using the standard work. They would then determine what the most efficient process would be. Once the steps were compiled and timing complete, the actual standard work would be created by the junior consultants, and the credit processors would be trained across the entire country and audited to comply with the new methods (Figure 6.5). Ray explained to Mike that there was no need to worry that credit transaction processors would resist following rigid procedures that would reduce their creativity, as the standard work was really just a high-level view of steps and handoffs between roles, nothing too detailed or specific.
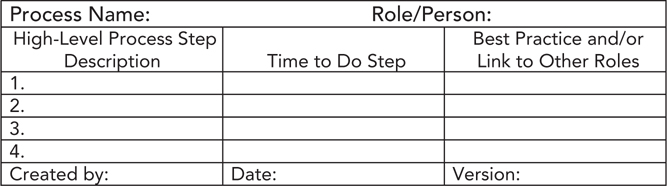
Figure 6.5 Standard work template used by Lean Mechanics
In order to ensure that all credit processors adopted and adhered to the standard work, one credit processor per team would be designated as the team’s standard work leader (SWL). As well as doing weekly audits to ensure that their team’s members weren’t deviating from the standard, the SWLs would meet on a biweekly basis to discuss any changes in the standard work that had been identified by any of the teams. If all the SWLs agreed with the change, then the office would implement the change in the standard work, and the SWLs would add extra audits to make sure the new changes were “adhered” to.
Lean Mechanics also suggested that a best practice deployment process be created across NL Services so that changes in standard work made in one area of the company could be easily shared and leveraged in other areas. Having the best-practice deployment process would also increase productivity by preventing regions from wasting time working on changes in standard work that had already been completed in other areas of the company. The best-practice deployment process would make for easy and swift adoption of those changes and ensure that productivity continued to rise.
Ray assured Mike that the best-practice deployment process would also be easy to implement: each office would designate two of their team SWLs as Level 2 SWLs, and they would attend monthly regional meetings. Each quarter, one of the Level 2 SWLs would prepare for and attend the national Level 3 SWL meeting. Changes approved at that meeting would be quickly spread to similar jobs across the country.
Mike Gallagher was a little concerned that between completing standard work audits and attending meetings, the SWLs would be taken away from processing credit transactions and serving their customers for quite a bit of time in the month; however, Ray reminded Mike that the positive gains in productivity from having credit transaction processors all doing work in the same efficient, standard way would outweigh any of the negative effects for the SWLs’ team-mates or customers. In fact, with the productivity gains from the standard work, it should be possible to reduce the workforce, the main basis for the promised cost reductions.
If Mike had any remaining reservations about how the use of standard work would be enforced across the organization, Ray explained the semiannual Lean Audit Review process: twice a year, a team made up of experts from Lean Mechanics and NL Services’ audit department would visit each office to complete a Lean Audit Review, or LAR (see Figure 6.6). The LAR team would score the office on the adoption of various lean tools, including standard work; if credit transaction processors were not found to be “adhering” to their standard work, they and the SWL for their team would receive a written warning, and the LAR result would be noted in their annual performance appraisals. With all these levels of checking, there would be no possibility that credit transaction processors would be able to—or want to—deviate from their standard work.
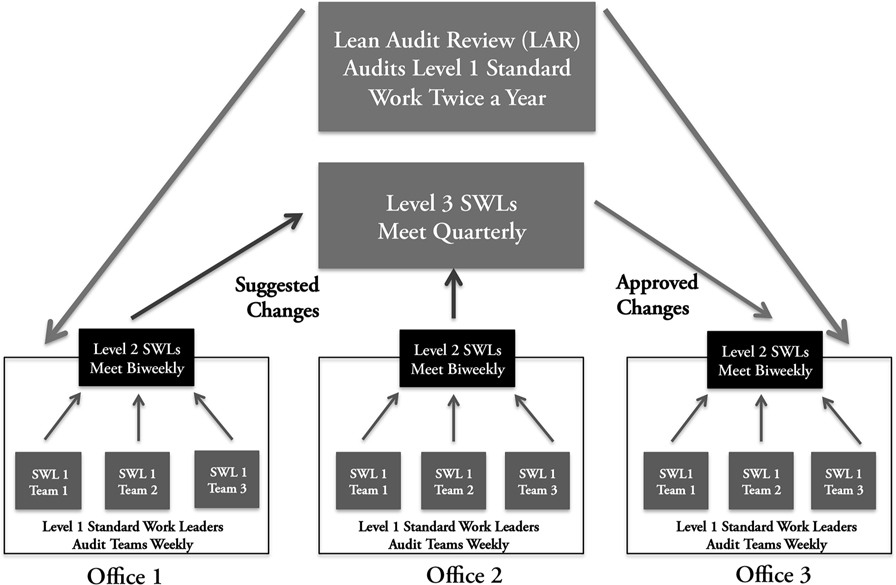
Figure 6.6 NL Services standard work audit process—it’s as complicated as it looks!
Six months later, as promised, Lean Mechanics had created standard work for all the main tasks in the credit transaction process and set up the best-practice deployment process. By the end of the year, each region had had two Lean Audit Reviews. As Mike Gallagher reviewed the PowerPoint decks of the LAR results, the spreadsheets listed the changes that had been made to the standard work (mostly only changing words here or there) and the productivity numbers; yet something just didn’t add up. And what didn’t add up was the productivity savings that Ray Kensington and Lean Mechanics had predicted. Even after he ran the numbers for the third time, Mike had to admit that no matter how he calculated it, the 20 percent productivity gain that had been promised just wasn’t there: when he looked at the cold, hard numbers, it was obvious that most offices had no productivity gains, and some even had losses. Even worse, when he talked to the regional managers, the CTPMs, and even the credit transaction processors themselves (when he had time to stop looking at the LAR report-out decks and get out from behind his computer screen), he heard a variety of disconcerting concerns about the standard work and best practice deployment process:
![]() Credit transaction processors were still doing their work however they wanted to; but not wanting to receive warnings or write-ups, they followed the standard work if they were being watched by the standard work leader for their team or during one of the LARs.
Credit transaction processors were still doing their work however they wanted to; but not wanting to receive warnings or write-ups, they followed the standard work if they were being watched by the standard work leader for their team or during one of the LARs.
![]() Very few improvements to standard work had been made at all. Standard work leaders complained that since most changes brought to them were simply the personal preference of the person who suggested it, it was impossible to get others to agree. And it took so long to move possible changes through the best practice deployment process, that most people were reluctant to even bring up a suggestion.
Very few improvements to standard work had been made at all. Standard work leaders complained that since most changes brought to them were simply the personal preference of the person who suggested it, it was impossible to get others to agree. And it took so long to move possible changes through the best practice deployment process, that most people were reluctant to even bring up a suggestion.
![]() Customers were complaining that it was harder than ever to get in touch with the credit transaction processor dedicated to their account if that person was a standard work leader. The number of team audits and amount of time for standard work leader meetings kept the SWLs away from their desks and customers for hours at a time.
Customers were complaining that it was harder than ever to get in touch with the credit transaction processor dedicated to their account if that person was a standard work leader. The number of team audits and amount of time for standard work leader meetings kept the SWLs away from their desks and customers for hours at a time.
![]() Since NL Services let go of 20 percent of its credit transaction processors in anticipation of the productivity savings that Lean Mechanics had promised, the numbers showed that accuracy and delivery times were down all over the country. And so were the results of this year’s Employee Engagement Survey, as the remaining credit transaction processors struggled under the burden of managing the same amount of work using the same processes with 20 percent less help . . .
Since NL Services let go of 20 percent of its credit transaction processors in anticipation of the productivity savings that Lean Mechanics had promised, the numbers showed that accuracy and delivery times were down all over the country. And so were the results of this year’s Employee Engagement Survey, as the remaining credit transaction processors struggled under the burden of managing the same amount of work using the same processes with 20 percent less help . . .
Mike Gallagher thought to himself, “It all looked so good on paper. When they presented their bid, the Lean Mechanics people seemed to know exactly what they were doing. If only I could ask them what went wrong.” But Lean Mechanics’s contract had run out at the end of the year, and once the company stopped getting paid, its lean experts had disappeared, moving on to the next deployment, at one of NL Services’ competitors.
Take a minute to reflect on the rich, organic experience of the NL Services team that we described in Chapter 4, people like Kathy and Joe. Imagine what they experienced when Lean Mechanics came charging through, developing and imposing superficial standard work. “What a joke. Do they have any idea what they are doing? And why are SWLs responsible for changes when they have never experienced real standard work?”
Service 4U: Enabling Bureaucracy—Standards Support How We Learn to Improve . . .
Meanwhile, at Sarah Stevens’s company, Service 4U, where Sam McQuinn had been working as the executive VP of Service Excellence for the past three months, the staff was learning about standards too. One of the things that Sam was enjoying most about working at Service 4U was the focus on finding unique ways to satisfy the company’s customers. Just before Sam had arrived, Service 4U added a new service offering to provide electronic direct deposit transfers. Service 4U sales representatives actively partnered with their clients to find out what types of new services would help them run their businesses more easily. Once sales reps had brought the feedback that direct deposit transfers would be a service differentiator, new-product development had created the product, and IT had created a system enhancement.
Service 4U’s credit processors had all received training on the new direct deposit capabilities of the transaction system and had been processing direct deposit transaction transfers for about four months. Everyone was expecting rave reviews from customers about the new service offering, but then came a cold dose of reality. Even after two levels of checking, between 30 and 50 percent of the direct deposits were failing the regulatory audit for various reasons, such as incorrect paperwork, missing bank documentation, and no customer signatures. The customer would then have to send in new information, and the direct deposit would have to be set up again after a waiting period. Also, on occasion, bank routing or account numbers had been entered incorrectly, and thus funds were direct-deposited into incorrect accounts. That didn’t make customers very happy. Nor did the fact that customers had to send in all their direct deposit paperwork two days before their transaction processing date. What customers really wanted was to send in the paperwork at the time their transactions would be processed and have their direct deposit activated immediately. And that’s where Sam came in. As VP of Service Excellence, it was his responsibility to make sure that Service 4U’s underlying processes supported the delivery of service excellence.
One thing that Sam particularly enjoyed about his new position was the opportunity to regularly work with Leslie Harris, the lean management advisor who had helped him at NL Services. Unlike NL Services, which was focused on short-term results and quarterly dividends for its shareholders, Service 4U was dedicated to providing the best service possible for its customers over the long term. Sam knew that Leslie would be able to help him help Service 4U get to the bottom of the direct deposit problem.
After Sam explained the problem to Leslie and showed her the data the company had collected from the daily and monthly direct deposit audit process, Leslie suggested, as she always did, that they go together to the gemba to find out the facts behind the data and see what they could learn from the people who actually entered the direct deposits into the transaction processing system. As Sam and Leslie made their way through the six transaction processing teams, they heard the same thing from supervisors and transaction processors alike: no two processors had the same method for entering a direct deposit into the system. Some processors entered the routing and account numbers first and then checked the paperwork for accuracy, while others did it the other way around. And the transaction processors all had their own ways of explaining what was needed and of getting paperwork from customers.
After visiting all the teams, Leslie and Sam stopped to discuss the situation with Susan Jensen, the office’s transaction processing manager. Susan explained that as soon as customers had started complaining, as Leslie had taught them and as was now their habit, the supervisors had gone to sit with the processors to see what they could learn. What they found out was exactly what Sam and Leslie were hearing on their gemba visit. No two processors did the work the same way, and there were various opportunities for errors. Susan said, “The problem seems to be that the methods used by various processors allow for errors that inconvenience customers. We are not providing anything like service excellence. We need to understand how the errors occur and work with the processors to develop a better method, then standardize it as a baseline for improvements.”
Over the next few days, Leslie helped Susan and the supervisors put together time studies, just like the ones that Sam remembered from NL Services. After the supervisors had collected the data, they could see that a couple of the processors had excellent accuracy (their direct deposits rarely were on the daily Audit Fail list), and they also used the fewest steps and had the lowest repeatable times for the process. When the supervisors and Leslie and Sam looked at the steps that these processors followed, they could see that the first thing the processors did was check the documentation the customer sent for accuracy. Once they determined it was accurate, the processors scanned it into the WebDocs system so that it was available for the auditors immediately. Only after those steps were completed did the processor enter the routing and account numbers into the transaction processing system. The supervisors all agreed that following this process seemed to be the best way they knew to ensure accuracy and efficiency.
Working with the two processors and their supervisors, Leslie helped the team create a standard work document with a simple explanation and pictorial representations of the “Check-Scan-Enter” process, as they called it. At each step, the processors could easily see if what they had on their screen matched the picture on the document. It would certainly be easy for the processors and their supervisors to tell “good” from “not good.” After they put together the first version of the standard work document, the two transaction processors brought it back to their teams and taught their teammates how to use it and the Check-Scan-Enter process. The processors each got a copy of the document to hang up at their desk, just beside their computer screen.
At first, team members were a little skeptical, but with support from both the transaction processor who had created the process and their supervisors, it soon became a new routine to follow the Check-Scan-Enter document. At the beginning of every day, the team’s supervisor checked the Audit Fail list and if there was a failure went to understand what had happened. After a few changes to parts of the Check-Scan-Enter process and document, audit failures were virtually eliminated for the teams using the new process, and direct deposits were entered in less than half the time. The transaction processors on the two pilot teams were very excited . . . as were the processors on the four other teams. They were so excited that they begged the processors on the pilot teams to teach them how to use the Check-Scan-Enter process and standard work. Everyone wanted to be able to process work in a way that gave customers the quality results they expected.
Two months later, during their regular coaching time, Sam and Leslie reviewed the direct deposit Audit Fail results. They could see that there were rarely failures anymore. And as they worked their way through the teams in the gemba, supervisors and processors alike were excited to tell them about how happy customers were about the ease of direct deposit processing. Susan Jensen stopped them in the hall and told them that, working together, the transaction processors and supervisors had begun to create standard work for other processes as well. And as she reminded them, it was only the best way they knew how to do the work today, so they were still looking for better ways!
Standard Recipes at Zingerman’s Mail Order
Standards and standard work are especially important at ZMO. Since the organization expands from 70 to 400 people in the busy holiday season in December, the staff knows it will be swamped with rookies for a matter of weeks. Before there was an established system, it was chaos. Now there is a clear system to follow at every level of detail. Standard work is the only way to ensure that people are properly trained and there is some consistency in quality and timing.
The Zingerman’s community of food businesses does not have a problem with the concept of standard work. The employees refer to them as recipes. There is a recipe for everything at ZMO from how to pick orders from the shelf to how to place items in boxes to how to answer the phone. The standards for simple, repetitive manual tasks like picking are more detailed than for more customized tasks like answering the phone.
In Figure 6.7, we show page 1 of a two-page standard work sheet for ZMO, in this case for the initial job of picking items and putting them in a bin. For the detailed, highly repetitive tasks of a Toyota assembly line, there is a standard work sheet that includes times in seconds for each step and a separate job instruction sheet for training purposes that includes more detailed substeps along with key points and reasons.3 ZMO’s jobs have enough variability in them that the company uses higher-level steps and key points on one or two sheets, without specific times. Notice these are simple declarative statements like the first: “Read location of item to be picked from Work Order.” The key point gives details on how to perform this step, in this case where to find what information: “Locations are listed as… Rack – Shelf, Slot. Example: E3-B1.” The key point in step 5 illustrates how to check off items as you pick with a visual example.
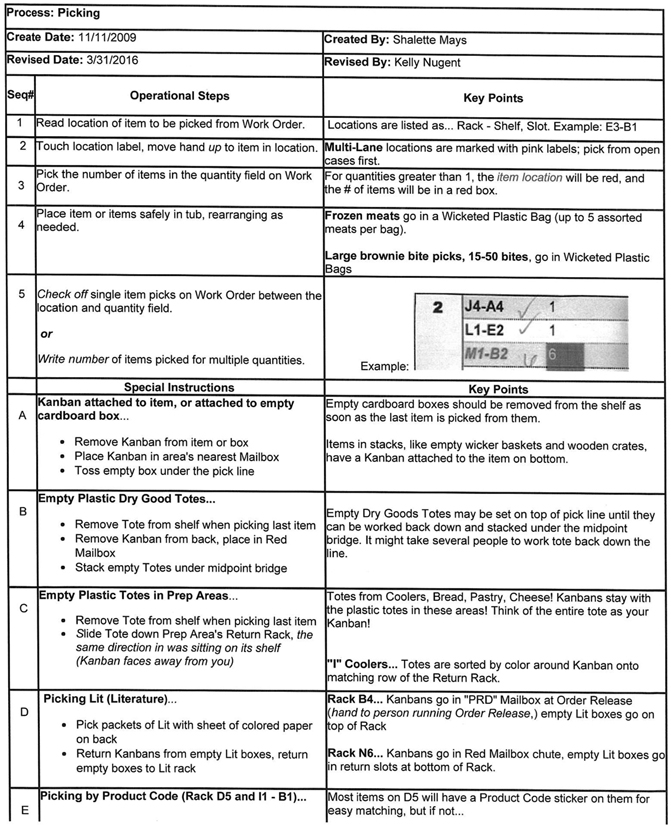
Figure 6.7 Standard work sheet for picking orders at Zingerman’s Mail Order
It might appear rather obvious how to pick items off a shelf and put them in a bin. As you read down through the standard work it is surprising how much is involved in this apparently simple job. This is in part because of the lean systems. There are clear standards for where every item is located with distinct addresses and visual management identification. Consider the “Special Instructions” for non-recurring tasks. There is a kanban system for replenishing items and that needs to be understood. There is a standard for what to do with empty totes and one for dealing with empty dry good totes. In many warehouses all we would know is to look up the item on the pick list and find it, perhaps using some bar code technology. As ZMO developed visual standards, errors in picking were dramatically reduced, and at the same time there was more to teach in the “recipes.” As you transform to lean there will be more detailed standard work and a greater need to do a good job of team member training. Some people say that lean does not work with temporary workers, but in fact, it becomes even more critical.
Standard Sales Processes in a Retail Chain
Inversiones La Paz owns two of the largest retail chains in Honduras: motorcycle sales and repair and Jetstereo consumer electronics stores. The executive board asked for help to bring lean to all its processes from warehousing, to motorcycle assembly, to motorcycle and consumer electronics repair, and even to back offices such as bill collection. One of the most critical steps in the value chain is sales, and the executives on the board were confused about how lean could apply to a process of individuals selling to a varied set of customers.
The executives had found a consulting company that coached salespeople in how to sell, including role playing, and store managers were quite rigorous about ensuring all salespeople were trained. But on a typical day salespeople were roaming around the store on the hunt for customers to help. Since salespeople are paid on commission, they can be a bit territorial about wanting their fair share of customers and then staying with those customers to the point of sale. They also tended to cherry-pick customers they perceived were more likely to buy something, leaving other customers just standing around waiting
One of my associates, Florencio Munoz, began working with the vice president of sales, and of course, he began by going with him to the gemba to grasp the current condition. As usual, it was eye-opening for the sales VP even though he had worked in the company for over a decade. The current condition was:
![]() A high number of walk-ins (customers) were not being engaged by salespeople, which led to unsatisfied customers and lost sales.
A high number of walk-ins (customers) were not being engaged by salespeople, which led to unsatisfied customers and lost sales.
![]() Unbalanced workloads (average number of customers engaged per salesperson per hour) led to varying sales results among employees that were not directly attributed to skill level or effort.
Unbalanced workloads (average number of customers engaged per salesperson per hour) led to varying sales results among employees that were not directly attributed to skill level or effort.
![]() Not all the salespeople that came to work that day were available during peak hours.
Not all the salespeople that came to work that day were available during peak hours.
![]() The store manager was not able to quickly identify what activities team members were performing at any point in time.
The store manager was not able to quickly identify what activities team members were performing at any point in time.
With the help of Florencio, the sales VP and his team concluded that the root cause was the fact that there was no system to plan or visualize which salespeople were available, what tasks they were performing, and whether all customers were being engaged by the staff. This may immediately bring to mind the need for some sort of surveillance with cameras and computers, but Florencio guided the improvement team in developing a manual visual system.
First, they had to visualize what they wanted to be happening (target condition) and then plan how it would work, including visual boards to display what was happening and the standard at a point in time. What they came up with was a visual display of the activities hour by hour of a salesperson at any given time (Figure 6.8). At a glance this showed which sales manager was in the store versus out, what training activities were scheduled (since the staff did a lot of training), and who was assigned to which “station” in the store.
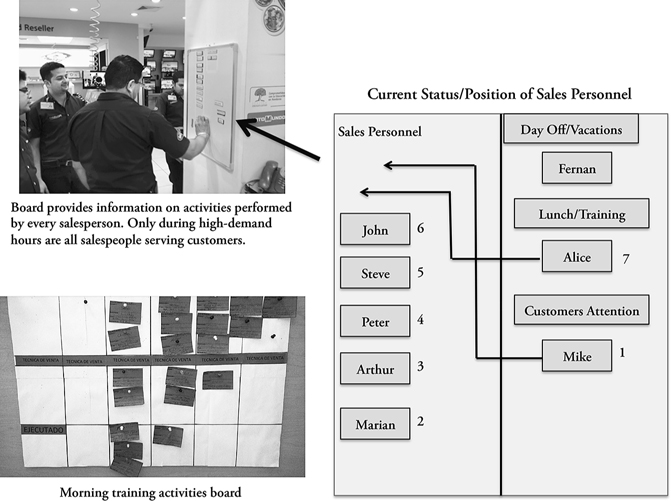
Figure 6.8 Visual management of salespeople’s activities
Each station was a different position in the store with its own clearly defined tasks. A system of rotation was established for those who were on the floor (Figure 6.9). The managers wanted to make it clear who was working on what task and to identify the team member who was next up “at bat” to engage the next customer entering the store. The board also needed to communicate a state of emergency when the number of customers in the store exceeded the number of sales-people so that countermeasures could be taken to avoid customers’ leaving the store without having been engaged.
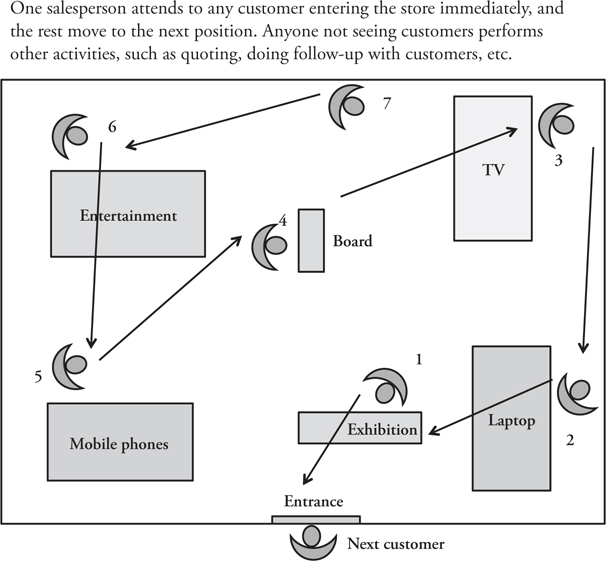
Figure 6.9 Standard rotation board for salespeople
This may seem rather simple, but it was the first time the salespeople had thought through a system of any kind to split tasks among themselves, and certainly it was the first time it was made visual. This system was spread throughout Jetstereo stores, and the results were astounding:
![]() There were higher sales per store.
There were higher sales per store.
![]() Customer wait time was reduced from an average of 2 minutes to under 10 seconds.
Customer wait time was reduced from an average of 2 minutes to under 10 seconds.
![]() More customers were engaged per hour since all salespeople were made available at peak hours and wait time was reduced.
More customers were engaged per hour since all salespeople were made available at peak hours and wait time was reduced.
![]() Customer satisfaction measures improved.
Customer satisfaction measures improved.
![]() Understanding peak hours though visual signals of “emergencies” led to better staffing and better scheduling of nonselling activities.
Understanding peak hours though visual signals of “emergencies” led to better staffing and better scheduling of nonselling activities.
![]() There was better coordination of administrative duties.
There was better coordination of administrative duties.
![]() Balancing of opportunities created comparable results between sales team members, which led to more focused and effective coaching and training.
Balancing of opportunities created comparable results between sales team members, which led to more focused and effective coaching and training.
![]() The practice of customer “picking” was eliminated.
The practice of customer “picking” was eliminated.
Keeping Standard Work Alive Through Audits
To put it simply, if management takes standard work seriously, then those who do the work are likely to take it seriously—particularly if the manager is truly a leader. Taking it seriously means auditing the standard work, which can take on either a coercive or enabling flavor with dramatically different consequences.
Audits are often associated with coercive bureaucracy as we saw in the case of NL Services. The efficiency expert comes in with a stopwatch and a notebook, or perhaps a notebook computer, and observes people performing a process, all the while looking for inefficiencies or rule violations. The auditor then writes a report documenting the violations, which gets a lot of people in trouble. This can and does still happen, and the fear of audits is often justified. In a culture that supports a coercive bureaucracy, it is quite typical for any audits to become a tool for evaluation and rewards and punishments. This applies both to lean audits to see if the “proper” lean and six sigma tools are being used and to standard work audits. Unfortunately, this type of coercive culture is not likely to change quickly or easily.
However, as Paul Adler observed at NUMMI, standards and audits of standards can be a part of a totally different cultural context in which team members feel supported by management. NUMMI was the original documented enabling bureaucracy. What did a standard work audit look like? I happened to be visiting NUMMI the year it had introduced a more visible system for auditing standard work on what Toyota calls a kamishibai board. This means a “story board.” For young children in Japan, it is common to have a book composed of a series of note cards. The parents can read each card one by one putting the card they read at the back of the pile so they can start on the next card the next time.
Figure 6.10 shows a board that NUMMI designed to train a group leader who has a certain number of processes to oversee. For each of the 15 assembly-line processes on the board, on each shift the group leader audits a team member performing the work. The group leader answers a series of yes-no questions that are written on a card, such as “Did the team member follow the specified sequence?” “Did the team member do the job in the prescribed time?” Completed audit cards are put into the slots to the right, and if an answer to any of the questions is a “no,” the group leader will put the card in the slot with the back side, which is gray, facing outward and write down the problem on the problem tracking sheet. When the problems are addressed, the group leader writes down the corrective actions on the card and turns it to the front, white side out. Each shift the manager of the group leader comes down and selects an audited card to audit a second time to give feedback to the group leader.
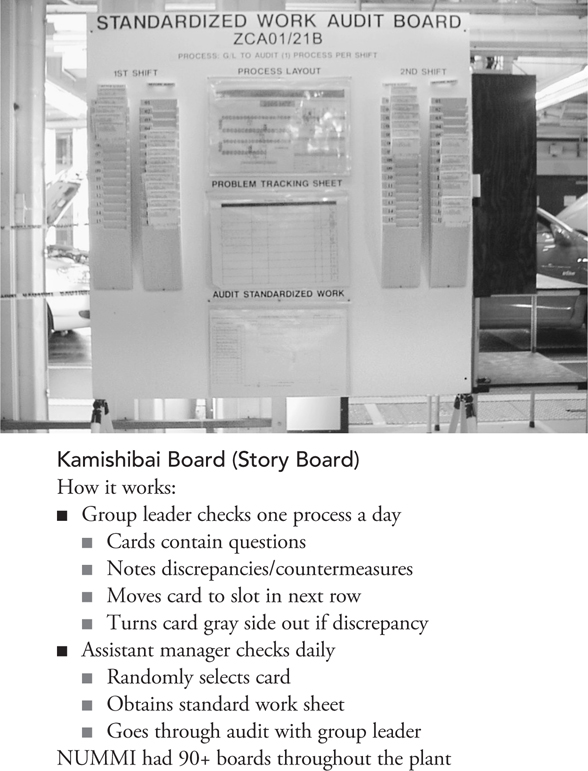
Figure 6.10 NUMMI standard work audit story board
We might assume the reason for this audit board was because the plant discovered that the workers were not following the standard work properly, but that was not the case. The problem was that the group leaders were not well trained in the fundamental skills needed to do their job. There was an exceptional amount of turnover leading to inexperienced group leaders, and the annual plan included a commitment to train group leaders in the fundamentals of TPS. This was part of their training. It also had the benefit of tightening up the use of standard work. Additionally, this forced their managers to go to the gemba and better understand the work while they learned to coach the group leaders. Thus, in an enabling bureaucracy, standard work is a collaborative tool that supports quality and consistency of work, continuous improvement, and effective coaching.
PRINCIPLE 7: MANAGE VISUALLY TO SEE ACTUAL VERSUS STANDARD
In a sense visual management is simple once we have determined the standards, and in another sense it is one of the most creative parts of lean management. We have seen in this book many examples of visual management, for example, from Menlo Innovations and ZMO. The Menlo work authorization board (Figure 5.20 in the previous chapter) is a great example. This is not standard work, but it creates a structure for the daily work. The story cards instruct the programmer on what features the customer wants that have been authorized for payment by the customer. The red, yellow, orange, and green sticky dots make clear to the project manager what the status is for each feature. Menlo is not simply displaying information on cards but using the story cards on a daily basis to organize the work. Ask Menlonians why they bother to create paper systems throughout the shop when software developers often hate paper. They will speak of the benefits of tactile manipulation of the paper and how it supports teamwork for communicating, planning, and tracking progress.
Our brains are hardwired to appreciate visual information. We remember more, and learn more, with less mental effort. Neuroscientist John Medina, in rule 10 of Brain Rules,4 writes: “Rule #10: Vision trumps all other senses. Hear a piece of information, and three days later you’ll remember 10% of it. Add a picture and you’ll remember 65%.”
Consider the table of data in Figure 6.11. Is it clear from the table what the pattern is? How about from the graph next to it? Which would you prefer?
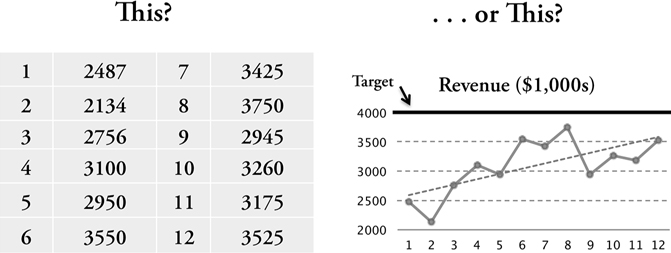
Figure 6.11 Why we like things visual
True visual management shows at a glance when there is an out-of-standard condition, and then team members are trained in how to respond. In Chapter 5, we learned that at ZMO the employees work to an average takt and average time to perform a task, but in reality both are variable. The expected customer demand does not match the actual customer demand as the day proceeds, and the picking times vary with exactly what items are picked. In service organizations there are relatively few instances where time per customer can be precisely planned. Therefore, it is critical to identify when there is a deviation from our expectations and specify how to respond.
One clever use of visual management at ZMO supports what the business calls “help your neighbor.” On the picking line there are flags along the conveyor (see Figure 6.12). On each side of the flag is an instruction like “Pull ONE BATCH of tubs from buffer.” This indicates that team members should follow one-piece flow and not grab multiple tubs. The flags serve another function, as well. If a person downstream is taking longer to pick than a person upstream, then a buffer area between the two flags will start to fill up. When there are three tubs filling the buffer area, it is a signal for the upstream person to come and help her downstream neighbor get caught up. There is no value in continuing to fill tubs upstream when the downstream tubs on the moving conveyor are backing up. As you can see in the photo in Figure 6.12, there are two tubs in the buffer and the picker has just completed one tub and is placing it on the moving conveyor. If he had taken a few more seconds, there would have been three tubs, which would have signaled the person just before him to come to help. This buffer is also a mechanism for leveling the workload between associates.
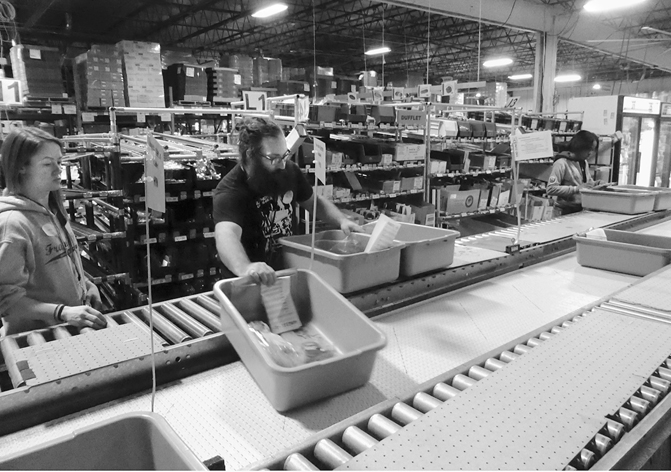
Figure 6.12 ZMO picking line with “help your neighbor”
Some tasks do not lend themselves easily to standard work. For example, the people who put items ordered by the customer into boxes for shipment must use their judgment. Each customer can order a different combination of items, and ZMO has not found a precise way of calculating the exact volume of box that is needed. So the boxers are trained to visualize how the items will be arranged and how large the box needs to be. However, ZMO found a visual job aid that enables the workers to use better judgment. Based on a rough estimate by the computer of the items to be packed and the volume they will need, the computer suggests a color-coded box size. A display shows the different box choices arranged with a color swatch on the box (see Figure 6.13). This is visual information supporting the judgment of the team member.
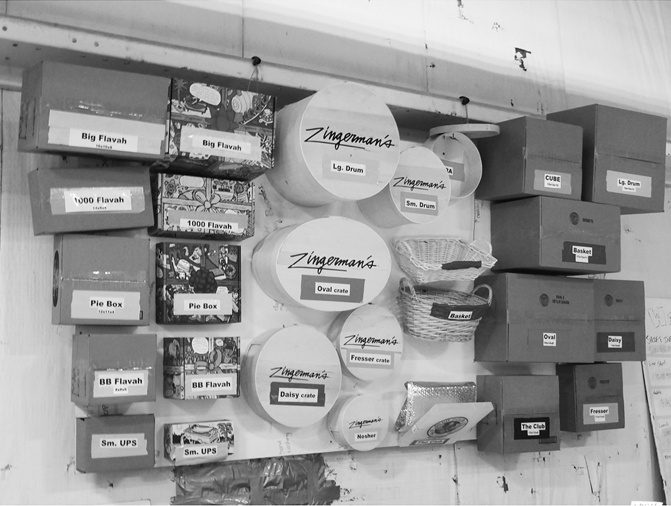
Figure 6.13 ZMO visual box-size guide
Another visual tool at ZMO is intended for “mistake proofing.” There are many standard gift boxes that have the same collection of items ordered every day. For the popular boxes with standard items such as the “weekender,” ZMO creates a single station to assemble them. ZMO also developed a template with cutouts the sizes of the individual items. Before loading the box the assembler will place each item on the template, and when each space is filled, she knows she has exactly what is needed for the box (see Figure 6.14).
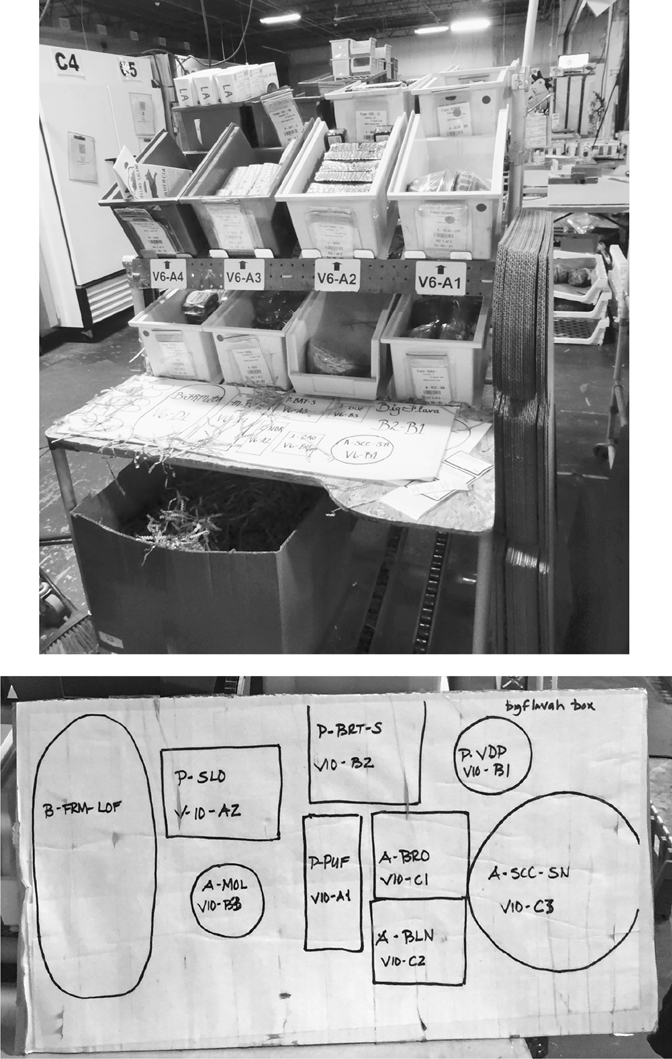
Figure 6.14 ZMO mistake-proofing template for items in a standard gift box
When visual information is displayed for people to peruse at their leisure, as on a bulletin board, we call this “visual display.” It seems nice to have, but it is not essential to doing the work, and as a result it is often not well maintained. When visual information is used as an essential part of the daily work to signal standard versus actual, we call this “visual management.”
Making Daily Management Visual in an Aircraft Engine Company
It is always exciting to me to see real visual management, where the information is seriously used. I had the opportunity to visit MTU, a German company that builds and repairs aircraft engines. MTU has a large factory in Munich, and I visited it with a partner of Staufen, the consulting firm that supports the aircraft company. We spent time at MTU with a member of the board of directors, the senior vice president (SVP) of Operations. Staufen has been teaching executives the proper way to use visual management as a tool for coaching leaders.
The MTU factory in Munich has over 150 information centers on the shop floor, which are visual meeting areas for stand-up meetings. Displayed on white-boards are various metrics and targets for cost, quality, delivery, inventory, safety, and morale. There are also human resource measures like attendance. Short meetings (10 to 15 minutes) are held every day, and the main discussions focus on what happened yesterday and what the group can improve on today and tomorrow. The SVP runs the plantwide meeting, and there are meetings at all levels down to group leaders.
At first the people from Staufen did the coaching, but they then trained internal full-time coaches—senior leaders and middle managers—to do daily coaching. Coaching means listening and watching and giving feedback. This was not a company that was new to lean; it had years of experience using almost every improvement tool imaginable. The company finally became convinced that the key to sustainable competitive advantage was leadership, and so it committed to developing lean leaders at all levels.
The senior vice president working with the head of lean began with a pilot area for about six months, and the SVP chose to use that time and more to persuade the managers to buy in. In fact, before deploying the information centers across the operation, he spent over one year holding regular meetings and bringing managers to see the pilot area firsthand. The result was that 100 percent of the managers bought in.
The SVP committed to spend time the first half of each day at the gemba. He simply refuses to allow anything else on his schedule before lunch. He explained that his coaching style had been more directive, telling people what to do. But he took his coaches seriously, learning to ask questions and challenge the leaders to grow. He admits it was difficult to shift from telling people things to asking them to think for themselves, but his progress was remarkable.
The results included impressive gains in productivity and quality and reductions in inventory. Morale and safety rose to levels never before experienced. But there are also intangibles that show how a culture of engagement is building. For example, the business tends to be cyclical, and there are slow periods followed by a lot of work. At some point in the week, it generally becomes clear that overtime and weekend work are needed to make the schedule. In the past the manager might ask for 10 volunteers, and people would look away or put their heads down. Now the visual display makes it clear to everyone what extra work will be needed, and team members work it out even before being asked by management. When I visited in November 2015, snow was forecast for the weekend with perfect ski conditions; yet the company already had volunteers to cover overtime.
The daily management system started in manufacturing, but the company was also holding daily meetings in information centers for service operations like purchasing and logistics. Product development had committed to piloting the system with daily meetings. The company has developed a breakthrough new engine that had five years of fully booked sales before it could even build the first production engine. The company’s business plan was to grow sales by 20 percent with a 10 percent reduction in labor, using attrition to deal with the excess people. Nobody doubted it would succeed through the evolving culture of continuous improvement.
PRINCIPLE 8: BUILD IN QUALITY AT EACH STEP
Toyota became famous for its policy of stopping the line when there is a quality problem. What became known as the “andon” system began with a very practical problem when Sakichi Toyoda was working to develop a fully automatic loom. As the looms became more automatic, humans did not need to do much more than load in thread and unload cloth. Yet people had to stand by the machines to watch in case a single thread broke, which would lead to defective cloth. Toyoda had a very strict policy of not wasting people’s time and felt that this was a case where the person was subservient to the machine when the machine should be serving the person. As Toyota president Eiji Toyoda later explained: “A person’s life is an accumulation of time—just one hour is equivalent to a person’s life. Employees provide their precious hours of life to the company, so we have to use it effectively; otherwise we are wasting their life.”
To free up the person, Sakichi Toyoda developed a mechanical line-stopping method that caused the loom to stop itself when a single thread broke. However, with many noisy looms operating at once, it could be difficult to tell that a loom had stopped. Thus Sakichi introduced the andon, a metal flag that popped up when the loom stopped itself, in essence saying, “Help me!”
Today’s andon in assembly is a more elaborate system of lights and sensors: when the assembly worker pulls a cord, a light identifying that workstation lights up and calls for help. The team leader has seconds to get to the station to see what is going on and has the right to decide to pull the cord again and override the line stop. If the car passes into the next work zone without the team leader pulling the cord a second time, then the line actually stops.
Andon literally means a light and is a form of visual control, like a traffic light (see Figure 6.15). All the lights are green when everything is okay. The light for Process 3 turns yellow, which means the andon cord has been pulled and there is some abnormality, but the line keeps moving. When the car enters the zone of the next process the light for 3 will turn red meaning the line has stopped. The standard within Toyota and much of the world: green is go, red is stop, and yellow is in between.
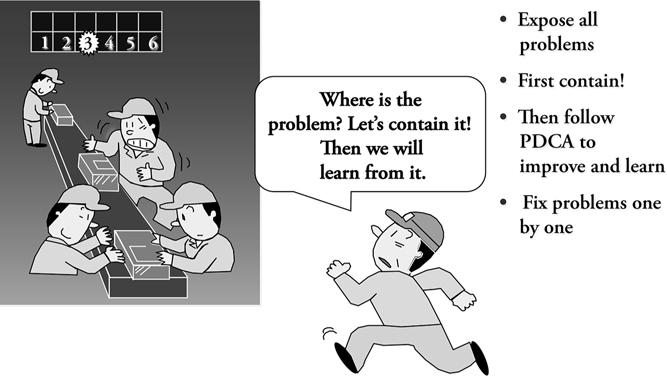
Figure 6.15 Andon requires a quick response
Stopping the line for any out-of-standard condition is rather dramatic. Talk to Toyota managers and workers about their first experience pulling the cord, and they will describe feeling reluctant and nervous, with many of the symptoms of severe stress. Announcing to the world there is a problem is seldom welcomed, but Toyota has built a culture that honors those who find problems. “A problem is a buried treasure,” we hear.
Having an elaborate system of sensors and lights is not the main issue here. What’s most important is building a culture of people who immediately alert leaders to any problems they notice and having a help chain in place so that well-trained people respond immediately to contain the problem and then solve it. If the problem is not contained within a process, one segment of the line stops and the problem is escalated to the group leader. If a small buffer of cars leading to the next work group empties, then the manager gets involved. Everyone has a role to play to support production when there is an abnormality. This culture has been painstakingly built in Toyota, and more recently it has been introduced in the labs of the Henry Ford Health System.
Quality Improvement at Henry Ford Health Systems Diagnostic Labs
No hospital can run without a lab analyzing blood and tissue samples. Every doctor working on a serious case is dependent on the results of lab tests. Unfortunately testing is often taken for granted, like breathing oxygen. As long as it is available, it is out of sight, out of mind. But when it does not function, it is a crisis, particularly if patient samples get mixed up and the wrong diagnosis is made.
Dr. Richard Zarbo, chairman and senior vice president of pathology and laboratory medicine at the Henry Ford Health System, decided he had had enough. He was not satisfied with the quality or efficiency of his lab, and he was not satisfied with his own leadership style despite decades of management experience. Moreover, he felt that he had let down Dr. W. Edwards Deming, who had influenced him years earlier about building in quality. Things had to change starting immediately.5 Dr. Zarbo attended a course on lean management and he was hooked. He saw lean as a practical version of the philosophy Deming preached. He went to work on his lab immediately, first trying to lead it himself from the top down and then learning to engage leaders at all levels. It was a major professional and personal transformation for Dr. Zarbo and the results were spectacular putting his labs into the limelight as a global benchmark of lean management in practice.
The Henry Ford labs in 2015 generated $600 million in revenue and employed about 750 of the 23,000 people working in the Henry Ford system. The labs serve six acute care hospitals and 30 medical clinics. Lives literally depend on the laboratory system. In large part because of its world-class quality, the lab in Detroit, southeast Michigan, has been steadily growing, taking on testing for the majority of Michigan, extending its services to clinics and healthcare providers outside the Henry Ford system. The quality is the result of a decade of both developing a culture of people who are seeking perfection and building systems to detect and eliminate defects.
With over 11 million lab tests per year, the lab depends on data analysis to identify common problems to attack. A new defect management system was initially based on human detection of nonconformances. This was eventually supplemented by specimen deviation data from the Henry Ford Health System’s laboratory information system called Sunquest. The computer system collects data in real time as tests are being conducted and flags the defects immediately when they are discovered. This is like an automated version of the andon system of Toyota.
Zarbo decided to go after the top quality certification for labs, ISO 15189. The deviation management system was required for the challenging ISO quality accreditation, but Zarbo thought the system was already quite good. However, through working on the certification and setting up the Sunquest system, Zarbo discovered it was not as good as he originally thought. The team began tracking defects with 36 generic types selected from a menu. Zarbo and the members of his group quickly concluded the generic menu was not effective, and they needed more specific classifications. The “other” category was filling up. They looked at the most frequent defect classes and where they originated, e.g., from a provider group like hematology or from their own processes. They eventually developed 125 types.
They were ready to deploy the deviation management system and began by rolling it out to the anatomical pathology department, but it was not well received. There were many defect classification codes that were foreign to the pathologists, and as a result, they did not feel comfortable using the system. With a decade of lean management the laboratory culture was open to input from all and Dr. Zarbo was not going to impose an overly complex system onto the pathologists. He learned the hard way the harm caused by this type of coercive bureaucracy.
To tailor the system to the pathologists, Zarbo and the members of his group decided to survey the pathologists to identify the most frequent defects. Zarbo and his group developed a list of the 30 most common defects ranked by severity. Ultimately that number was reduced to seven of the most frequent and serious defects. The anatomical pathologists wanted a paper copy listing the defects so they could document where they thought a defect came from. In response, Zarbo’s group designed a one-page form for the pathologists. But when they saw it, they said it was still too complex and in the past they only needed one-half page. So the quality group reduced the categories further and got down to one-half page, more similar to the original list, but with different categories based on all the data the new system collected. The goal was not to create the most elaborate and comprehensive system possible, but to develop the simplest version that would be useful and used for actual improvement. And it did get used, and defects dropped day by day, month by month.
The Henry Ford Health System has been under great pressure to reduce costs based on generic cost reduction targets every year. Yet Dr. Zarbo’s “lean program” focuses most heavily on reducing the time it takes to get results back to the doctors and on the quality of those results. Why is he so passionate about quality? According to Zarbo:
As the head of the lab, if we get sued, I am personally liable. The license is in my name. With over 11 million tests in a year we need a quality system to show we are not perfect but we are making strides every day. We want to be a best in class laboratory. I know of a case where a surgeon removed the wrong breast of a patient as a result of a lab error. They are still being sued. I have never been sued. If we do get sued, we can show what we have been doing with hard data. We are at 99.73 percent accuracy internally, and virtually none of the defects get through to the customer. No other lab can tell you that. Others claim they run great labs. We can say it with data. And we have learned that great quality means higher productivity.
After 10 years of this intensive focus on quality, there are very few defects originating within the lab. Of the 0.27 percent, 90 percent comes from suppliers—those who collect the blood and tissue samples (0.18 %). But Dr. Zarbo is responsible, and so slowly but steadily he and his team have worked collaboratively with suppliers to standardize their processes and eliminate defects. Defects can include mislabeled samples, too little blood to conduct the test, contamination in the sample, and more.
We can see in Figure 6.16 the types of defects the labs had in 2014 using the defect categories that the members of the quality group created. They playfully call these the “Big 11 All-Star Team of Deviations.” Nine of the eleven are “preanalytic,” which means they originate outside of Zarbo’s labs in the clinics and hospitals that collect the samples, like wrong test ordered, clotted samples, and insufficient quantity. These account for almost all the defects. The first response by his staff to this data was exactly what Dr. Zarbo did not want to hear: “It is not our problem.”
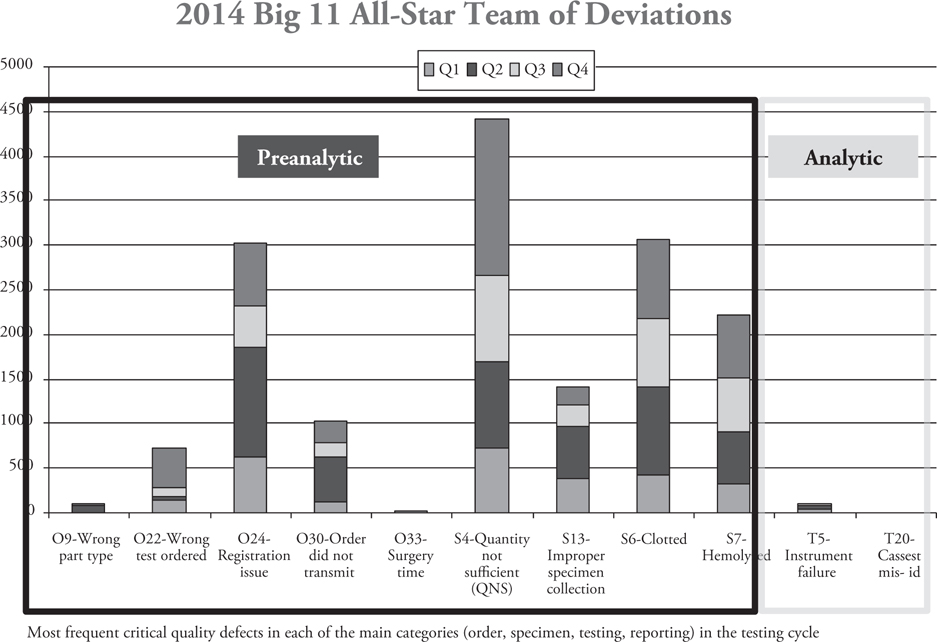
Figure 6.16 Henry Ford labs summary of quality defects by source
Zarbo and his quality czar set up a process of working with suppliers to resolve problems identified in the data. In one example of working with one of the branch labs, the Fairlane medical center, they were able to reduce order defects by 78 percent in three months after having the quality defect data properly categorized and visible and with coaching from Zarbo’s team (see Figure 6.17). In one year, they reduced lab order defects preanalytic by 99 percent!
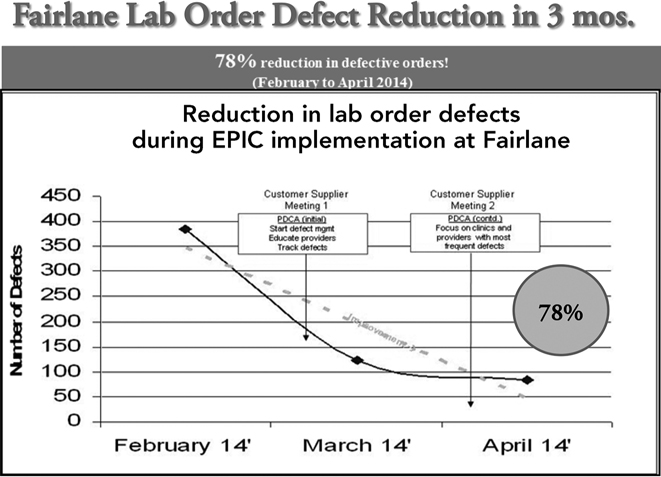
Figure 6.17 Henry Ford labs quality improvements with a branch lab supplier
Even with this success they continued to work to improve their own internal processes. Dr. Zarbo had enough experience with continuous improvement to realize that automated defect detection systems do not solve problems—people do. Therefore Zarbo’s team worked intensively to develop a daily improvement system at the level of the work group. Zarbo first saw how a daily management system can work when touring the labs of their equipment vendor, part of Danaher Corporation. Danaher is one of the pioneers of lean, as written about in Lean Thinking. Zarbo negotiated to have Danaher trainers help the labs set up a daily management system in 2013. It started with a day of training for all management about how to set up a visual tracking board and to hold daily work group meetings. Zarbo’s leaders then figured out how to adapt the visual management displays to their own system. It is an integrated corrective action system and drives both daily problem solving and deeper problem solving for more complex problems on the same board. Every department has its metric board for QTIPS—quality, timeliness, inventory, productivity, and safety—and holds daily meetings. In the beginning the managers did not know how the system would be accepted, so they did a pilot. Within two months there was a flurry of activity, and within a year there were hundreds of process improvements. Over time there was a shift toward tackling bigger, more complex problems.
The first reaction to a defect is a rapid fix to get accurate results to the doctor, a rapid fix that contains the problem. This is followed by corrective action, which means going back to find the root cause and improving the process. The labs use an A3 process—one side of one sheet of A3-size paper—to work through the corrective action (discussed in Chapter 9).The various processes for improving the work are summarized in Figure 6.18. Each month Zarbo and a small panel select a team to present their best improvement project in a “share the gains” meeting of all employees and management to spread what has been learned and provide recognition to the teams.
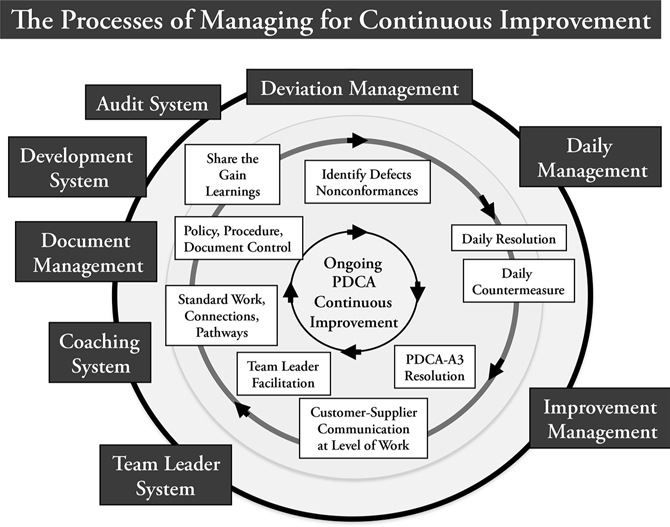
Figure 6.18 Henry Ford labs improvement process
I am pretty certain that any quality department in any company would recognize the fundamentals of the Henry Ford quality system. “We have had a similar quality system for decades and see regular improvements in defect reduction.” I believe this is true but wonder how many organizations really have defect prevention built into their culture. In Zarbo’s experience, most labs work on rapid fix and get on with it. Preventative action means changing the process so that it never happens again. This is where lean comes in—finding the root cause and changing the process. Zarbo notes: “We are among a few labs that always focus on changing the process. We can dominate anyone on quality and quality alone. With our culture we can innovate. Bring it on. We will get the cost reductions. And we can grow based on quality.”
Designing Quality into Menlo Software
One thing not so visible on a tour of Menlo Innovations is its religious use of a best practice, which is rarely practiced by others, called unit testing. For each “unit” of code (generally a single function), the software programmer builds a test or tests that can reveal defective code. In a sense you are programming twice—one is the original code, and the second is code to test if your code is “fit for function.” An added benefit of creating the test is that it forces the programmer to think deeply about the inputs, outputs, and error conditions and thus the unit’s desired behavior. You can see on the wall near the work authorization boards a chart that records each of the unit tests designed and run, which can get into the hundreds of thousands for a complex project. The result is designed-in quality so the software rarely fails.
Unit testing also frees up Menlo’s group of “quality advocates” from wasting time searching for defects. To get from an orange dot to a green dot, a quality advocate comes and checks the software. The quality advocate works closely with the technical anthropologists and is checking whether the software meets the customer requirements and is user friendly. In fact, some quality advocates were technical anthropologists and do not have software development training.
After the quality advocate approves, the team gets rapid feedback watching the customer attempt to use the software in the weekly reviews. Software that fails because of defective code, or software that is not satisfying to the customer, does not last beyond these rigorous tests. As we noted earlier in the book, years have passed without a customer complaint after the software has shipped. As a part of the pursuit of joy, Menlo wants any failures or customer concerns to be detected and resolved as the software is being developed. Of course, this requires some up-front money, but as quality guru David Crosby noted, “Quality is Free.”6 What he meant was that any up-front investments will pay themselves back in multiples due to much lower rework and customer pain.
Richard Sheridan tells an amusing story about the company’s most successful project to write the software for a complex portable blood analyzer. Accuri Cytometers engaged Menlo Innovations to design and build the software that ships with each unit. He describes how Leo, Menlo’s customer service guy, carefully packs up the unit and ships it to Accuri, anxious to learn if it will satisfy the customer. He intends to give detailed instructions on its use as soon as it arrives. When he does not hear from his contacts at Accuri, he is desperate to know what is going on. Finally after waiting in agony all day and night, he calls them the second morning, and they pleasantly reply: “Oh yeah, we got the box yesterday morning. We just unpacked it and started using it right away. We’ve been doing science with it for two days. It is great!”
Customers who choose to work with Menlo are willing to pay for tech anthropologists in an extended up-front customer requirements phase, they are willing to pay for pairs of programmers, and they are willing to devote their time to weekly reviews. This is all costly, but the end result is lower-cost software, in large part because of avoiding all the costly rework that happens in traditional development processes. Richard calls this “lower cost, at a higher price,” which means there are some higher prices but in large part because of built-in quality the overall cost of the software is much lower.
PRINCIPLE 9: USE TECHNOLOGY TO ENABLE PEOPLE
Information technology is the lifeblood of many service organizations. And as we saw in the Henry Ford labs, it can be a source of critical data to build in quality. But too often it becomes more of a barrier than an enabler to service excellence.
Like bureaucracy, technology can either be done to us in a coercive way or implemented to enable us to better do our jobs. Nothing feeds mechanistic thinking like technology. We are bombarded with it in the media. Software companies pop up like weeds, promising that their “solutions” will save the world from poverty, disease, and pestilence. If the Internet was not enough we now have the Internet of things to add sensors and gizmos to run everything by computers. One gets the impression we are like Mario living in a big video game.
Lean is very much about reality. “Go to the gemba!” is the battle cry of the lean practitioner. The gemba is reality, not a computer screen. We saw with Menlo Innovations that technical anthropologists go to the gemba and find computer users’ needs that can be surprising to the customer and even the users themselves. Menlo technical anthropologists are not overdramatizing when they explain their mission is to “end human suffering as it relates to technology.” Founder Richard Sheridan loves technology and finds it a crime against humanity to take such a beautiful human creation and turn it ugly and painful to use.
What is the attraction of technology to mechanistic thinkers, and why would they accept technology that is hard to use and maintain? I believe it is a result of the mindset of using technology to replace people. The way technology is often cost justified is through labor reduction. When that is the goal, we stop thinking creatively about the ways technology can improve quality of service and functionality, and we are myopic in thinking about how we can get the technology in and the people out as quickly as possible.
One of the top 10 reasons lean programs fail in my experience is because of the disruption of installing enterprise integration software systems like SAP. There is nothing necessarily harmful about these computer systems that prevents lean, but when we work with companies that are developing momentum in learning about lean, we often start to find engagements canceled because “we are having problems with SAP implementation and my team is now on 24-7 alert to help install SAP.” Once SAP enters the organization, like a virus, its advocates want to use it for everything. It schedules operations that would benefit more from visual pull systems. If provides “workflow management” software to impose an artificial structure on the execution of projects. I worked with leaders at a product development organization that wanted to buy materials for prototypes in small lots, but the SAP protocol would not allow them to do it. They had to find a way to fool the system. This is a problem not just unique to SAP, but a disease of trying to make processes conform to the technology.
Karyn has worked with many organizations in which the “computer systems seem to run the people, instead of the people running the computer systems.” She has often heard service representatives say to customers, “I’m sorry, we can’t do that. Our system doesn’t allow us to.” And she has attended many huddles in which “computer system” problems were the only problems discussed. It seems many people now believe that the only types of problems that exist in services are computer system problems and that if the computer systems were only better, newer, faster, and more integrated, then all service problems would be instantly resolved. This, however, is an example of mechanistic thinking. In an organic lean culture, we recognize that our computer systems are never perfect and need to be continually improved as we learn from experiences working with them. A document that is received late by a customer, or a flight or hotel room booked improperly, is not necessarily the result of a computer system error. If we assume that it is, then we overlook the opportunity to develop our people’s problem-solving abilities. (We will discuss this more in Chapters 8 and 9 on developing people and problem solving).
Technology Fiasco in a Healthcare System
One of my PhD students, Brock Husby, spent years working as a lean healthcare consultant as he was getting his PhD. One engagement, which turned out to be part of his dissertation, was to help a statewide system recover from a poor process of justifying and installing an automated, centralized laundry system.7
Toyota’s predominate approach to technology is to use proven, reliable technology applied to well-defined and understood processes. They prefer to test the simplest solution, often on a pilot basis, before deploying more advanced technology. Often Toyota will delay new technology deployment until the site is ready, which means its processes are already lean and under control. The pilot program invariably reveals issues that the creators of the technology missed in the original design. Processes get fine-tuned, and the technology is adapted to support the process.
The hospital system that ultimately called Brock in for help did the opposite. It had laundries distributed through the healthcare system, and they worked well enough, but the processes to use them were not well defined and definitely not standardized. An executive commissioned a financial analysis that showed the organization could save millions of dollars per year if it centralized the laundry in one common facility that did the laundry for the entire state system. By using the latest technology, it would need a minimum of labor.
A total of $10 million was invested in a state-of-the-art facility. From the initial launch of the laundry, shortages of towels and scrubs were threatening to shut down the operating rooms at the main hospital (the financial engine), and the off-site laundry processing and onsite laundry distribution managers were not on speaking terms with each other due to animosity and finger-pointing about this poor system performance.
A fixed daily order for laundry was in place, with no system to react to variation in demand other than expediting orders or stealing from other departments. The chief operating officer (COO) of the hospital was getting 44 calls a day from angry department administrators, and most hospital employees were frustrated with the new process and wanted a return to the old system.
The $10 million investment (business failure), poor performance (technical failure), and low customer satisfaction (social failure) led to a call for help to Brock. The people at the healthcare organization thought that lean thinking might bail them out. Diving into the gemba, Brock observed and interviewed people for weeks and worked with a team to map the current state of the process, and then the team came up with a shared future-state vision and accompanying action plan. The team consisted of the on-site and off-site laundry managers, frontline staff, industrial laundry technical staff, truck drivers, and several internal customers. Brock facilitated the problem-solving process, but team members developed, implemented, and refined the process.
As the project progressed, the capability of the team members increased as they became more familiar with the approach and began focusing on process metrics (that weren’t available at the beginning of the project). This was obviously a burning platform, and after completing 147 of the 150 action items, the process was working smoothly with no outages or calls to the COO. Also, the team reduced the workload per cart and improved other measures of efficiency. Frontline staff members who had never been engaged in creating their processes created a system of visual kanban replenishment (a pull system) to adjust orders to actual usage. Core process measurements were established and actively used for ongoing problem solving. The off-site and on-site laundry managers, who were not on speaking terms initially, were now friendly and communicating multiple times per day to dynamically coordinate the flow of laundry.
Improvements were not technically complex. An example of one of the improvements was shifting where the soiled linen was temporarily stored from the third floor to the basement. Before this change, the laundry staff had to take a heavily used elevator that only carried two carts to the third floor, which increased the number of trips and resulted in significant wait time for an available elevator. With the dirty laundry stored in the basement, a large freight elevator located at the loading dock could be used (which also greatly decreased the distance to be traveled to get to the elevator), which had a capacity for six or more carts and was only one level away from the basement storage room. This had a significant and immediate effect on the newly established metric of average time per cart.
Unfortunately this type of case is all too common—getting an abstract idea about the benefits of a new technology, building a business case, and then deploying without deeply understanding the reality. When we introduce any complex technology, there is a great deal of uncertainty, and yet technology providers often act like implementation is a routine process. Brock suggests a six-step process to effectively introduce new technology, which involves learning step by step as you go through PDCA:
Step 1. Clearly define the problem or need.
Step 2. Carefully evaluate the process and improve it as much as possible before leaping into new technology.
Step 3. Consider the skills required and develop a plan for training and involving the people affected by the introduction of technology.
Step 4. Introduce the technology first on a pilot basis to learn and work out the bugs and the process of introducing it.
Step 5. Introduce the technology into other locations in a stepwise fashion, with local management taking ownership and leading the process.
Step 6. Using an effective daily management system, expect the people responsible for the work to continue to improve the technology and process.
Automation at Henry Ford Health System Labs
These days fully automated lab work is the nirvana image. When Dr. Zarbo began the lean journey in 2004, he and his team benchmarked a lab nationally known for its labor efficiency. They discussed what they saw. They appreciated the efficiency as banks of automated equipment hummed away, but they agreed this was not the culture they were envisioning for Henry Ford. It was too sterile and mechanistic. People were appendages to the machines, not actively thinking and innovating.
As Zarbo and his team started down the lean road, they again looked at where automation might fit in. Before the lean transformation at the labs they were working toward a target to turn around blood samples in 60 minutes for the emergency room. Within one year on the lean journey, Zarbor raised that target to 45 minutes, and by 2015 his labs were able to complete 90 percent of what was ordered in 30 minutes. This was after thousands of process changes. They automated some processes, but most of what they did was tear apart the labs and reorganize them into manual cells in a clean flow. The labs were never fully automated. By streamlining the processes, humans were able to do a lot of efficient things to get samples prepared in sequence for the work cells and the material handling system to get completed results to doctors. The lab technicians were able to go faster than automated processing, and in fact automated lines, at that time based on batch processing, would have slowed them down.
Over the years automation has been enhanced, and the labs were in the process of switching to automated lines in 2015 working with the Beckman Coulter subsidiary of Danaher, which had selected the labs as a model for integrating lean culture with automation. As Zarbo explains:
There is a highway of multiple lines and crossovers, and bar codes tell us how to switch between lanes to get faster results. Now it is faster than we are. But we still have to get stuff to the line. We have a 10:30 meeting every week. We sit down with folks from the manufacturer. We designed the front end to shrink time to the line and the back end to speed results to our customers. The computer monitors have real-time andon built in. Beckman Coulter is using us as a global model for its other clients.
People can get improvement from an automated line, but they will be limited by the 90 percent of problems that come to the line in the supply process. That is why Danaher selected Henry Ford as a center of excellence. It wanted to show how continuous improvement can streamline the process and get the most out of the automation, from taking the initial sample to giving results to the patient. As Zarbo explains:
I do not want to drop automated equipment in the middle of the laboratory and let it run. I want to design the workstations to support the people. Do we need different management and leadership systems for an automated system where we cannot see the process? We have been preparing people for the last 8 months. We need the management level to understand everything about the laboratory.
Continuously Improving Automation at Toyota Machining and Forging
I will finish our discussion of automation with a remarkable example from Toyota. It is a manufacturing example, though not the usual image we have of a car being built on an assembly line. The Honsha plant in Toyota City is right next to the corporate headquarters and produces forged and machined engine and transmission parts for many vehicles. It is almost wall-to-wall automation. The company is fortunate to have Mitsuru Kawai, senior technical executive, running the plant. That job title is restricted to the best of the best in the Toyota Production System and in 2015 he was promoted to become a member of Toyota’s board of directors. As an Ohno student, Kawai developed a passion for continuous improvement as well as the obligation to teach. Kawai attended the Toyota Technical High School and worked his way up from production team member. When I interviewed him he had already spent 50 years at Toyota, 40 years of that time in the Honsha plant.
The basics of TPS were already in place when Kawai joined the plant, but his job was more than to manage a well-functioning plant. His target was to improve production labor efficiency by 2 percent over the previous month, every month. That continued for his entire career.
One obvious approach to this relentless improvement was automation. But this provided a special challenge for Kawai. He had learned the skills of TPS through manual work, visualization, making knowledge explicit, standardized work, and simple intelligent automation. The younger people working in the plant only knew automation. He said: “I do not want workers and engineers who think all they need to do is push a button and a part comes out. They still need to deeply understand the process so they can improve it.”
To teach TPS in this automated plant, Kawai devised a number of lessons. In one lesson he holds weekly, “my machine meetings,” the students hand-draw each step of the process inside the automated machines using paper and pencil, recording every move and every time metal is cut. He believes this leads to a deep understanding of the process and identification of opportunities for improvement. One major focus was defect reduction. When the students started the drawing, there were 2,004 defects per year, and in one year this was reduced to almost zero.
Another lesson is to stop automation and have highly skilled workers do the processes manually. Doing the job manually leads to ideas for kaizen when they rebuild the machine. In this way they were able to reduce the line length in half, striving for one-piece flow. When the Great Recession hit, Toyota realized that much of the automation was inflexible, making only a specialized set of parts, and fixed costs were high. The company used the approach “Make it small and make it grow.” The focus was on creating a multiproduct line, simplifying the automation, making the lines shorter, and making the process more flexible to adjust to demand. Note that although the equipment was provided by vendors who had their own experts, Kawai was leading hourly employees and engineers to redesign the vendor equipment to eliminate waste in the process.
One great opportunity for teaching became known as the “basic TPS line.” This is an old assembly cell that was originally set up in Brazil 75 years earlier. These simple cells were set up to assemble transmissions using a lot of manual work and simple intelligent automation. In the 1950s the volumes in Brazil were low, and there was a decision to close down the forging and assembly plant. Ohno simply refused to accept that the plant could not profitably make low volume and high variety and personally went to Brazil to teach the people there. When Brazil volumes rose by the twenty-first century, the company decided to eliminate the old manual cells.
Kawai saw this as an opportunity to establish a simple manual line for training purposes. He had all the equipment moved to Toyota City and began working with his team to do kaizen on the cell. The team in the Honsha plant started immediately to do kaizen and was able to shrink the floor space of the lean line by 50 percent. The team reduced the number of people needed to assemble the transmission from 10 to 1 person who makes a continuous loop around the cell every six minutes. The assembly line is scheduled by a visual box with cards to level the daily schedule by volume and mix each day.
One of the challenges Kawai posed to his students working on this basic TPS line was to do everything they could without electricity. With the large variety of transmissions that run through the line, there are a lot of parts to pick. It is commonplace these days for such situations to use electronic light systems to prevent picking the wrong part. We would often see lights lighting up by the right part and a light curtain that will signal if the wrong part is picked. Kawai’s students needed to design a simple manual way to do this. Someone came up with a “key kanban” (Figure 6.19). The color-coded key kanban is made of metal with a specific configuration and acts as a key opening only the cover of the bin containing the specific part that needs to be picked next. Each key kanban unlocks a different cover.
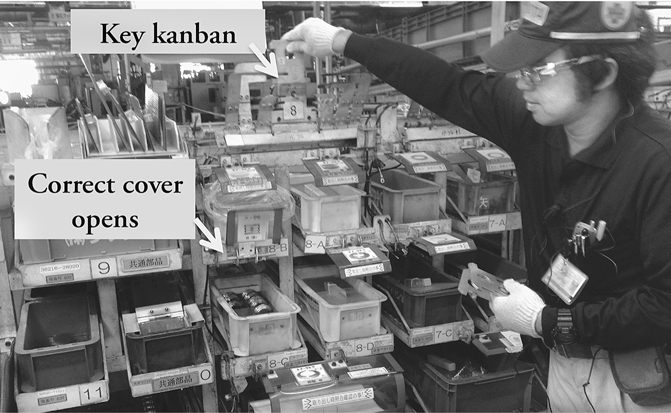
Figure 6.19 Manual key kanban opens only the cover of the correct part to pick next
I have not seen this level of dedication to deep training of the workforce anyplace else. Typically the attitude is that the experts will design the equipment, maintenance will help install and repair it, and operators will be supervised to run it. Kawai, to achieve his 2 percent per month objective, needed people on the floor to do daily kaizen. To do this he needed to school them in the basics of TPS and ask them to take responsibility for eliminating waste inside the complex automation. Mitsuru Kawai has a simple viewpoint: “The material should be flowing through the machines while changing the shapes at the speed of customer demand (takt). Everything else is waste.”
KEY POINTS
MICROPROCESS PRINCIPLES
1. Macroprocesses set the framework for microprocesses, which can be described as the view from the process level: how the daily rhythm of process, people, and problem solving is integrated to deliver service excellence on an ongoing basis.
2. Standards are approached very differently in organizations with coercive or enabling (learning) bureaucracies:
![]() In coercive bureaucracies, standards are seen as static, set-in-stone rules or SOPs to be followed mechanically; audits force compliance through rewards or punishments.
In coercive bureaucracies, standards are seen as static, set-in-stone rules or SOPs to be followed mechanically; audits force compliance through rewards or punishments.
![]() In enabling bureaucracies, standards are the best way known to do the work currently, and they provide the framework and basis for continuous improvement and organizational learning as the people doing the work actively look for better ways to do it.
In enabling bureaucracies, standards are the best way known to do the work currently, and they provide the framework and basis for continuous improvement and organizational learning as the people doing the work actively look for better ways to do it.
3. Managing visually allows us to easily see whether what is actually happening is meeting the standard, what should be happening:
![]() Using simple paper systems for visual management allows us to learn more easily, with less mental effort, while communicating, planning, and tracking progress.
Using simple paper systems for visual management allows us to learn more easily, with less mental effort, while communicating, planning, and tracking progress.
![]() When out-of-standard conditions are made visible at a glance, people can respond quickly and easily.
When out-of-standard conditions are made visible at a glance, people can respond quickly and easily.
![]() Visual job aids can be useful in cases where tasks may be too variable for more conventional standard work.
Visual job aids can be useful in cases where tasks may be too variable for more conventional standard work.
4. Building in quality at each step means creating a culture that allows people to identify problems and quickly respond to contain the problem, then solve it, before it propagates downstream:
![]() People must know, and be able to easily see, if what is happening is in standard (what should be happening) or is out of standard (a problem).
People must know, and be able to easily see, if what is happening is in standard (what should be happening) or is out of standard (a problem).
![]() Finding ways to identify and fix problems in a single-piece flow within a station is an integral part of delivering service excellence.
Finding ways to identify and fix problems in a single-piece flow within a station is an integral part of delivering service excellence.
5. Use technology to enable people:
![]() Although service processes are often highly dependent on computers, people run computer systems, not the other way around; computer systems need to support the work that people do to service customers in a timely and accurate manner.
Although service processes are often highly dependent on computers, people run computer systems, not the other way around; computer systems need to support the work that people do to service customers in a timely and accurate manner.
![]() Not all problems in service processes result from computer errors; assuming they do limits our thinking and actions to develop our people’s problem-solving abilities.
Not all problems in service processes result from computer errors; assuming they do limits our thinking and actions to develop our people’s problem-solving abilities.
![]() Before adopting any type of new technology, including self-service apps or online libraries, determine whether the technology both supports the customers’ service experience and connects them with your company’s purpose.
Before adopting any type of new technology, including self-service apps or online libraries, determine whether the technology both supports the customers’ service experience and connects them with your company’s purpose.