
Appendix E
The Math Behind the Examples
The L.I.F.E. glide path included case studies that helped demonstrate how you can get from one phase to the next. But does it work to guide you through the whole cycle? The math was intentionally limited in the core chapters to make the book approachable. This appendix contains more detailed math behind a number of the examples in the book and is the proof behind the process.
Let's revisit the hypothesis I outlined in Appendix A:
We can embrace a sensible, balanced approach to debt throughout our lives; an approach that is similar with the balance exhibited in nature, art, architecture, music, and even our own bodies. This balanced approach will reduce stress, increase financial security and flexibility, and increase the probability of a secure retirement. Used appropriately, strategic debt is not a waste of money, but rather, an opportunity to increase the likelihood you will be able to accomplish your goals in the short, medium, and long term.
In my experience working with clients of all ages, I discovered the zone where a strategic debt philosophy can have the greatest impact. I learned that people who save more than 25 percent of their income for more than 30 years before retirement likely don't need debt to make it. On the flip side, for people who save less than 10 percent for less than 10 years, they are likely not on track for retirement regardless of their debt strategy. If you are undersaved some strategic debt might help a little, but it isn't a magic bullet and it can't solve giant gaps in the overall plan. Chances are, you're somewhere in the middle. If that is indeed the case, it is my belief that if you are between 10 and 30 years away from retirement and target saving between 10 and 25 percent of your income, the decisions you make with respect to debt will have one of, if not the, biggest impact on your future net worth and your ability to comfortably retire.
So many people are dramatically undersaved, yet keep rushing to pay off their low-cost debt. These are areas where I see people focus when accumulating wealth:
- Returns
- Fees
- The news
- Asset allocation
- Risk
Debt is nowhere to be found. If this is where you were before reading this book, you're not alone. But I hope you'll think more about a list that looks like this:
- Asset allocation and debt
Everything flows from there. Your asset allocation and debt strategy will drive your net worth. As we discussed in Chapter 5, the effective use of asset allocation and debt can reduce your risk while maintaining your expected returns. Fees matter a little, but not as much in the big picture. And what you hear in the news should not matter at all.
I have been to hundreds of financial conferences and none of them discussed the long-term impact of the other side of the balance sheet. This makes no sense.
There is a belief that people do not like debt because, behaviorally, people cannot handle it. This is largely because debt that most people have had access to is oppressive. Behaviorally, people tend to buy high and sell low, when they should do the opposite, but we still encourage people to invest. Behaviorally, people typically don't want to eat vegetables or work out, but we encourage them to do so. I don't buy it that the issue is that Americans are so irresponsible that they can't handle debt. Even if that is sometimes the case, we owe it to ourselves to try and shift the behavior. I think you deserve the right to know what tools and resources are available to you over the course of your life: to enjoy the present, be prepared for emergencies, and be on track for a secure retirement.
Take a look at the math in this appendix and then you can decide if a debt strategy can help you better meet your financial goals.
Chapter 1: The Nadas, Steadys, and Radicals
Chapter 1 began with an example of the Nadas, the Steadys, and the Radicals. Recall that, “They live in a magical world with no taxes or inflation, interest rates never change, and investment returns are certain. This world is also magical in that banks will let people borrow however much they want for homes.”
The purpose of this hypothetical world is to lay out a simple laboratory to test the hypothesis that debt adds value. The rest of the book is designed to create a more specific glide path that conforms to “the real world” of how we live and to introduce variables such as returns, interest rates, and taxes.
The following were the base assumptions for all three families:
- They each start at 35 years old.
- They start with zero assets.
- They both make $120,000 per year and never make a penny more or a penny less.
- If they invest money, they earn a rate of return of 6 percent.
- If they borrow money, they can borrow at 3 percent.
- Their house appreciates by a rate of 2 percent per year.
- They both save $15,000 per year ($1,250 per month).
- They never move.
- Home purchase: $300,000
- Initial mortgage: $300,000
A 30-year fixed mortgage at 3 percent results in a monthly payment of $1,264.81. While it isn't specifically discussed, the chapter effectively assumes that the families have the following breakdown of income:

It is further assumed in this that they could choose between being interest only on their mortgage and amortizing the mortgage.
The Nadas
Table E.1 illustrates the Nadas at month zero, immediately after home purchase.
Table E.1 The Nadas, Month 0
| Assets | Amount | Liabilities | Amount |
| Investments | $ 0 | ||
| Home | $300,000 | Mortgage | $300,000 |
| Total assets | $300,000 | Total liabilities | $300,000 |
| Net worth | $ 0 |
The Nadas pay down their debt as quickly as they can, directing all cash and all savings toward reducing their debt.
- Present value: $300,000
- Interest / Year: 3%
- Payment: $2,500 per period = $30,000 year/12 = ($15,000 + ($1,250 x 12))
- Future value = $0
- Periods per year = 12
- Solving for number of months = 142.8 (rounded to 143)
The house appreciates at a rate of 2 percent per year, compounded monthly for 143 months, $380,664, which we round to $380,000. This results in the following balance sheet shown in Table E.2.1
Table E.2 The Nadas, Month 142
| Assets | Amount | Liabilities | Amount |
| Investments | $0 | ||
| Home | $380,000 | Mortgage | $0 |
| Total assets | $380,000 | Total liabilities | $0 |
| Net worth | $380,000 |
After 142 months, the Nadas are debt free. From here, they direct all of their savings toward building up assets.
- Present value of savings: $0
- Interest / Year: 6%
- Payment: $2,500 per period = $30,000 year/12 = ($15,000 + ($1,250 × 12)) ($15,000 savings + former home payment)
- Periods per year: 12
- Periods: 360 – 143 = 217
- Solving for future value = $983,103
The house appreciates at a rate of 2 percent per year, compounded monthly for 217 months, which is $545,409. (I round the future value of the house to $550,000 in all of the examples.) Table E.3 illustrates their balance sheet at age 65.
Table E.3 The Nadas, Month 360 (age 65)
| Assets | Amount | Liabilities | Amount |
| Investments | $980,000 | ||
| Home | $550,000 | Mortgage | $0 |
| Total assets | $1,530,000 | Total liabilities | $0 |
| Net worth | $1,530,000 |
The Steadys
Table E.4 illustrates the Steadys at month zero, immediately after home purchase.
Table E.4 The Steadys, Month 0
| Assets | Amount | Liabilities | Amount |
| Investments | $0 | ||
| Home | $300,000 | Mortgage | $300,000 |
| Total assets | $300,000 | Total liabilities | $300,000 |
| Net worth | $ 0 |
The Steadys pay down their 30-year mortgage as scheduled and save $15,000 per year every year for 30 years.
Value of investments:
- Present value: $0
- Interest / Year: 6%
- Payment: $1,250 per period ($15,000/12)
- Periods per year = 12
- Number of months = 360
- Solving for future value = $1,255,644
The house appreciates at a rate of 2 percent per year, compounded monthly for 360 months. Table E.5 shows the Steadys' balance sheet at age 65.
Table E.5 The Steadys, Month 360 (age 65)
| Assets | Amount | Liabilities | Amount |
| Investments | $1,260,000 | ||
| Home | $550,000 | Mortgage | $0 |
| Total assets | $1,810,000 | Total liabilities | $0 |
| Net worth | $1,810,000 |
The Radicals
Table E.6 illustrates the Radicals at month zero, immediately after home purchase.
Table E.6 The Radicals, Month 0
| Assets | Amount | Liabilities | Amount |
| Investments | $0 | ||
| Home | $300,000 | Mortgage | $300,000 |
| Total assets | $300,000 | Total liabilities | $300,000 |
| Net worth | $ 0 |
The Radicals pay down zero on their mortgage for 30 years.
Value of investments:
- Present value: $0
- Interest / Year: 6%
- Payment: $1,750 per period = ($15,000/12 annual savings) + (House payment budget of $1,250/month × 12 = $15,000 less interest expense of $300,000 mortgage × 3% interest ($9,000) = $6,000 excess cash per year/12 = $500 per month).
- Periods per year = 12
- Number of months = 360
- Solving for future value = $1,757,901
The house appreciates at a rate of 2 percent per year, compounded monthly for 360 months. Table E.7 shows the Radicals' balance sheet at age 65.
Table E.7 The Radicals, Month 360 (age 65)
| Assets | Amount | Liabilities | Amount |
| Investments | $1,760,000 | ||
| Home | $550,000 | Mortgage | $300,000 |
| Total assets | $2,310,000 | Total liabilities | $300,000 |
| Net worth | $2,010,000 |
Aside from having more money by the age of 65, the Radicals had more liquidity each month for 30 years. Rainy days will happen. The Radicals have flexibility and survivability. They have $7,750 each month, which they can use to handle a curve ball the moment it's thrown at them.
The Nadas, Steadys, and Radicals in Retirement
The Chapter 1 conclusion stated, “If the Nadas don't change their spending habits, they are on track to run out of money in 18 years.”
- Present value of savings: $983,103
- Interest / Year: 6%
- Payment: $7,500 per period
- Future value = $0
- Periods per year: 12
- Solving for periods: 213 months = 17.75 years, which the chapter rounds to 18 years.
Granted, the Nadas will have a considerable amount of home equity and could consider selling their home or a reverse mortgage.
The chapter also said, “If the Steadys don't change their spending habits, they are on track to run out of money in 30 years.”
- Present value of savings: $1,255,644
- Interest / Year: 6%
- Payment: $7,500 per period
- Future value = $0
- Periods per year: 12
- Solving for periods: 363.8 months = 30.3 years, which the chapter rounds to 30 years.
Here again, the Steadys, like the Nadas, will have a considerable amount of home equity and could consider selling their home or a reverse mortgage.
Finally, the chapter said that the Radicals would have $8,750 per month in income in retirement. The actual answer is $8,789.
If the Radicals keep $1,757,901 invested at the same 6-percent return they would have monthly income of $8,789 ![]() ).
).
They would still have to make the $750 interest payment on their mortgage (![]() ). This would leave them with $8,039 per month in income, after mortgage expense.
). This would leave them with $8,039 per month in income, after mortgage expense.
From the chapter, “This is more than the $7,500 they were spending when they were working.” Remember from the assumptions, the Radicals' income was $120,000 / 12 = $10,000 per month. They were saving $15,000 per year ($1,250 per month) and making a mortgage payment of $1,250 per month. But remember that they had the option to be amortizing or interest only. All three families were living on $7,500 per month; their target living expense budget, net of mortgage, was $7,500. Therefore, the Radicals' monthly income increases during retirement.
Finally, the chapter states, “If the Radicals don't change their spending habits they are on track to have about $4.3 million when they are 105 years old.” If we assume that “don't change their spending habits” means that they continue spending $7,500 per month, then we get:
- Present value of savings: $1,757,901
- Interest / Year: 6%
- Payment: $7,500 per period
- Periods per year: 12
- Periods: 480 months = 40 years
- Solving for future value = $4,325,938
The Radicals will never need to sell their home, though they could sell or do a reverse mortgage. But why would they? Table E.8 illustrates the Radicals at age 105.
Table E.8 The Radicals, Age 105
| Assets | Amount | Liabilities | Amount |
| Investments | $4,330,000 | ||
| Home | $1,220,000 | Mortgage | $300,000 |
| Total assets | $5,550,000 | Total liabilities | $300,000 |
| Net worth | $5,250,000 |
Chapters 3 and 4: Brandon and Teresa
Remember that Brandon and Teresa are the average Americans. They have $60,000 of income, want to buy an average house, want to retire, and they want to make conservative assumptions all along the way.
The goal of this section is to show how the glide path works from beginning to end using the average household earnings, average rental rates, average home prices, the current tax code and current Social Security system, and current interest rate environment.
Assumptions:
- Income: $60,000, never changes
- The $60,000 earnings could be from two people earning $30,000 each, one earning $20,000 and one earning $40,000 or one person earning $60,000.
- Savings: 15%, which also never changes ($9,000 per year)
- Starting age: 25
- Employer match: 3% ($1,800 per year)
- No child savings expenses (that savings would be additional, as discussed in the book)
- No oppressive debt—If they have it then they would follow the guidelines to pay it off, which would simply extend the time period by the amount of time it takes them to repay the debt.
- No student debt—Here again, if they have it then they would follow the guidelines, and it would simply extend the time period by the amount of time it takes them to repay the debt.
- No inflation, but also no raises. If their raises are exactly equal to inflation, then we can remove the complexity of inflation from the equation.
- Investment rate of return of inflation plus 4 percent (Chapter 5)
- I will simplify this to a 4-percent real return.
- For the Nadas/Steadys/Radicals I assume a real return of 6 percent. In this example, I am assuming a real return of 4 percent, which is materially more conservative.
- See Chapter 5 and the Resource Guide for more information on real returns and historic probabilities.
- Rental cost: $1,2502
- Home cost of $240,000 (from the book and approximately equal to average home cost)
Table E.9 illustrates the objectives of the Launch phase. Brandon and Teresa make $60,000 or $5,000 per month.
Table E.9 Phase 1, Launch—Brandon and Teresa Starting at Zero, Age 25
| Step/Goal/Bucket | Formula | A Balanced Path | Brandon & Teresa | Gap |
| No oppressive debt (No debt at a rate over 10 percent) | 0 | $ 0 | $0 | $ 0 |
| Cash reserve, build to a one-month reserve (checking account) | Monthly income × 1 | $ 5,000 | $0 | –$ 5,000 |
| Start a retirement plan. Build to a balance of one month's income | Monthly income × 1 | $ 5,000 | $0 | –$ 5,000 |
| Continue building cash savings until you have an additional two months' reserve (savings account) | Monthly income × 2 | $10,000 | $0 | –$10,000 |
During this time their expenses look like this:

Keep in mind that they are renting so they don't have any property taxes, homeowner's association expenses, or surprise maintenance expenses. The $2,081 is their budget for food, health care, clothing, travel, and transportation.
TurboTax shows that their taxes due are likely to be $4,631. If their withholding is ![]() , then they are likely on track for a $1,799 refund.4 We won't factor this refund into our math and will assume they use it for some fun, furniture, travel, and so on.
, then they are likely on track for a $1,799 refund.4 We won't factor this refund into our math and will assume they use it for some fun, furniture, travel, and so on.
Table E.10 illustrates where they are in three years.
Table E.10 Phase 1, Launch—Brandon and Teresa, Three Years Later
| Step/Goal/Bucket | Formula | A Balanced Path | Brandon & Teresa | Gap |
| No oppressive debt (No debt at a rate over 10 percent) | 0 | $ 0 | $ 0 | $ 0 |
| Cash reserve, build to a one-month reserve (checking account) | Monthly income × 1 | $ 5,000 | $ 5,000 | $ 0 |
| Start a retirement plan. Build to a balance of one month's income | Monthly income × 1 | $ 5,000 | $13,000 | $8,000 |
| Continue building cash savings until you have an additional two months' reserve (savings account) | Monthly income × 2 | $10,000 | $15,000 | $5,000 |
Retirement is calculated: $200 per month for three years at 4 percent = $7,636 plus three employer matches for $1,800 ![]() . The total taxable savings is $550 per month for 36 months, which is $19,800. $5,000 of this is allocated to checking and the balance, $15,000 to building additional savings. From here they solidly enter the next phase: Independence. Table E.11 illustrates exiting Launch and entering Independence.
. The total taxable savings is $550 per month for 36 months, which is $19,800. $5,000 of this is allocated to checking and the balance, $15,000 to building additional savings. From here they solidly enter the next phase: Independence. Table E.11 illustrates exiting Launch and entering Independence.
Table E.11 Year 4, Starting Phase 2, Independence
| Goal/Bucket | Formula | A Balanced Path | Brandon & Teresa | Gap |
| No oppressive debt (No debt at a rate over 10 percent) | 0 | $0 | $ 0 | $ 0 |
| Cash reserve, checking account | Monthly income × 3 | $15,000 | $ 5,000 | –$10,000 |
| Cash reserve, savings account | Monthly income × 3 | $15,000 | $15,000 | $ 0 |
| Retirement investing | Monthly income × 6 | $30,000 | $13,000 | –$17,000 |
| Big life changes | Monthly income × 9 | $45,000 | $ 0 | –$45,000 |
The total of the goals is 21 months' worth of income. Currently, they have saved a little over 6 months' worth of income so they have a savings gap of 15 months. Table E.12 let's us check in with where they are in 7 years on the same path.
Retirement after seven years is calculated: $200 per month for seven years at 4 percent = $16,244 plus seven employer matches for $1,800 (compounded at the same rate, annually) = $14,216. Plus, they have the growth of the existing $13,036 for seven years = $17,154. Total retirement savings = $16,244 + $14,216 + $17,154 = $47,614.
The total taxable savings is $550 per month for 72 months, which is $39,600. $10,000 of this is allocated to checking and the balance, about $30,000, to building additional savings.
They are close to completing the phase from a dollar perspective but they have a gap in the “big life changes.” This could be problematic, as they are 35 years old and it is reasonable that they may be at a time in their life when they want to own a home. With their current savings, it would take them approximately 42 months to fill the “big life changes bucket,” which would let them build up a traditional 20 percent down payment on the average home. This is one reasonable option for them. At the same time, they may have reached a point where they would like to own a home. They may be eligible for a variety of first-time home buyer programs, which might require much less than a 20-percent down payment. Tools to understand these options are outside of the scope of this book but resources to learn more are identified in the Resource Guide.
Since many first time home buyers take advantage of low down payment solutions, Table E.13 illustrates a bridge period of five years where their resources are directed to complete the phase regardless of the timing. By this, I mean that they do the following: direct $550 per month for 60 months to cash or paying down the mortgage, and continue directing $200 per month to their retirement plan: 60 months × $550 per month = $33,000. Their gap from the glide path is $15,000, which means that they will have $18,000 excess cash ($33,000 – $15,000), which I will park in their savings account for now. To be clear, the purpose of this assumption simply lets them make a decision to buy a home at any point between 35 and 40 without overcomplicating the math.
Table E.12 Phase 2, Independence after 7 years
| Goal/Bucket | Formula | A Balanced Path | Brandon & Teresa | Gap |
| No oppressive debt (No debt at a rate over 10 percent) | 0 | $ 0 | $ 0 | $ 0 |
| Cash reserve, checking account | Monthly income × 3 | $15,000 | $15,000 | $ 0 |
| Cash reserve, savings account | Monthly income × 3 | $15,000 | $15,000 | $ 0 |
| Retirement investing | Monthly income × 6 | $30,000 | $48,000 | $18,000 |
| Big life changes | Monthly income × 9 | $45,000 | $30,000 | –$15,000 |
Table E.13 Phase 2, Independence—Buying a House, Brandon and Teresa Age 40
| Goal/Bucket | Formula | A Balanced Path | Brandon & Teresa | Gap |
| No oppressive debt (No debt at a rate over 10 percent) | 0 | $ 0 | $ 0 | $ 0 |
| Cash reserve, checking account | Monthly income × 3 | $ 15,000 | $ 15,000 | $ 0 |
| Cash reserve, savings account | Monthly income × 3 | $ 15,000 | $ 33,000 | $18,000 |
| Retirement savings | Monthly income × 6 | $ 30,000 | $ 70,000 | $40,000 |
| House equity | Monthly income × 9 | $ 45,000 | $ 45,000 | $ 0 |
| Net worth | Monthly income × 21 | $105,000 | $163,000 | $58,000 |
| Mortgage | Monthly income × 39 | ($195,000) | ($195,000) | $ 0 |
| Total assets | Monthly income × 60 | $300,000 | $358,000 | $58,000 |
Table E.14 Brandon & Teresa Approximate Balance Sheet after Home Purchase, Age 40
| Assets | Amount | Liabilities | Amount |
| Checking account | $15,000 | Oppressive Debt | $0 |
| Savings account | $33,000 | ||
| Retirement investments | $70,000 | ||
| Home | $240,000 | Mortgage | $195,000 |
| Total assets | $358,000 | Total liabilities | $195,000 |
| Net worth | $163,000 |
Retirement savings is calculated: $200 per month for five years at 4 percent = $13,260 plus five employer matches for $1,800 (compounded at the same rate, annually) = $9,749. Plus, they have the growth of the existing $47,614 for five years = $57,930. Total retirement savings = $13,260 + $9,749 + $47,614 = $70,623. Table E.14 illustrates their balance sheet after they purchase their home.
During this time their expenses look like this:

Interestingly enough, when their taxes are input into TurboTax, they remain the same, $4,631.6 There is a good chance that they perceived that there would be a tax benefit to owning a home, but in their case, it is not apparent that there is any tax benefit to them at all.7 Proper tax assumptions should be an important consideration in your rent-versus-buy decision.
It is my view that $70 per month is well short of the actual cost of depreciation and maintenance (as discussed in Appendix C). This number is derived to show a common monthly living budget (it was $2,081 and remains $2,081 with the assumption). This makes the framework more neutral on the buy versus rent debate. Now that they are homeowners, they will likely have to spend their $1,800 tax refund on keeping up the house instead of doing fun things. The potential benefit of ownership is that they may get some home appreciation over time as well.
For better or worse, I am going to assume that they enter into a 30-year fixed mortgage. This is to test if this path works using readily available, common practices. Let's assume that they hold this path for 10 years, through age 50. The guide instructs them to do the following during the Freedom phase:
- Write down your total liabilities (your total outstanding debt) = $195,000
- Divide this number by 8 = $24,375 (rounded to $24,000)
Table E.15 shows us what their life would look like at age 50.
Table E.15 Phase 3, Freedom Worksheet—Brandon and Teresa Debt Based at Age 50
| Goal/Bucket | Formula | A Balanced Path | Brandon & Teresa | Gap |
| No oppressive debt (No debt at a rate over 10 percent) | 0 | $ 0 | $ 0 | $ 0 |
| Cash reserve, checking + savings | Base unit × 1 | $ 24,000 | $ 24,000 | $ 0 |
| Other (jewelry, cars, furniture) | Base unit × 1 | $ 24,000 | $ 15,000 | –$ 9,000 |
| Long-term investments (after-tax) | Base unit × 3 | $ 72,000 | $116,000 | $ 44,000 |
| Retirement savings | Base unit × 5 | $120,000 | $156,000 | $ 36,000 |
| Total debt (mortgage) | Base unit × 8 | ($195,000) | ($155,000) | $ 40,000 |
| Net worth | Base unit × 13 | $317,000 | $421,000 | $104,000 |
| Total assets | Base unit × 21 | $512,000 | $576,000 | $ 64,000 |
During the Freedom phase, Brandon and Teresa begin to build up their long-term investments. Their cash was at $48,000 and the glide path suggests $24,000 will be sufficient. They begin an investment account with $24,000 and add $550 per month at 4 percent for 120 months. This grows to $116,767. Retirement savings would be calculated as follows: $200 per month for 10 years at 4 percent = $29,450 plus 10 employer matches for $1,800 (compounded at the same rate, annually) = $21,611. Plus, they have the growth of the existing $70,263 for five years = $104,539. Total retirement savings = $29,450 + $21,611 + $104,539 = $155,600. The value of the home is unknown, but if we assume appreciation of inflation plus 1 percent, the home is worth $265,229. Table E.16 illustrates their balance sheet at age 50.
Table E.16 Brandon and Teresa Balance Sheet at 50 Years Old
| Assets | Amount | Liabilities | Amount |
| Checking account | $24,000 | Oppressive debt | $0 |
| Other (personal items) | $15,000 | ||
| Long-term investments | $116,000 | ||
| Retirement investments | $156,000 | ||
| Home | $265,000 | Mortgage | $155,000 |
| Total assets | $576,000 | Total liabilities | $155,000 |
| Net worth | $421,000 |
Now that they are 50, Brandon and Teresa solidly moved into Equilibrium and continue doing the same thing for the next 17 years. Table E.17 gives us a picture of where they end up at age 67.
Table E.17 Phase 4, Equilibrium Worksheet for Brandon and Teresa at age 67
| Goal/Bucket | Formula | A Balanced Path | Brandon & Teresa | Gap |
| No oppressive debt (No debt at a rate over 10 percent) | 0 | $ 0 | $ 0 | $ 0 |
| Approximate cash reserve (checking + savings) | Monthly income × 7 | $ 35,000 | $ 24,000 | –$ 11,000 |
| Approximate other (jewelry, cars, furniture) | Monthly income × 7 | $ 35,000 | $ 15,000 | –$ 20,000 |
| Approximate mortgage | Monthly income × 35 | ($195,000) | ($ 43,000) | $152,000 |
| Approximate long-term investments (after-tax) | Monthly income × 56 | $280,000 | $287,000 | $ 7,000 |
| Approximate retirement savings | Monthly income × 91 | $455,000 | $510,000 | $ 55,000 |
| Approximate total investment assets | Monthly income × 147 | $735,000 | $797,000 | $ 62,000 |
Brandon and Teresa continue building up their long-term investments; however, now they shift their savings $200 a month to long-term investments and $550 a month to their retirement savings. Their existing assets of $116,000 + $200 per month at 4 percent for 204 months grows to $287,009.
Retirement savings would be calculated as follows: $550 per month for 204 months at 4 percent plus the growth of the existing $156,000 = $467,899. Plus 17 employer matches for $1,800 (compounded at the same rate, annually) = $42,655. Total retirement savings = $467,899 + $42,655 = $510,554.
How do they look in retirement? If their investment assets of about $800,000 generate the same 4 percent return, then they will have $32,000 per year of income. Their Social Security is estimated to be $30,000 per year.8 Total income is $62,000. They just got a significant raise in retirement. Importantly, they no longer need to save, so they can increase their monthly expenditures by what they were saving.
If their home is worth more than $250,000 (what they paid for it 30 years earlier), they are now millionaires! Look what else happens with their debt. Yes, they retired with a mortgage but they are able to cover the payment. In three years they will own their house outright, leading to yet another raise. Or better yet, they have the money in the bank to be able to pay it off now. I would be 100 percent comfortable with them selling down from their investments on the day they retire and paying off the mortgage. This would lead to a significant increase in their cash flow.
Testing the Assumptions
We took the average American, with an average income, average housing prices, and average rental rates, used conservative assumptions and turned them into millionaires using the power of debt.
One assumption that might strike you as conservative is that I assume that they will have a real return of inflation plus 4 percent. Often times, I refer to inflation plus 5 percent as a distribution rate. The difference between 4 and 5 percent is simply a level of confidence. Four percent is a more conservative assumption. This is based on my research and the reasons I identified in Chapter 5. For what it is worth, state and local government retirement systems hold assets of $3.56 trillion and they assume an average real return of 4.6 percent. So while the figure is conservative, the range of 4 to 5 percent is in line with the assumptions used by most state and local governments.9 If your returns are higher, this will be much better, decreasing the age at which they can comfortably retire.
Also, I assume that you are going to live well past 100 years old. This may or may not be an assumption you want to make. If you want to assume a shorter life expectancy, you could retire earlier.
Another assumption that might not sit well is that the savings rate might seem high. Well, even with these assumptions, their after-tax, after-savings income is higher than 40 percent of American households' gross income.10 So if you can't live within these assumptions, I think it is a good time to reflect on where you are in life.
What about children and other expenses? To keep the illustration simple, I excluded children. Obviously, many of the 40 percent of American households that have lower incomes do have children so it is possible to raise them within this budget. With this income there is a good chance of being eligible for grants and student aid. However, let's say that expenses from children totaled $150,000 over their lifetime. Depending on timing, mathematically this would be similar to not having paid down the mortgage, which pulls it back to the example in the chapter. Their income would still be sufficient to cover their mortgage in retirement and they would still have a raise in retirement. Further, they are still on track to retire early. They could easily work through age 70, which would increase their Social Security payment and the value of their portfolio.
Higher Income
If your household income is $60,000 the glide path outlined is powerful. Let's look at what happens if your income is higher, say dual income with $240,000 of income. Let's look at a couple, Ryan and Allison.
- Income: $240,000
- Savings: 15%
- Starting age: 35
- Employer match: 3%
- Rate of return: Inflation + 4%
- Cost of mortgage debt: Inflation + 2%
- Cost of student debt: Inflation + 4%
- Home appreciation: Inflation + 1%
- Wage increases: Inflation
- Payment structure: Interest only, they never make a principal payment
- Property taxes: $15,000 (1.5% of $900,000)
- Home price: $1,000,000
Further, I am going to introduce inflation into the equation to illustrate the power of capturing a spread over time. I am going to hold inflation at 2 percent. This implies that borrowing costs will be 4 percent and investment returns will be 6 percent and housing appreciation will be 3 percent. To simplify the number of moving pieces I will not apply inflation to wages or savings. We will start at age 35.
Let's intercept them in the Independence phase where their net worth is between 50 percent and two times their annual income. Table E.18 shows general assumptions based on the mid-30s, large urban professional crowd. They bought an expensive place (but they consider it to be reasonable based on their market) and took advantage of a low-down-payment solution. They have some cash, but not much relative to their income, and most of their money is tied up in their home. They are ahead on their retirement savings versus the guideline because they directed a lot of their early savings to that bucket.
Table E.18 Phase 2, Independence—Dual Income Ryan and Allison, Age 35
| Goal/Bucket | Formula | A Balanced Path | Ryan & Allison | Gap |
| No oppressive debt (No debt at a rate over 10 percent) | 0 | $ 0 | $ 0 | $ 0 |
| Cash reserve, checking account | Monthly income × 3 | $ 60,000 | $ 25,000 | –$ 35,000 |
| Cash reserve, savings account | Monthly income × 3 | $ 60,000 | $ 15,000 | –$ 45,000 |
| Retirement savings | Monthly income × 6 | $ 120,000 | $ 160,000 | $ 40,000 |
| House equity | Monthly income × 9 | $ 180,000 | $ 100,000 | –$ 80,000 |
| Net worth | Monthly income × 21 | $ 420,000 | $ 270,000 | –$150,000 |
| Mortgage | Monthly income × 39 | ($ 780,000) | ($ 900,000) | ($120,000) |
| Total assets | Monthly income × 60 | $1,200,000 | $1,200,000 | $ 0 |
The glide path does not include student debt, so Table E.19 reflects the above information plus $30,000 of student debt.
Table E.19 Ryan and Allison Balance Sheet at Age 35
| Assets | Amount | Liabilities | Amount |
| Checking account | $25,000 | Oppressive debt | $0 |
| Savings account | $15,000 | Student debt | $30,000 |
| Retirement investments | $160,000 | ||
| Home | $1,000,000 | Mortgage | $900,000 |
| Total assets | $1,200,000 | Total liabilities | $930,000 |
| Net worth | $ 270,000 |
Let's test the glide path. During this time, their expenses look like this:
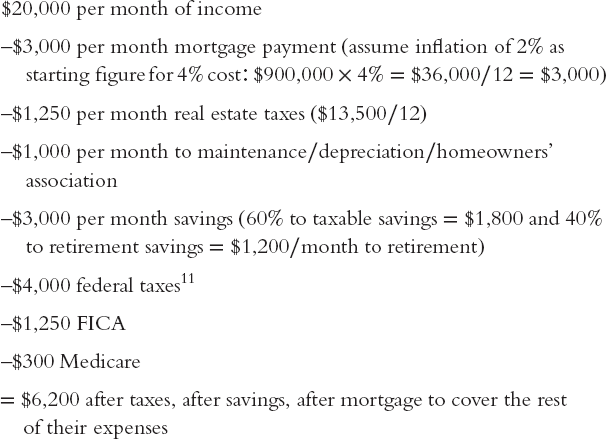
When their taxes are input into TurboTax, they receive a $15,000 refund.12 I will exclude this refund from the math for “wiggle room” (child-related expenses, state taxes, additional income, etc.). Here it is possible that the tax benefits to owning a home might in fact be bigger than they would estimate if they did not do the math. Due to their high income, in many markets this may impact the rent versus buy math considerably.
Let's assume that they pay down zero on their mortgage, they just make interest payments, and that they direct their $1,800 per month of savings to $600 per month to student debt and $1,200 per month to building up their checking and savings.
Let's assume that they hold this path for five years, through age 40. The guide instructs to take your debt and divide it by 8. Remember that Brandon and Teresa's debt was too high, therefore for Ryan and Allison, I am going to use what their debt should be, as suggested in the glide path, rather than what it is. The Independence phase suggested a balanced amount of $780,000 (which we will round to $800,000) and use that as the target.
- Write down your total liabilities (your total outstanding debt) = $800,000
- Divide this number by 8 = $100,000
The $1,200 per month of savings for 60 months at 2 percent (inflation) would grow to $75,000. (They are building up cash so there is little return.) The $600 per month for five years would pay off their student debt over the five years ($575 per month at 6 percent pays off $30,000 in 60 months).
Retirement savings would be calculated as follows: $1,200 per month for five years at 6 percent = $83,724 plus five employer matches of $7,200 (compounded at the same rate, annually) = $40,587. Plus, they have the growth of the existing $160,000 for five years = $214,116. Total retirement savings = $83,724 + $40,487 + $214,116 = $338,327, rounded to $340,000. Table E.20 shows us what their life would look like at age 40.
Table E.20 Phase 3, Freedom Worksheet—Ryan and Allison at Age 40
| Goal/Bucket | Formula | A Balanced Path | Ryan & Allison | Gap |
| No oppressive debt (No debt at a rate over 10 percent) | 0 | $ 0 | $ 0 | $ 0 |
| Cash reserve, checking + savings | Base unit × 1 | $ 100,000 | $ 115,000 | $ 15,000 |
| Other (jewelry, cars, furniture) | Base unit × 1 | $ 100,000 | $ 30,000 | –$ 70,000 |
| Long-term investments (after-tax) | Base unit × 3 | $ 300,000 | $ 0 | –$300,000 |
| Retirement savings | Base unit × 5 | $ 500,000 | $ 340,000 | –$160,000 |
| Total debt (mortgage) | Base unit × 8 | ($ 800,000) | ($ 900,000) | ($100,000) |
| Net worth | Base unit × 13 | $1,300,000 | $ 744,000 | –$556,000 |
| Total assets | Base unit × 21 | $2,100,000 | $1,644,000 | –$456,000 |
A few powerful changes have taken place in their life. First, they have $115,000 in the bank. They can ride out most any storm that life sends them. Keep in mind that while their income is $20,000 per month, they are living on $12,000 ($5,000 is going to taxes and $3,000 to savings). This means that the $115,000 reserve could get them through about 10 months of crisis, and that is with no changes to their lifestyle! They can move, change jobs, and should feel very little financial anxiety about the short term.
They built up some assets in cars and things (but it is a big part of the overall picture). They have eliminated their student debt but kept their mortgage. Their home appreciated a little so they now have $250,000 of home equity. Their retirement savings increased over twofold! This is the power of a base of assets plus savings. In fact, even though they only paid down a little bit of debt, Table E.21 shows their net worth increased over twofold as well in that five-year period.
Table E.21 Approximate Balance Sheet at Age 40
| Assets | Amount | Liabilities | Amount |
| Checking account | $115,000 | Oppressive debt | $0 |
| Other (Jewelry/cars) | $30,000 | Student debt | $0 |
| Long-term investments | $0 | ||
| Retirement investments | $340,000 | ||
| Home | $1,159,000 | Mortgage | $900,000 |
| Total assets | $1,644,000 | Total liabilities | $900,000 |
| Net worth | $ 744,000 |
While they should be feeling good about the short term, how does the long term look? The beacons are flashing brightest to build up their long-term investments and to build up their retirement investments. Since their debt ratio will fall as they build up assets, and since they like the tax benefits from debt, we will direct their investing and leave their debt constant. They know that they can always pay down debt anytime so they decide to focus first on building assets and to pay down debt later. They no longer have the cost of student debt. They calculate that they should be splitting their total savings 50/50 between retirement and long-term investments or $1,500 per month to each bucket.
Currently, they don't have an investment account so they decide to begin one with $40,000 from cash (leaving them with $75,000 in cash) and to save $1,500 per month to build up this bucket. The $40,000 plus $1,800 per month of savings for 27 years (324 months) would grow to $1,411,129, which I will round to $1.4 million.
Retirement savings would be calculated as follows: Existing assets of $340,000 plus $1,500 per month for 27 years at 6 percent = $2,920,950. They also have 27 employer matches of $7,200 (compounded at the same rate, annually) = $458,681. Total retirement savings = $2,920,950 + $458,681 = $3,379,631, which I will round to $3.4 million.
The house at 3-percent appreciation for 32 years would be worth about $2.575 million, which I round to $2.5 million. If cash grows at inflation, $75,000 would grow to $128,000, which I rounded to $125,000. “Other/stuff” does not impact the exercise and is just an estimate of their things. Table E.22 shows Ryan and Allison compared to the Equilibrium glide path at age 67 and Table E.23 illustrates their balance sheet at the same age.
Table E.22 Equilibrium Worksheet for Ryan and Allison at age 67
| Goal/Bucket | Formula | A Balanced Path | Ryan & Allison | Gap |
| No oppressive debt (No debt at a rate over 10 percent) | 0 | $ 0 | $ 0 | $ 0 |
| Approximate cash reserve (checking + savings) | Monthly income × 7 | $ 140,000 | $ 125,000 | –$ 15,000 |
| Approximate other (jewelry, cars, furniture) | Monthly income × 7 | $ 140,000 | $ 100,000 | –$ 40,000 |
| Approximate mortgage | Monthly income × 35 | ($ 700,000) | ($ 900,000) | ($ 200,000) |
| Approximate long-term investments (after-tax) | Monthly income × 56 | $1,120,000 | $1,400,000 | $ 280,000 |
| Approximate retirement savings | Monthly income × 91 | $1,820,000 | $3,400,000 | $1,580,000 |
| Approximate total investment assets | Monthly income × 147 | $2,940,000 | $4,800,000 | $1,860,000 |
Table E.23 Approximate Balance Sheet for Ryan and Allison at Age 67
| Assets | Amount | Liabilities | Amount |
| Checking account | $125,000 | Oppressive debt | $0 |
| Other (Jewelry/cars) | $100,000 | Student debt | $0 |
| Long-term investments | $1,400,000 | ||
| Retirement investments | $3,400,000 | ||
| Home | $2,500,000 | Mortgage | $900,000 |
| Total assets | $7,525,000 | Total liabilities | $900,000 |
| Net worth | $6,625,000 |
Let's look at income in retirement. (The following is a brief highlight from the themes of the book The Value of Debt in Retirement, so for a comprehensive understanding I would refer you to that material.)
- Their investment assets are $4,800,000.
- A 6-percent return is $288,000 or $24,000 per month.
- Taxes would only be $5,000 per year, or $416 per month.13
- The mortgage would still be $36,000 or $3,000 per month.
- This would leave them with about $20,000 after taxes and mortgage.
What about their living expenses? They were spending $6,200 per month, about $8,500 including taxes and depreciation on the home. $8,500 at 2 percent for 27 years would be about $15,000 in future dollars. Even if their lifestyle does not scale back they have excess funds.
Importantly, Ryan and Allison have five secret weapons:
- 1. Social Security: At age 70, their Social Security benefit is estimated to be at $5,272 per month, or $63,273 per year. This would be excess income.14
- 2. The ability to downsize: They could move from their house to a $1.2 million property (the equivalent of about $500,000 in today's dollars) and own it outright and have no mortgage expense.
- 3. The ability to work longer: If things are not on track, they can work until 70, or beyond. Each year they work, they also have one less year of life expectancy.
- 4. The ability to pay off their debt: Any day they don't like this strategy, they can simply pay off their debt.
- 5. The ability to borrow more money: They can borrow against their house and they can borrow against their portfolio. They may not need to do this, but it gives them tremendous flexibility.
And herein lies the point: Any way you cut it, they are solidly on track for retirement. Ryan and Allison are a liquid, flexible force that is well on track for retirement by embracing the L.I.F.E. glide path. It may very well turn out that in their 50s they decide to pay off or pay down their house. However, until you break through the Equilibrium phase, if your after-tax cost of debt is less than your expected return on your portfolio, I would generally suggest not paying down any of your debt until you can pay down all of your debt. That is The Value of Debt in Building Wealth.15