Key to troubleshooting any problem is information; if we do not have good information, how are we going to figure out what went wrong? We have all seen those comedy error messages that say something like an error has occurred and they just do not help the situation. Fortunately for us, Configuration Manager has really good status and error logging, which, for people who are new to the product, can often be off putting due to the level of detail. Even though the amount and level of detail of the log files can sometimes be overwhelming, it really is a matter of learning to read them and picking out that key piece of information that unlocks the mystery of the enigma. So with this in mind, this chapter sets out to help us in understanding the monitoring workspace in the Configuration Manager console and the log files, where they are, which one to use, and what they contain.
In Configuration Manager there are three levels of status checking on a sliding scale: from overview to part-detail and then finally detailed. The overview parts are the visual indicators in the console that consist of pie charts or high-level indicators that show distribution status, deployment status, and so on. The part-detailed are status message queries and the detailed are the log files. First of all, we are going to look at the monitoring workspace and see what we can use in there to help us with our troubleshooting.
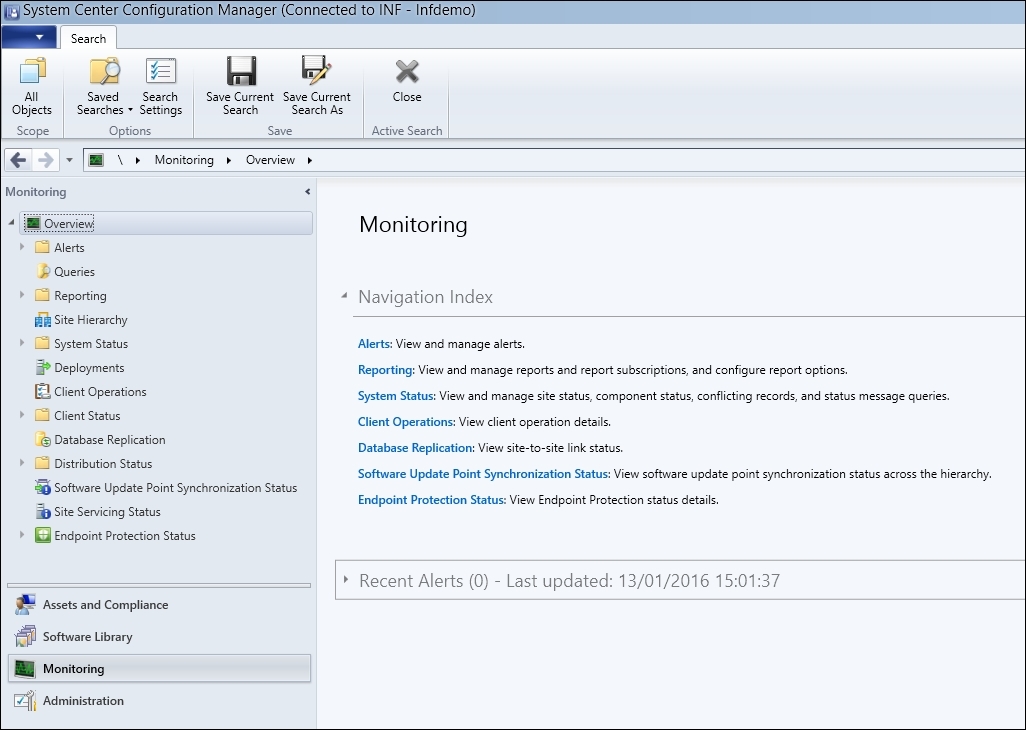
While working from top to bottom in the monitoring workspace, the first thing we come across is Alerts. This can give us easy wins to common problems and, even better, we can set up e-mail subscriptions to notify us without being in the console.
The alerts that are generated in this area of the console do not apply to every component of Configuration Manager, but still it is a quick hit to see if anything obvious has happened. If we look at the SQL database behind Configuration Manager, we can see in the dbo.AlertClass table from Configuration Manager current branch that the types of alert classes are limited and each one has a predefined severity. The messages that we will see in the console will be more descriptive and specific to our implementation, but this gives us an idea of the types of alerts we are likely to get.
|
Name |
Severity |
|---|---|
|
Apns expiration alert |
1 |
|
Apple vpp token expiration alert |
1 |
|
1 | |
|
Cloud dp storage critical |
1 |
|
Cloud dp traffic out critical |
1 |
|
Database replication DLL loading error |
1 |
|
Database replication link connectivity |
1 |
|
Database replication message process rate critical |
1 |
|
Database replication message transaction queue critical |
1 |
|
Dcm compliance |
1 |
|
Deployment compliance |
1 |
|
Exchange connector |
1 |
|
Malware detection |
1 |
|
Malware outbreak |
1 |
|
Migration job failure |
1 |
|
Migration sync failure |
1 |
|
Multiple malware detection |
1 |
|
Osd-task sequences error exceeds threshold |
1 |
|
Osd-task sequences success below threshold |
1 |
|
Repeated malware detection |
1 |
|
Rule failure |
1 |
|
Site backup task failure |
1 |
|
Site role unhealthy |
1 |
|
Site system database free space critical |
1 |
|
Software updates sync failure |
1 |
|
Sum-compliance1 update deployment success below threshold |
1 |
|
Sum-compliance2 update group deployment success below threshold |
1 |
|
Swd-app error exceeds threshold |
1 |
|
Swd-app success below threshold |
1 |
|
Cloud dp storage warning |
2 |
|
Cloud dp traffic out warning |
2 |
|
Collection membership |
2 |
|
Database replication message process rate warning |
2 |
|
Database replication message transaction queue warning |
2 |
|
MDM_lowlicensekeys |
2 |
|
Migration amt warning |
2 |
|
Migration dp fqdn warning |
2 |
|
Site system database free space warning |
2 |
|
Symantec cert expiration alert |
2 |
|
Client activity warning |
3 |
|
Client health sla |
3 |
|
Client remediation warning |
3 |
|
3 | |
|
Synthetic alert |
3 |
|
Synthetic alert above double threshold |
3 |
|
Synthetic alert above simple threshold |
3 |
|
Synthetic alert below double threshold |
3 |
|
Synthetic alert below simple threshold |
3 |
|
Synthetic alert2 |
3 |
As we can see from the preceding alert names, there are a variety of components covered and each is evaluated by a whole host of SQL stored procedures that run behind the scenes. Do not be tempted to modify these stored procedures or tables at all; we are simply demonstrating that the views we see in the console are often reflective of a SQL table or view.
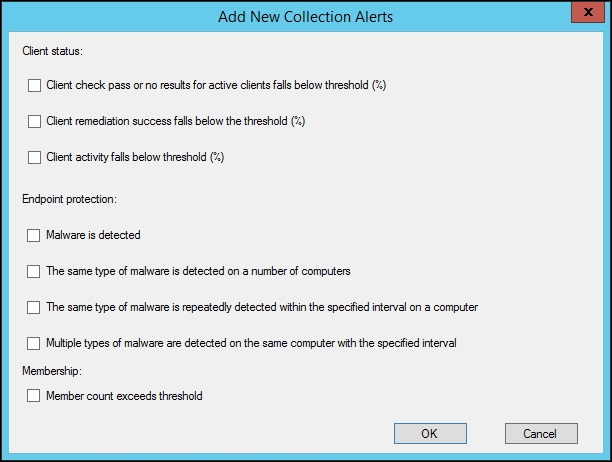
We can configure which alerts we would like to trigger in different places throughout the console; the key is to look for an alerts tab on the component properties. We can configure these in the site properties, on the management point properties, deployments, migrations, collection properties, and on anywhere else related to the aforementioned classes. If we want to configure alerts for clients in a specific device collection, we can go to the Alerts tab in the properties of the collection and click on Add, and we will see the various alerting options available to us, as shown in the following screenshot:
In terms of understanding these alerts, they are quite high level and in plain language, so they should give us an immediate steer as to where the problem lies. We can then take this steer and move forward to something like system status.
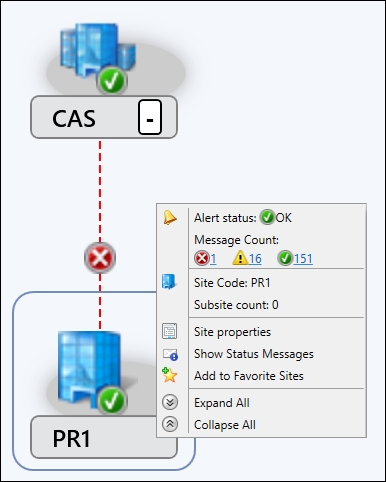
In the system status section of the monitoring workspace, we have site status, component status, conflicting records, and status message queries. We will cover each area and how to use them in more detail when we look at the individual components. We are not going to cover the site hierarchy in any detail as it essentially gives us just a diagrammatical view of our site hierarchy. If, like the majority of implementations, you have a single site hierarchy, then this will be somewhat underwhelming as it will contain only a single server. If we right-click on the server, however, we will see a nice summary of the site status message with a hyperlink to drop us into the relevant view.
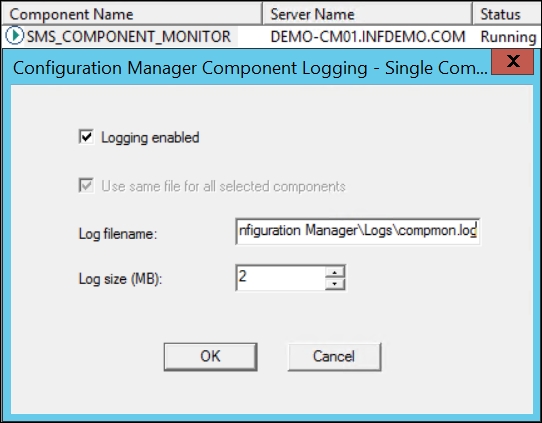
Moving further down the console under this section, we see the site status view that lists all the servers and server roles in our site along with a nice Error, Warning, or OK icon for each role. If you right-click on these or hit the ribbon you can view the relevant messages for that role and also start the Configuration Manager Service Manager. The Service Manager allows you to query the status of all components in the site and also components for a specific server, and, if required, we can easily restart individual components. Be careful while doing this, though, as we don't want to create unnecessary downtime when we are troubleshooting minor issues, and try to find out the root cause before getting click happy. There is an added treat in the Configuration Manager Service Manager in that you can browse through to the individual components, right-click, and hit logging. In here you can see the name of the log file for that specific component and amend the size of the log. This can be extremely helpful in some circumstances where log files are flushed before you had the chance to read that nugget of information. By default, log files are a maximum 2 MB, and when the file reaches that size, it is automatically stored with the .lo_ extension and the same file name, as shown in the following screenshot:
In the Component Status view, we see much of the same, but now we move into a more detailed view down to each individual component within our Configuration Manager site. In this view, the same applies again where we can drill down into the messages by type, and if we believe we have resolved the issue, we can reset the component to a healthy state by resetting the error count from here. It is worth noting at this point that we can amend the thresholds for each of the components by browsing to Administration | Overview | Site Configuration | Sites. Now we can right-click or go to the ribbon and hit Status Summarizers. In here we see listed the Component Status Summarizer, which we can edit, and amend thresholds for various components as appropriate for our environment. This can be very useful if you are experiencing re-occurring problems on a component as we can set the threshold low and pick up on the problem sooner. It should be noted that by default the thresholds reset at midnight, so any status seen in the console is since 00:00.
Note
When troubleshooting, it is important that we reset the counts for the relevant role or component each time we make a change. This will help us see what status messages are being produced without all the noise from old messages. If the problem persists, then the status message will appear again.
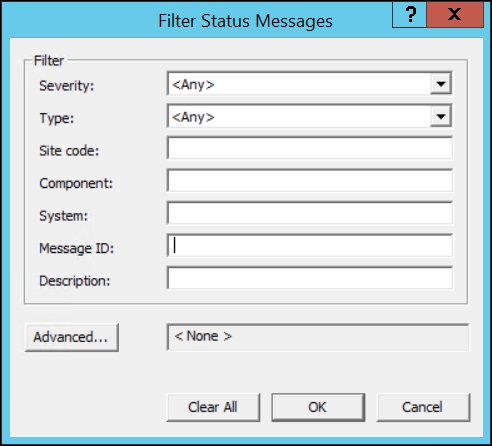
We may notice that when we drill down to message types, we are asked to choose a time period and we are presented with a separate window for the status message viewer. Alternatively, we can go straight into the status message queries view in the monitoring workspace. In here we can view what could be classed as the mid-level detail for troubleshooting. To make life easier, there are also a number of preconfigured queries to help us filter out the noise or simply messages that are not relevant to our situation. We can see these by going into the properties of each query and editing the query statement. Equally, we can create our own status message query by using Create Status Message Query from the ribbon and entering our own query or a modified version of another. In the status message viewer, we should pay particular attention to the filter symbol.
This allows us to further filter out any unwanted noise and concentrate on specific components, systems, or messages among other things.
In here we will see status messages that give us some detail into what went wrong. It goes without saying that we would want to take a look at the warning and error messages but also don't forget to align a time against the issue you are troubleshooting. It can be common that people are drawn toward an error while ignoring the time stamp and using that as an explanation only to discover later that it was a red herring. Sometimes the messages in here can become a little cryptic, and this is also on a sliding scale in parallel to the level of detail. With detail often comes confusing messages that need some de-obfuscation before we can understand what it is telling us. To an extent, this comes with practice, but we often find on various IT community based websites that people are sharing their errors and explanations. Unfortunately Microsoft don't always publish a full list of error codes and their true meanings. We will look into specific examples of errors in later chapters, but for now we should be familiar with the tools and what kind of information we are going to get from them.
You may have noticed that we have skipped Conflicting Records. We will cover it in a later chapter, but essentially this shows us a list of any conflicting client records where we can manually resolve them if required. We will also take this opportunity to mention the various chart views throughout the console, particularly in the monitoring workspace but also elsewhere such as in the software library. These give us another at-a-glance view of the success of a deployment, distribution, client status, endpoint protection status, and so on. These are particularly useful for the novice Configuration Manager administrator and can also be included in security scopes so that basic checks can be performed before escalating a problem.