
CHAPTER 10
Modeling an Object's Lifecycle in UML 1.4
![]()
In This Chapter
- Modeling state and events
- Modeling events and transitions
- Modeling time and change events
- Modeling guard conditions
- Specifying entry and exit action
- Specifying internal transitions
- Modeling send events and self-transitions
- Modeling compound transitions and factored paths
- Deriving a Statechart from Sequence diagrams
- Modeling composite and concurrent states
- Modeling split and merge of control and sync states
![]()
As objects participate in the behavior of a system they can be affected by the behavior. For example, when I use my car to drive to work, the tires wear out and the car accumulates miles. The condition of the car is constantly changing while it is being used. Changes in the condition of the car can affect how the car behaves. As the tires wear down the car handles less effectively in turns and while stopping than it did when the tires were new. When the gas tank is empty turning the ignition key fails to get the usual response. The same use of the object (turning the key) results in a very different result because of a change in the state of the object.
The Statechart diagram defines a notation for state machines. State machines capture the changes in an object throughout its lifecycle in response to external events. Events place demands on an object. The demands can cause changes in the object that in turn affect how the object behaves. The Statechart diagram models the unique conditions of an object at distinct periods in its lifecycle and the events that trigger the changes.
Where the interaction UML diagrams focus on discrete behaviors, the Statechart provides a holistic view of everything that could possibly happen to an object throughout its lifetime. This chapter describes how to model a Statechart diagram and how to exploit the relationship between the Sequence and Statechart diagrams to facilitate the development of the Statechart diagram.
Modeling a Statechart Diagram
So far you have seen the dynamic view represented by the Sequence and Collaboration diagrams. Both of these diagrams model the interactions between objects. The Statechart diagram models the effect that these interactions have on the internal makeup of each object. The messages modeled in interaction diagrams are the external events place demands on objects. The objects' internal responses to these events cause the changes to the objects' states. Drawing on the relationship between the messages on the interaction diagram and the events that trigger changes in an object, we can derive a Statechart diagram from the interactions on a Sequence diagram.
The relationship between interactions and events that cause state changes can also help us identify the objects that warrant a Statechart. Frankly, very few objects need to be modeled at this level. Many objects are simply created, referenced, and later deleted. But in many applications there are a few fundamental objects that are the focus of the application. For example, in theater system a price type is defined, used, and sometimes deleted. All these changes are performed by a venue manager and are pretty straightforward. The seats at a show (show seats), however, are created when a performance is schedule, priced by a venue manager, selected by customers (or by agents on behalf f customers) interested in buying them, released when the customer decides not to go through with the transaction, purchased, and possibly refunded. With each change to the seats the rules change regarding what can be done with the seat. If a seat is held by one customer, it cannot be selected by another customer. If a seat is not yet priced, then it can't even be selected.
The price type does not warrant a Statechart. A seat at a show does warrant a Statechart. I know this because I know the problem. But how could you discover this by evaluating my models? When you review the Sequence diagrams you would see the show seats in many of the Sequence diagrams. In each Sequence diagram you would see a number of arrows (messages) directed at the show seats. Every arrow places a demand on the show seat object. That demand could trigger a change. The objects that appear in many of the interactions and are the target of many of the interactions are good candidates for a Statechart diagram. I call it looking for the “most wounded objects,” that is, looking for the objects with the most incoming arrows.
The Statechart diagram is based on David Harel's Statecharts and includes much of the notation and concepts from both Moore and Mealy state machines that have been in use for quite some time. This emphasizes again that UML is not so much a new concept as it is the gathering together of many tried and true modeling techniques from mature development methods.
 The concepts modeled by a Statechart diagram have been around a long time, in other diagrams such as the State diagram, state machine, and state transition diagram.
Each Statechart diagram describes the life of one object in terms of the events that trigger changes in the object's state. The Statechart diagram identifies both the external events and internal events that can change the object's state. But what does it mean to change an object's state? The state of an object is simply its current condition. That condition is reflected in the values of the attributes that describe the object. Behaviors in the system alter those attribute values, thus redefining, or changing, the object's state.
Earlier in the book, I suggested that you notice how parts of speech reflect model elements. A state describes an object, so it typically appears as an adjective or gerund (present participle of a verb used as an adjective) in the problem description; for example, a checking account is open (an open account) or a performance that is playing (a currently playing performance).
Changes in the condition of an object can dictate changes in its behavior. For example, when the current condition/state of a checking account is overdrawn, the checking account responds in a different manner than when the checking account has a credit balance, that is, checks are rejected rather than paid, or the bank might cover the check and charge you an exorbitant fee for its kindness.
Contrast the scope of the Statechart with that of the Sequence diagram. The scope of the Statechart is the entire life of one object. The scope of the Sequence diagram is typically a single scenario or behavior, such as an operation or workflow, and may involve any number of objects. Consequently, it is possible to derive a Statechart from the set of Sequence diagrams that use the object in question. I discuss this in the “Deriving a Statechart from Sequence diagrams” section later in this chapter.
The Statechart models the events that trigger a transition (change) from one state to another state. An event corresponds to a message sent to the object asking or telling it to do something. That something is called an action, or more accurately an action expression. Actions alter the object's attribute values, redefining the object's state. Note that not all messages imply an action that alters the object. A message such as getName(), for example, makes no change to the object so it would appear as an internal transition. The name is a bit misleading, given the definition of a transition. “Internal event” might have been more accurate, but…
While an object is in a state, it may also perform work associated with that state. Such work is called an activity and does not alter the state of the object. For example, while a performance is open, it might keep track of the seats sold.
The Statechart can also aggregate states into superstates, providing a higher-level view of the transitions in the life of an object. The states thus aggregated then become substates of the superstate. Substates may also represent concurrent behaviors within a state by creating parallel substates within a superstate. Using the substate and superstate notation, you can explicitly identify split and merge (synchronization) of control for concurrency, as you'll see later in this chapter.
State attributes
Although not explicitly defined by UML 1.4, state attributes are a common addition to a state definition. State attributes are features that only apply to the object while the object is in the named state. These attributes are initialized on entry to the state, and are deleted upon exit from the state.
For example, an object might set a timer to keep track of how long it has been in the state. If a specified time limit is exceeded, the object automatically resets itself to the previous state. In another example, while a login screen is in the state of receiving input of the username and password, it might keep track of the number of unsuccessful attempts. If the number of attempts exceeds the security threshold, the screen locks and displays an appropriate message.
Modeling object states and events
The foundation for the Statechart is the relationship between states and events. The examples in this section illustrate the Statechart notation using a Seat object from the theater system. A simple state (or regular state) is modeled as a rounded rectangle with the state name inside. The name may also appear in a tab attached to the top edge of the state icon. Figure 10-1 shows both models. The icon on the left is by far the most common, so I will use it throughout the rest of the book.
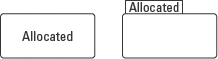
Figure 10-1: State icon with the name compartment shown (minimum configuration).
In addition to simple states, the UML defines two special states: the initial state and the final state. Each has its own unique notation. The initial state of an object is modeled as a solid dot with an arrow pointing to the first state, as shown in Figure 10-2. It is referred to as a pseudo state because it does not really have all the features of an actual state but it helps clarify the unique purpose of another state on the diagram. The initial state identifies (points to) the state in which an object is created, or constructed. For example, Figure 10-2 says that a seat is created in the Allocated state. In other words, the seat comes into existence within the system when a Venue Manager informs the system that it has been allocated to the floor plan.
![]()
Figure 10-2: Initial state notation.
Technically the initial state is just the dot. However, in practice, the phrase initial state refers to the entire image shown in Figure 10-2: the dot, the arrow, and the state icon, as if to say, “Start at the dot and follow the arrow to the initial state, called Allocated”.
At the end of its life an object may reach a final state from which it may never leave. The final state is a subclass of state. So it has all the properties of a state, with one exception: it cannot have any outgoing arrows (transitions). In other words, once the object reaches this state it can never transition to another state. A final state is modeled as a bull's-eye, a dot within a circle. The name of the final state is placed next to the final state icon. A common usage is illustrated in Figure 10-3. Let's say we're modeling the state of a seat. According to the Statechart diagram notation in this figure, the seat may be removed while it is in either the enabled state or the disabled state. This is illustrated by the arrows from each of the two states, and directed toward the final state. (These arrows will be explained in the next section.) But once the seat is in the Removed state, you may never change it (according to this diagram).
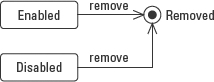
Figure 10-3: Final state notation.
In this example, the object still exists but it is frozen in a query-only state. You can access it, report on it, and interrogate any of its attributes. You just can't change its state. In this sense, it is like archiving something. But the final state may also mean that the object has actually been deleted and can no longer be accessed. However, information in a system is a valuable asset, so it is rare that a system literally deletes data. It is equally rare to see the final state on a Statechart diagram. Often, even if an object is flagged as deleted or archived, the system will likely provide the option to undo the deletion or archive to recover from an error or simply to change your mind. In this situation, the deleted or archived state would be a simple state, modeled as a rounded rectangle.
Modeling events
An event is a trigger that evokes a response in the form of one or more behaviors. An event on a Statechart diagram corresponds to a message on a Sequence diagram. For example, in Figure 8-9, step 6, the SelectShowSeat object sends a select() message to the ShowSeat object. Receiving the select() message is an event that triggers a state change in the ShowSeat from the Unsold state to the Sold state.
- The receipt of a signal, such as receiving an exception or a notice to cancel an action
- The receipt of a call, that is, the invocation of an operation, such as pricing a seat or rescheduling a performance
An event may also be the recognition of some condition in the environment or within the object itself such as
- A predefined condition becoming true, called a change event. For example, when an agent's sales drop below 50% of his quota for two shows in a row (the change event), action is required by the venue manager who oversees the agents.
- The passage of a designated period of time, called an elapsed-time event. For example, after a ticket has been held at will-call for three days (the elapsed-time event), it is returned to inventory for sale.
Modeling events and transitions
The Statechart diagram event notation is a label on an arrow connecting one state to another state, using a solid line with a stick arrowhead. The arrow is actually the transition associated with the event.
The terms event and transition are often used interchangeably in the context of a Statechart diagram because they always appear together.
The direction of the arrow shows the direction of the change. The base of the arrow identifies the state that the object is in when the event is received (either from another object or from the object itself), and the arrowhead identifies the state that the object changes to because of the event. Figure 10-4 shows that the event enable() causes the transition (the arrow) from the state Allocated to the state Enabled.
![]()
Figure 10-4: The State transition from Allocated to Enabled, caused by the event enable().
The event expression for signals and calls uses the format
event-name ‘(‘ [comma-separated-parameter-list] ’)’
[‘[‘guard-condition’]’] / [action-expression]
- Event-name identifies the event.
- The parameter-list defines the data values that are passed with the event for use by the receiving object in its response to the event.
- The guard-condition determines whether the receiving event should respond to the event.
- The action-expression defines how the receiving object must respond to the event.
So far I have only used the event name with no parameters, but I cover all the other expression elements in this chapter.
Most if not all the events on a Statechart diagram come from other objects. But the Statechart diagram does not tell you what object they came from. Why? Because the Statechart diagram is concerned only with the effect that the event has. The interaction diagrams model the sources and destinations of messages. It's like receiving a phone call—you don't have to know who is calling in order to pick up the receiver and answer. Within a Statechart diagram, an object doesn't need to know who sent the event. An object is only responsible for how it responds to the event. So it is important to remember that the base of the arrow identifies the state that the object is in when it receives the event and says nothing about where the event came from.
Keeping this rule in mind (that state objects in a Statechart diagram don't need to know where the events they respond to come from), helps reduce coupling in your design. When a message is tied to the sender, then each sender/message combination is a different event. For example, in the theater system there are at least three different types of people who will at some time select a show seat for some reason (to price it, to purchase it, or to refund it, for example). I can model these events as customerSelect(), agentSelect(), and venueMgrSelect(). But if I later define new types of people such as Marketing and Schedulers who also need to select a show seat, then I must add new events for each of the new types of people. If I instead focus on the condition of the object and its response to the event, then who sent the message becomes irrelevant and the model is simplified. There is only a select() event received under many different circumstances, but always for the same reason, to hold the seat so that I can perform an action on it without someone else interfering with it.
Furthermore, the state of an object when it receives an event can affect the object's response. An event received in one state may get one response, while the same event received under different conditions could get an entirely different response. For example, if you press the accelerator on your car while the car is turned on, the engine speeds up. If you press the accelerator when the car is turned off, the engine does nothing.
Figure 10-5 shows a toggle switch example. The same click() event causes different behaviors, depending on the state of the switch. The first click occurs when the switch is in the Off state, so it changes the switch from Off to On. The second click occurs when the switch is in the On state, so it changes the switch from On to Off. The same event causes two different behaviors because the event is coupled with the state of the object at the time the event is received. This relationship between events, state, and behavior can be described by the following formula:
Event + state = response.

Figure 10-5: The same event causes different responses based on the state of the object when it receives the event.
Modeling elapsed-time events
Often a change is triggered because of the passage of time. For example, when a ticket has been held at the ticket office will-call for three days, it is considered abandoned and is returned to the available pool of tickets. Elapsed-time events use the keyword after followed by an expression, enclosed in parentheses, that evaluates to an amount of time. Figure 10-6 models a portion of the Statechart diagram for a ticket object. The ticket starts in the Sold state and transitions to the Unsold state after three days have elapsed.
![]()
Figure 10-6: An elapsed-time event.
Modeling change events
A transition can be based on a change in the object or a change in its environment. For example, when an agent's sales drop below 50% of his quota for two shows in a row, we want to notify the venue manager in charge of managing agent performance. The change event's event-name is the keyword when and takes a Boolean expression as a parameter. The expression must be structured such that when it tests true, the change event triggers the transition. Figure 10-7 models how the agent object transitions from active to under review if the agent's quota drops below the established minimum.
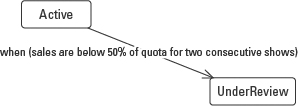
Figure 10-7: Modeling a change event.
The change event's Boolean parameter may be as complex as the problem requires. However, complex conditions are often a sign that the states are defined at too high a level and should be broken out into smaller, more specific states. One way to decide is to examine the values you are testing. If the values describe the object's condition, then combine these attributes with the other attributes that describe the state of the object to define new states. For example, Figure 10-8 models part of a Statechart diagram for the Customer object. It tells us that a customer transitions from the Active state to the Delinquent state. Regular customers change when they are 30 days late. Preferred customers change when they are 60 days late.
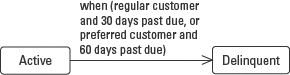
Figure 10-8: Deriving new states from the event parameters.
But the parameter values “regular” and “preferred” actually describe the customer. If I include the feature customer type with the values regular and preferred in the state definition, I get a much simpler Statechart diagram, as modeled in Figure 10-9. The redefined state definitions improve the cohesion of the design, while the simplified parameters also reduce the coupling in the design.

Figure 10-9: Revised Statechart diagram that improves cohesion and coupling.
 The example revising Figure 10-8 to the form seen in Figure 10-9 reinforces the benefit of modeling. Modeling reveals design issues in a way that text cannot. It provides a unique, easy-to-use opportunity to review and improve a design.
Modeling a guard condition
Typically an event is received and responded to unconditionally. Sometimes, however, receipt of the event is conditional. For example, when an order is entered into the theater system, it is considered tentative until the payment has been received. When the payment is received, the order transitions to the Placed state. The problem is that not just any payment will do. I have to test to make certain that the payment actually covers the cost of the order. This test is called a guard condition.
As shown in Figure 10-10, the guard condition is placed within square braces after the event name and before the slash and actions in the event expression (represented here as a reference).
event-name ‘(‘ [comma-separated-parameter-list] ’)’
[‘[‘guard-condition’]’] / [action-expression]
receivePmt()[amount=totalPrice]
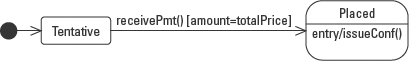
Figure 10-10: Modeling a guard condition.
Modeling event actions
In each of the preceding examples, I identified why the transition is made but not how. An event is only a trigger. The receiving object must know how to respond to the trigger. At the very least, the response has to explain how to change the attribute values that redefine the object's state. The behavior associated with an event is defined in an action expression. An action expression is the set of one or more actions triggered by an event.
If you think of the event as the operation signature, then the action expression corresponds to the implementation of that operation, the method. And just as there may be many lines of code in an operation implementation, there may be any number of actions in an action expression.
Even though an action expression may consist of a set of actions, it is still considered an atomic task (in other words, it cannot be broken into component tasks, nor can it be interrupted). There is a good reason for this. An action expression is part of a transition event; it is a part of the change from one state to another. If the transition is stopped for any reason, then the object is potentially left in an undefined state, meaning that some of the attributes used to define the new state may have been altered while others were not. This atomic model of execution is referred to as run-to-completion semantics.
To model the action expression, place a forward slash after the event name followed by the name of the action or actions you want performed, as in Figure 10-11 where allocating a seat requires notifying the marketing team that the new seat is available. The allocate() event uses the event syntax:
event-name ‘(‘ [comma-separated-parameter-list] ’)’
[‘[‘guard-condition’]’] / [action-expression]
![]()
Figure 10-11: Modeling an event/action pair.
When there is more than one action, simply separate them with commas. For example, the allocate() event could require the object to send a notification and enable the seat. The updated event expression would read as:
allocate()/ notify(), enable()
Technically, the format for the action is
result:=action-name (parameter-list)
However, I have encountered few tools that use this format, so all my examples simply use the format:
action-name (parameter-list)
Introducing the internal transitions compartment
Let's revisit the state icon for a moment. So far you know that the state icon accommodates the name compartment. Like the class icon, the state icon can also be expanded. The purpose of the expanded form is to reveal what the object can do while it is in a given state. The notation simply splits the state icon into two compartments: the name compartment and the internal transitions compartment, as illustrated in Figure 10-12.
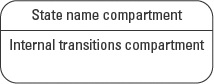
Figure 10-12: The expanded state icon.
The internal transitions compartment contains information about actions, activities, and internal transitions specific to that state. You've seen actions associated with events. Here I'm talking about the same actions, only documented as entry and exit actions within a state. I'll explain entry and exit actions first, then activities, and finally internal transitions.
Defining entry and exit actions
Modeling state transitions often results in more than one event that changes the object to the same state. Each of these events may have a corresponding action (action expression), or even the same action. For example, in Figure 10-13 the Statechart diagram for the Order object says that you can transition the order from the Tentative state to the Placed state by either receiving the payment for the order or getting an override authorization. But both events require the same action: issue an order confirmation, or issueConf().
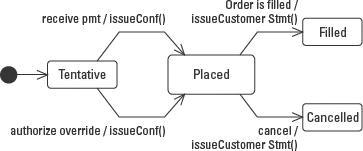
Figure 10-13: Redundant actions entering and exiting the Placed state of the Order.
Earlier, you discovered that the state icon can be expanded to reveal the internal transitions compartment. In that compartment you can model something called entry actions. Entry actions provide a means to eliminate the redundancy in Figure 10-13. Whenever you discover an action that must take place with every event that transitions into the state, you can write the action once as an entry action. Figure 10-14 shows the entry action notation, using the keyword entry followed by a slash and the action or actions that need to be performed every time you enter the Placed state. When the redundant action is replaced by the entry action, you can remove it from the individual transition arrows. This simplifies the diagram while preserving the same meaning. Figure 10-14 reads, “Every time you enter the Placed state, issue an order confirmation.”
The same simplification may be used for actions associated with events that trigger a transition out of a state. These are called exit actions and are modeled in the same manner as entry actions. Figures 10-13 and 10-14 show two events leaving the Placed state. Both events have the same associated action, issueCustomerStmt(). Figure 10-15 shows the exit/ action notation added to the internal transitions compartment of the Placed state and the actions removed from the outgoing event arrows. Compare Figure 10-13 with Figure 10-15 to appreciate the simplification from the original diagram.

Figure 10-14: Consolidating the entry actions.
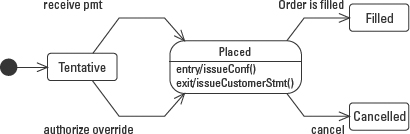
Figure 10-15: Consolidating the exit actions.
Entry and exit action notations provide a nice simplification for the Statechart diagram. Just remember that they may only be used when the action takes place every time you enter (for entry actions) or every time you exit (for exit actions) the state. If there is even one exception, the notation may not be used for that action.
Modeling activities
Activities are processes performed within a state. Unlike action expressions, an activity tends not to be atomic, that is, an activity may be a group of separate tasks. Activities may be interrupted because they do not affect the state of the object. Contrast this with the earlier definition of an action expression, which said that you must not interrupt action expressions because they alter the state of the object. Stopping an action midway could leave the object in an undefined state. Activities just do work. They do not change the state of the object.
For example, Figure 10-16 models the Active state of the Customer object. While in that state, the Customer object generates a monthly invoice for the customer's purchasing activity and generates monthly promotions tailored to the customer. To model activities within a state use the keyword Do followed by a colon and one or more activities.
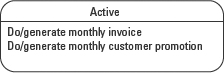
Figure 10-16: The expanded state icon with activities
These activities will be performed from the time the object enters the state until the object leaves the state or the activity/ies finish. If an event occurs that triggers a transition out of the active state, the object must shut down the activities (preferably gracefully) and exit the state.
Modeling internal transitions
While an object is in a given state it may receive events that do not trigger a change in state, yet do trigger a response. An event that can be handled completely without a change in state is called an internal transition. Like other transitions, it can specify related guard conditions and actions. The format for an internal transition is the same as for an event:
event-name ‘(‘ [comma-separated-parameter-list] ’)’
[‘[‘guard-condition’]’] / [action-expression]
For example, while a customer (represented by a Customer object) is in the Active state, she might receive a signal event notifying her that her tickets have been set aside for her at will-call. Receiving the notification does not alter her state. But it is important to capture the ability of a Customer object to receive the notification and respond by generating a mailing to the real customer. Figure 10-17 models the internal transition ticketsReady(). Since the internal transition (event) does not cause a change in state, it is modeled inside the internal transitions compartment of the state instead of on a transition arrow entering or exiting the state.

Figure 10-17: Internal transition.
A state can potentially include entry actions, exit actions, activities, and internal transitions. When this happens, all the elements are listed within the internal transitions compartment as follows:
Entry/action, action…
Do/activity, activity…
Exit/action, action…
Internal transition/action, action…
Internal transition/action, action…
There may be any number of internal transitions in a state. Each may have associated action expressions. Simply list them within the internal transitions compartment.
Order of events
With all these events, you could end up with a tangled mess of event actions, entry actions, exit actions, and activities. So how do you process all this behavior in a sane fashion? Well, there is an order to these things. When an event occurs that is associated with a transition, the order of execution runs like this:
- If an activity is in progress in the current state, interrupt it (gracefully if possible).
- Execute the exit/action(s).
- Execute the actions associated with the event that triggered the transition.
- Execute the entry/action(s) of the new state.
- Begin executing the activity or activities of the new state.
More about transitions
To wrap up this description of transition types, I need to explain a few more options including self-transitions, send events, and factored state transitions.
Modeling a self transition
There are times when an object receives an event that does not change the state of the object, but causes an interruption of the state. A self-transition is an event that is sufficiently significant to interrupt what the object is doing. It forces the object to actually exit the current state, and return to the same state.
The result of the self-transition is to stop any activity within the object, exit the current state, and re-enter the state, effectively restarting the state. Figure 10-18 models an order in the Tentative state. In the process of adding items to an order, for example, a customer may choose to simply start over by issuing the reset command. The effect is to erase any items added to the order (basically wiping out anything done to the order) while it was in the Tentative state.
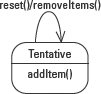
Figure 10-18: Modeling a self-transition.
Referring to the earlier section titled “Order of events,” you can trace the impact of a self-transition.
- If an activity is in progress in the current state, interrupt it (gracefully if possible).
- Execute the exit/action(s).
- Execute the actions associated with the event that triggered the transition. In this case, we have to perform the removeItems() operation on the order.
- Execute the entry/action(s) of the new state.
- Begin executing the activity or activities of the new state.
Defining send events
Sometimes the object modeled by the Statechart diagram needs to communicate with another object. On a Statechart diagram, the source of the incoming events is not shown because the same event may come from any number of other objects and the response must be the same. But an outgoing event must define the receiving object. It works in the same way you use your phone. You can receive calls without knowing who is calling. But you cannot place a call without the number of the person you want to call. When the object in the Statechart diagram sends a message to another object it is called a send event.
Recall the example in Figure 10-15: when the order is cancelled, the order is to issue a customer statement before leaving the Placed state. But the customer statement is another object that takes care of issuing itself. The order needs to tell the customer statement that it's time to do so. All the actions modeled so far were actions on the same object. To show that the action is invoked on a different object, simply provide the object name before the action expression, with a period separating the two. This is often referred to as the dot notation, because of the dot (period) separating the entries in the expression. In Figure 10-19, the exit action notation now shows the issue() action is being sent to the CustomerStmt object, using the expression CustomerStmt.issue().
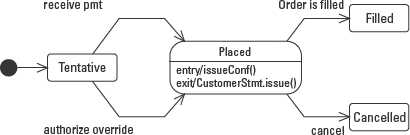
Figure 10-19: Modeling an action invoked on another object.
Compound transitions and factored paths
One goal of modeling in general and of UML in particular is to make modeling alternatives visible. Working with text and/or code to design an application almost forces a linear approach to the way we see and understand a problem. But many problems require a broader perspective that examines a number of design elements together.
For example, follow along as I document the transitions I discover and then model them using a Statechart diagram.
First I find the following transitions:
- The transition from State0 to State2 is triggered by event e2, guarded by the condition [b<0 and a<5].
- The transition from State0 to State3 is triggered by event e2, guarded by the condition [b<0 and a=5].
- The transition from State0 to State4 is triggered by event e2, guarded by the condition [b<0 and a>5].
- The transition from State1 to State2 is triggered by event e1, guarded by the condition [b<0 and a<5].
- The transition from State1 to State3 is triggered by event e1, guarded by the condition [b<0 and a=5].
- The transition from State0 to State4 is triggered by event e1, guarded by the condition [b<0 and a>5].
Figure 10-20 models the transitions listed above exactly as I documented them in a Statechart diagram.

Figure 10-20: The original problem definition found by following one requirement after another in linear fashion.
Doubtless you already see a lot of redundancy. The e1 and e2 events each appear three times. Also, since the guard conditions are combined into unique pairs, the individual conditions have to be repeated to account for every possible combination. Now that the diagram has made it easier to see these redundancies, you can begin to factor out the duplication and simplify the design.
Let's start with State0. All three transitions from State0 are triggered by the same event and share one of the guard conditions ([b<0]) in common. The differences are in the second halves of the guard conditions.
UML provides another pseudo state (like the initial state) called the static branch point that allows a transition arrow to split into two or more paths. Figure 10-21 models this notation as a small solid circle. One transition is drawn from State0 to the static branch point, using the common transition elements, e2[b<0]. Then at the static branch point the Statechart diagram shows three separate transition arrows, one to each destination state. Each arrow contains one of the unique elements of the transition, [a<5], [a=5], and [a>5].

Figure 10-21: Modeling a static branch point to re-factor compound conditions.
Examination of the transitions out of State1 reveals that the second guard condition on each transition is identical to the second guard condition on the e1 transitions from State0. Factoring out the redundant second half leaves the unique first half of the transition, e1[b<0]. In Figure 10-22, this new transition is drawn from State1 to the static branch point. Since the second half guard conditions are already modeled they can be reused to satisfy the requirements for event e1.
The UML 1.4 also allows the use of a diamond as the static branch point. The diamond has typically been used in modeling notations to represent a decision point. UML 2.0 uses only the diamond.
In yet other transitions, the destination of the transition isn't known until the associated action has been completed. In these cases you literally need to provide a temporary stopping point to evaluate the outcome of the action before moving on to the final destination. This stopping point is called a dynamic choice point.
For example, once every quarter the theater system automatically upgrades the status of customers based on how much they spend at the theater. Figure 10-23 models a set of upgrade transitions. The event is upgradeStatus(). The guard condition evaluates the amount of the customer's purchases. The amount is calculated by the action, totalPurchases(start, end). The guard condition cannot be evaluated until after the action is completed. So the action is the same on all three transitions.
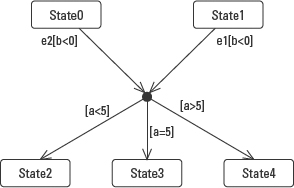
Figure 10-22: Combining the transitions into a single model.
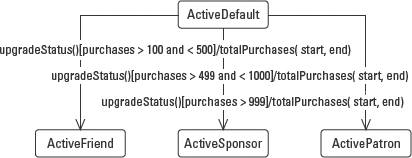
Figure 10-23: Modeling transition contingent on the result of the event action.
If we again factor out the common elements, we get a simplified diagram as modeled in Figure 10-24. It shows a single transition segment from the ActiveDefault state based on the event upgradeStatus() followed by the action totalPurchases(start, end). The transition hits the small hollow circle called a dynamic choice point, where the split takes place. Literally, this is the stopping point where the result of the action on the preceding transition segment is evaluated and a path is chosen. The choice depends on the result of the action.
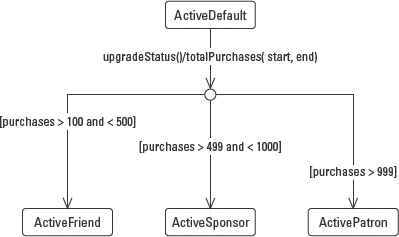
Figure 10-24: Modeling a dynamic choice point.
In summary, the static branch point provides a means to simplify compound guard conditions by combining the like portions into a single transition segment, then branching based on the portions of the guard that are unique. The dynamic choice point provides a means to isolate a behavior from the effect of the behavior. The behavior forms the first segment of the transition, before the dynamic choice point. The alternatives, based on the result of the behavior, form the outgoing segments after the dynamic choice point.
Relating the Sequence and Statechart diagrams
Those who use UML diagrams often miss the benefit of comparing and contrasting the different diagrams. Each diagram provides a unique view of the same problem. Comparing and contrasting these views can function much like reconciling your checkbook. That is, comparing multiple views of the same information makes it much easier to find and correct errors.
Earlier in this chapter, I made the point that events on the Statechart diagram correspond to messages on the Sequence diagram. The Sequence diagram views a behavior from the perspective of time. States describe the condition of an object during a period of time. There is enough overlap of the two diagrams to provide the means to do some comparison, or even derivation.
Deriving a Statechart diagram from Sequence diagrams
The dynamic model provides two diagrams that model changes over time: the Statechart diagram and the Sequence diagram. The key to understanding the relationship between these diagrams is in understanding states and events. Events trigger transitions between states. States capture the condition of an object during the period of time between events.
Using this understanding, look at the Sequence diagram shown in Figure 10-25.
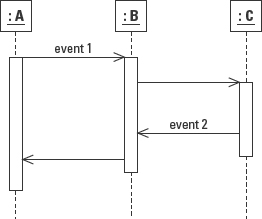
Figure 10-25: A basic Sequence diagram with events and transitions.
- Each vertical column represents a portion of the total lifeline for one object.
- Each event directed at a lifeline represents an event that might trigger a change in that object.
- The space between events on the object lifeline represents a period of time when the object remains in the same state. Because not every event causes a state transition, these periods are referred to as candidate states until it's proven that a change, in fact, occurs.
- The events pointing outward from the object lifeline represent either return values sent to other objects or send events.
The challenging part of mapping the Sequence diagram to the Statechart diagram is determining the condition of the object between the events and naming it as accurately as possible. The state of the object is defined by the values of one or more of its attributes. Use these values to find adjectives that describe the object's condition. For example, if one of the attributes indicates whether the object has been sold or not, then you might use sold and unsold as part or all of the state name. The same state may appear in many Sequence diagrams, so accurate naming can prevent confusion when you merge the states from the Sequence diagrams. Adjectives and gerunds make very good state names, but you might need more than one descriptor to fully describe the current condition of the object.
Figure 10-26 shows how to map the events and corresponding gaps on the lifeline of the Sequence diagram to candidate states and events on the Statechart diagram.
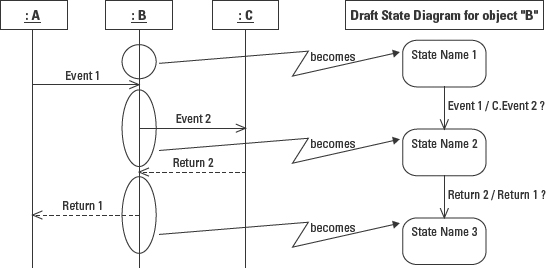
Figure 10-26: Mapping a Sequence diagram to a Statechart diagram.
Understanding these concepts is a lot easier when you can see an example, so I'm going to derive a Statechart diagram for the ShowSeat object. I'll work through the same series of steps for each scenario:
- Identify the events directed at the lifeline of the ShowSeat object.
- Identify candidate states by isolating the segments of the lifeline between the incoming events.
- Name the candidate states using adjectives that describe the condition of the object during the period of time represented by the segment.
- Add the new states and events to the ShowSeat Statechart diagram.
I've substantially simplified the Sequence diagrams for the purpose of the example, but the mechanics of the derivation process are appropriate for a larger example, too.
I'll use two scenarios each from four use cases to create the final, consolidated Statechart diagram for the ShowSeat object. The first pair is represented in Figure 10-27. Each pair of use cases follows the same pattern. The first scenario represents a user selecting a showseat in order to perform some action. The select event has the effect of putting a hold on the showseat so that no one else can access it while the user completes the action. (If you are familiar with databases, you could think of it as a record lock.) Once the showseat is held, the user can proceed with the action supported by the use case. The second scenario starts the same as the first (the user selects the showseat), but then the user changes her mind and cancels the hold. The effect of this action is to release the hold on the showseat.

Figure 10-27: A standardized pair of scenarios for the first use case, Purchase ShowSeat.
To find the candidate states, identify the segments of the object lifeline between the start, end, and incoming events. Figure 10-28 marks the candidates and maps them onto a draft Statechart diagram. The challenging part is to find appropriate names for the states. First ask, what condition would a show seat need to be in to allow it to be purchased? It would need to be priced, not held by anyone else, and not already purchased. When the scenario begins the show seat is priced, not held, and not sold. After the select event it is still priced and not sold, but now it is held. After the purchase event, the show seat is still priced, but it is now sold, and, since, the action is completed, the hold is released.
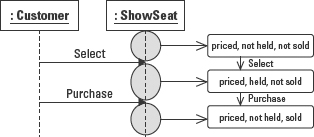
Figure 10-28: Finding the transition events and candidate states for scenario 1 of the Purchase ShowSeat use case.
In this example, I name the states using three specific word/word phrases that reflect the three attributes of the object that together define its condition. You could also choose to use a single word to describe each state as long as you document somewhere the fact that the name reflects the unique combination of these attributes. These three attributes ultimately need to become part of the ShowSeat class specification.
The second scenario, shown in Figure 10-29, models the cancel action. Note that the first event is the same as in scenario 1, indicating that there is significant overlap between the two scenarios. This is confirmed when we examine the condition of the object at each state. Compare the state names from Figure 10-29 with those in the previous scenario in Figure 10-28.

Figure 10-29: Scenario 2 from the Purchase ShowSeat use case.
Remember that the scope of a Sequence diagram is one scenario, and that the scope of a Statechart diagram is the entire life of one object (limited, of course, by the scope of the current project or modeling effort). So the next step is to merge the redundant states and reconcile the events to create a single, consolidated Statechart diagram for both scenarios as modeled in Figure 10-30.

Figure 10-30: Consolidated Statechart diagram for the first two scenarios.
To gather all the possible events that could affect the showseat object, I must also evaluate the other three use cases that reference the showseat namely, Price a ShowSeat, remove the Price from a ShowSeat, and Refund a ShowSeat. Continuing the derivation process for the remaining six scenarios (two per use case) results in a consolidated Statechart diagram for all four use cases.
Examination of the attributes that together define the states of the object reveals the initial state. You have to ask what the initial value of each attribute should be. The combination of these initial values identifies the condition of the object at the time it is constructed. In Figure 10-31, the initial state is Not Priced, Not Held, Not Sold. Basically I haven't done anything to the show seat yet.
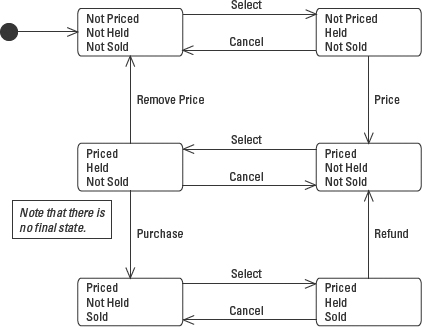
Figure 10-31: The final, consolidated Statechart diagram for the ShowSeat object.
This is just one simple technique for taking advantage of the Sequence diagram to help you build a Statechart diagram. You will very likely encounter others. In fact, there are more formal methods for mapping the two diagrams in a manner that is supported by software. Some modeling tools enable you to work on a Statechart diagram and then automatically generate or update your Sequence diagrams. Likewise, you can create Sequence diagrams and generate a Statechart diagram. There are also tools such as Together Control Center by TogetherSoft that generate Statecharts and Sequence diagrams from code.
The Statechart and Sequence diagrams can help you a great deal when you're trying to design the behavior of your objects, especially those few objects that are at the heart of your application. For business applications, this typically means about 5 percent of the objects at the heart of your business, like products and transactions. Within the application itself, the objects that manage the behavior of the application, that is, control-type objects, often warrant a Statechart diagram since they are exclusively devoted to managing the state of the system.
Complex, event-driven interfaces can also benefit from a Statechart diagram. Often the complex processing in these interfaces is handled with elaborate conditional statements that evaluate the values of the various screen elements. These values define the state of the interface. Modeling the interface behavior in the context of unique states can achieve simplification similar to that illustrated in Figures 10-8 and 10-9.
Evaluating the significance of each event on the state of the object
One footnote needs to be added to the description of translating a Sequence diagram to a Statechart diagram. A transition event is an occurrence that alters the state of an object. Not all messages alter the state of an object. For example, common get An AttributeValue() message simply returns a value. It does not change the state of the object. At most, such a message might appear as an internal transition. More often than not, you would not model them at all on a Statechart.
If you identify two candidate states, as in the model on the left of Figure 10-32, then later realize that the triggering event does not cause a transition, simply combine the two candidate states into one candidate state, as in the model on the right of Figure 10-32.

Figure 10-32: Eliminating insignificant events.
Modeling Composite States
Modeling often requires different views of a problem. High-level views simplify the model. Low-level views focus on details of a problem. The UML Statechart diagram supports the concept of nested states, allowing both high- and low-level views of object behavior and states. The higher-level view defines the concepts of composite state, superstate, and substate.
A Composite state is simply a state that contains one or more Statechart diagrams. Composite states may contain either a set of mutually exclusive states or a set of concurrent states. The first, a state containing mutually exclusive states, is literally like embedding a Statechart diagram inside of a state. The second, a state containing concurrent states, divides a state into two or more regions. A region is simply a space within the state. Each region contains a Statechart diagram. The concurrent aspect comes from the fact that each region executes independently and at the same time as the other regions. Any given state may only be decomposed into one of these two varieties.
A composite state is also called a superstate, a generalized state that contains a set of specialized states called substates. A superstate may be modeled as a state icon with one additional feature, a composite icon that consists of two small horizontally aligned rounded-rectangles connected by a line as pictured in the superstate icon on the left side of Figure 10-33. The icon indicates that the state can be expanded to reveal more details. The expanded form is shown in the right side of Figure 10-33. Eliding and expanding the state icon is used in the same way as hiding and showing the compartments on a class. The purpose of the diagram is to provide a context for discussion and review. Use the form that is appropriate for the level of discussion.
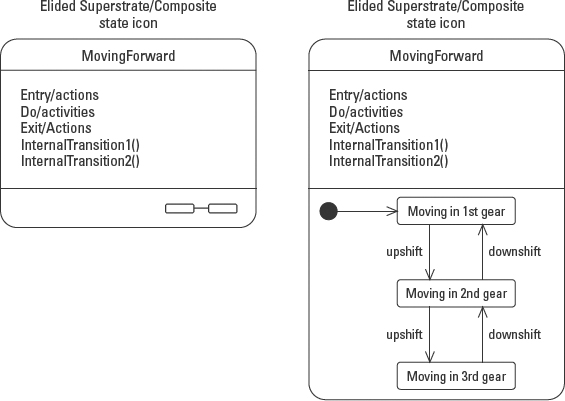
Figure 10-33: An elided superstate icon (left) and the expanded superstate icon (right).
Substates are states within a superstate, the states that make up the Statechart diagram contained within the superstate. For example, Figure 10-33 models the fact that a car can be in the superstate MovingForward. Within the MovingForward superstate are substates of moving forward in first gear, moving forward in second gear, and so on. The substates explain in finer detail what it means to be moving forward. This detailed view enables you to highlight concurrent substates or decide how to control the splitting and merging of the transitions between mutually exclusive substates. These two uses of substates (concurrent and mutually exclusive substates) are explained in the next two sections.
Modeling mutually exclusive substates
A composite state (superstate) may be decomposed into two or more lower-level states (substates). All the rules and notation are the same for the contained substates as for any Statechart diagram. The substates reside within a graphic compartment below the name and the internal transitions compartments, as illustrated in Figure 10-34.
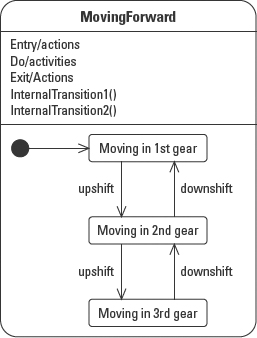
Figure 10-34: Mutually exclusive substates displayed in a graphic compartment within a superstate.
States may be decomposed into substates as many levels as the problem requires. For example, moving forward could be a substate of “driving”, along with other substates such as “moving in reverse”, “in neutral”, and “in park”. Too many levels can become difficult to understand, so be careful not to overdo it.
Modeling concurrent substates
Modeling concurrent substates implies that you have many things occurring at the same time. To isolate these different sets of activity, the composite state is divided into regions, and each region contains a distinct Statechart diagram. In the simplest application the different regions support activities that simply do not have any sequential dependency. For example, finalizing a ticket sale implies printing the ticket and marking the show seat as reserved. It really doesn't matter which task is performed first so they can be done at the same time. Figure 10-35 models the FinalizingSale state of an order object with two concurrent substates, each in its own region. The regions are divided using a dashed line within the graphic compartment.
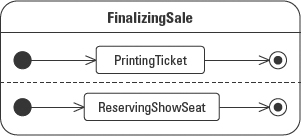
Figure 10-35: Composite state with concurrent regions.
I'll explain the use of the initial and final states, as well as other transitions for composite states, in the “Transitions to and from composite states” section later in this chapter.
Submachine States
A submachine state is a kind of shorthand for referring to an existing Statechart diagram. In fact, the Submachine State metaclass is a subclass of the Composite State metaclass.
Earlier you saw the simple icon for the composite state that indicates there is more to the state than is being shown at the time. The submachine is more explicit. Within a composite state, the submachine state may be referenced in the same manner that a class would call a subroutine or a function on another class. In fact, a composite state may reference the same submachine any number of times.
For purposes of identification, the composite state that calls the submachine is called the containing state machine. The submachine is called the referenced state machine. Access to submachine states is through entry and exit points that are specified by stub states.
The containing state icon models the reference to the submachine state by adding the keyword include followed by a slash and the name of the submachine state, as shown in Figure 10-36. The stub states use a line with the state name placed near the line. The stub states sub1 and sub1::sub12 represent the entry points into the submachine state. The stub states subEnd represents an exit point from the submachine state. The use of entry and exit points is explained in the next section.

Figure 10-36: State containing a submachine state with stub states designating the available entry and exit points.
©OMG 1.4
Transitions and composite states
As in any Statechart diagram, the two fundamental elements in composite Statechart diagrams are states and events. The movement between states is defined by the transitions. Movement into and out of composite states presents an added layer of complexity, because now the transition isn't simply between states at the same level. A single transition might move from a superstate to a substate, to a substate of the substate … .
The following sections lay out the rules for using transitions in and out of composite and concurrent states.
Transitions to and from composite substates
A composite state is simply a state that contains a Statechart diagram. A Statechart diagram has an initial state and possibly a final state. There are two ways into a composite state. The first method is to transition to the composite state itself. This is modeled by drawing the transition pointing to the edge of the composite state icon. This notation is interpreted to mean that the composite state starts in the default initial state. The default initial state is the substate associated with the initial state icon in the contained Statechart diagram. That is to say, if no other entry point is specified by the transition, then the initial state is the assumed entry point for the transition into the superstate.
In Figure 10-37 models part of the Statechart diagram for the ShowSeat object. The shorthand composite state is on the left, and the expanded composite state is on the right. On the left, the initial state points to the edge of the composite state Active. This means that the initial state of the ShowSeat object is the default initial state within the Active superstate, that is, “Not Priced, Not Held, Not Sold”.

Figure 10-37: Transition to the default initial state.
Note that the initial state icon on the left specifies the start of the Statechart diagram that contains the Active superstate. The initial state on the right is the starting point for the Statechart diagram contained within the superstate.
It is also valid to show that transition is directed to a specific substate. In this case, the transition points through the edge of the superstate to the edge of the specific substate. In Figure 10-38 the transition arrow (starting from the initial state icon outside the superstate) points from outside the superstate “Active” to the substate “Not Priced, Not Held, Not Sold”. The effect of this example is the same as in Figure 10-37 because both transitions are directed to the same substate. But using this second technique, where the transition arrow crosses the superstate edge and points directly to a substate enables the modeler to direct the transition to any substate.
As with entering a superstate, exiting the superstate can be accomplished in multiple ways. An object may leave the superstate regardless of the current substate, leave from a specific substate, or exit at the completion of all activities within the superstate.
To show that an event would cause the object to leave the superstate, regardless of the current substate, draw the transition from the edge of the superstate to the new state. For example, all the show seats are archived at the end of a show regardless of whether they were priced, or sold. Figure 10-39 models two ways (the elided and expanded views) to represent how the archive event causes the show seat to transition from active to archived, no matter which of the six substates the show seat might be in at the time it is archived.
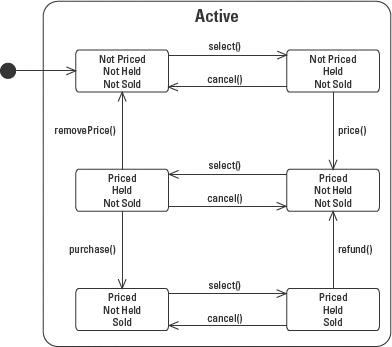
Figure 10-38: Initial state refers to a specific substate.

Figure 10-39: Leaving a superstate.
It is also possible to exit the superstate directly from a specific substate. Modeling this situation implies that the exit event may only happen while the object is in the designated substate. For example, we could specify the rule that while a show seat has not yet been priced, it may be deactivated, or made ineligible for sale, but once it is priced, it cannot be deactivated. Figure 10-40 models the way to indicate that a transition is only valid from a specific state. The transition is drawn from the edge of the substate, through the edge of the superstate, and pointing to the InActive state.
Note that if the transition applies to more than one, but not all substates, then the transition has to be drawn multiple times, once for each applicable substate. If the transition applies to all substates, use the notation in Figure 10-39. But if there is even one exception, one substate to which the transition does not apply, you must draw the transition from each substate as in Figure 10-40.
Finally, an object may leave a superstate simply because all of the activity of the state and its substates has been completed. For example, you are currently in the state of reading this book. If you receive an event such as a phone ringing, a doorbell, or a time event like “It's time for dinner,” you will exit the reading state. This is like the transitions already described. But you will also exit the reading state when you finish reading the book. This is sometimes called an automatic transition because nothing external caused the transition, it happened automatically when the work of the state was completed. Automatic transition is modeled by starting the transition arrow at the edge of the superstate and directing it to the new state. But the transition has no event label.

Figure 10-40: Exiting a superstate from a specific substate.
Stubbed transitions
Stub states provide yet another shorthand for moving in and out of a state machine while avoiding the need to describe the entire state machine. Stub states represent only the entry and exit points for a submachine state. Each stub is drawn as a line with the substate name as the label. The name just needs to be near the line. A stub state can be used for both entry into a submachine and exit from a submachine. A stub used as an entry point is a stub with one or more transition arrows pointing to it. A stub used as an exit point is a stub state with one or more arrows coming out of it.
Since substates can themselves have substates (nested states), the stub notation follows the double-colon (::) path notation used elsewhere in UML (see class paths in Chapter 5). For example, substate1 :: substate2 :: substate3 refers to substate3 that resides within substate2, which resides within substate1.
Figure 10-41 provides two stub states, sub1 and sub1 :: sub12. The event error1 causes a transition from outside the Handle Failure state directly to the sub1 substate of FailureSubmachine. The event error2 causes a transition from outside the Handle Failure state directly to the sub12 substate within the sub1 substate of the FailureSubmachine.

Figure 10-41: Stub states provide entry points for a submachine state while hiding the complete design of the submachine.
©OMG 1.4
Similarly, events can cause the object to exit a state. Figure 10-42 adds the stub state subEnd. The stub state subEnd provides an exit point from the FailureSubmachine state. The event fixed1 forces the object out of the submachine FailureSubmachine and out of the Handle Failure composite state.
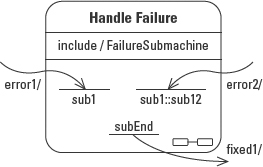
Figure 10-42: Modeling an exit stub state. ©OMG 1.4
History indicator
The history pseudo state is a shorthand notation for a complex modeling problem. It is common to want to undo one or more actions in an application, effectively returning the application to a previous state. Returning to a simple state is easy. Returning to a composite state means having to find the specific substate that was active when the object left the composite state. If the Statechart diagram had to account for every possible transition back into the layers of substates, the diagram would quickly become too complex to be useful. The history pseudo state provides a simple alternative.
The history pseudo state may refer to either shallow history or deep history. The terms shallow and deep refer to how far down in the layers of substates the object should be restored. Shallow history means that the object should return to the last substate on the topmost layer of substates. Deep history means that the object needs to be returned to the exact substate from which it left, no matter how many layers down that is.
For both shallow and deep history, there can be a default that points to an initial state either at the topmost layer, for the shallow history default, or an initial state at a lower layer, for the deep history default. These defaults are applied if and when the state is entered for the first time via the historical pseudo state.
Figure 10-43 models the historical pseudo state for the show seat. In the event that the show seats are restored from archive, we want them to be returned to their former substate. The notation for a history pseudo state is a small circle. For shallow history, the circle contains the letter H. For deep history, the circle contains H*, the letter H with an asterisk. The transition arrow returning from the Archived state points to the circle to show that the transition changes the state of the show seat back to whatever substate is dictated by the type of history pseudo state.
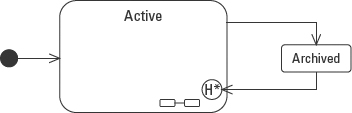
Figure 10-43: Historical pseudo state.
Transitions to and from concurrent states
A composite state may contain concurrent states. Each set of concurrent states resides in a separate region. Each region abides by all the rules we've defined so far for transitions in and out of superstate and for submachines. In addition, concurrent states introduce the need to coordinate simultaneous behaviors, including synchronization, split of control, and merge of control.
Split of control and merge of control
Split of control means that based on a single transition, you want to proceed with many tasks concurrently. Split of control is shown by a single transition dividing into multiple arrows, each pointing to different substates. The divide is accomplished with the synchronization bar used as a forking mechanism, as shown in Figure 10-44.
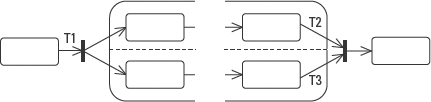
Figure 10-44: Split of control and merge of control using the synchronization bar.
Event T1 targets a synchronization bar. At the bar, the transition splits into two paths, each pointing to a different substate, one in each region within the composite state. The transition splits into one transition for each region in the composite state. Once the split takes place, there may be any number of substates and transitions in each region. The regions execute independently of one another.
Merge of control means that based on the completion of a number of transitions, you want to proceed with a single task. Basically, a merge is the opposite of a split. On the right end of Figure 10-44, there is a second synchronization bar that illustrates the merge of control. There are two transitions hitting the bar (T2 and T3) and one exiting the bar. The completion of the two transitions merge at the bar indicating a merge point. Once both the T2 and T3 events occur, a single merged transition continues on out of the composite state. T2 might happen ten minutes after T3, at the same time, or long before T3. It doesn't matter. Both events have to occur before the merge is complete and the transition can be completed. A merge point may merge any number of transitions into a single transition.
Synch states
Sync states extend the split and merge of control across regions to coordinate the behavior of concurrent states. Such coordination is sometimes necessary even between relatively autonomous activities. For example, we could compare separate regions within a composite state to the behavior of different components in a car, such as the transmission stick and the clutch. While driving, I can move the stick on my manual transmission any time I like. But if I move it without first pressing in the clutch I get a very unpleasant noise.
Figure 10-45 models two concurrent regions within a composite state. Reading from left to right, when state B1 is completed, it transitions to a split point. At the split point a transition is sent to a sync state, modeled as a circle containing an asterisk (*). In the meantime, when C1 completes, it transitions to a merge point. In order for the transition from C1 to C2 to finish, it must wait for the transition from B1. In other words, the transition to C2 has to wait for the completion of both B1 and C1, even though B1 is not in the same region.
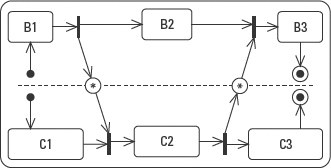
Figure 10-45: Using sync states to coordinate behaviors across regions.
In like manner, B3 cannot proceed until both C2 and B2 have completed.
Multiple transitions out of a superstate
As with any composite state, there are many ways to exit a composite state with concurrent substates. Figure 10-46 models a composite state that contains three concurrent regions. There are three ways that the object can exit the composite state.

Figure 10-46: Multiple ways to exit a composite state with concurrent substates.
- Some type of interrupt event, such as T1, could take the object out of any and all substates and out of the composite state entirely.
- All three substate regions could run to completion. In this case the object would automatically transition to the next state, assuming one has been defined.
- A specific event, such as T2, could take the object out of a specific substate and out of the composite state entirely.
Summary
The Statechart diagram models the life of a single object. The fundamental elements of a Statechart diagram are states and events. The following are the key points discussed in this chapter:
- A state represents the condition of the object. The state is recorded in the values of one or more of the attributes of the object.
- An event triggers a change in state, a transition.
- An action expression is a behavior triggered by an event, the behavior that actually makes the changes to the attribute values that redefine the state of the object.
- The Statechart diagram allows many events to transition to the same state. Each event may trigger an action. When all the actions associated with the transitions into a state are the same, you can model them as a single entry action. Place the entry action description in the internal transitions compartment of the state.
- Likewise, the Statechart diagram allows many events to transition out of the same state. Each event may trigger an action. When all the actions associated with the transitions out of a state are the same, you can model them as a single exit action. Place the exit action description in the internal transition compartment of the state.
- When an action is directed at an object other than one modeled by the Statechart diagram, use the dot notation to describe the send event. Place the object name and a period in front of the action expression.
- When an event takes place it sets off a series of responses in the form of actions and activities. The order of execution for the actions and activities is:
1. If an activity is in progress in the current state, interrupt it.
2. Execute the exit: action(s).
3. Execute the actions associated with the event that started it all.
4. Execute the entry: action(s) of the new state.
5. Execute the activity or activities.
- A number of different types of events can trigger a transformation in an object:
- Call events are basically messages from other objects telling the modeled object what to do. They are explicit calls to an operation on the object.
- The elapsed-time event triggers a transition based on an amount of time that has passed. Elapsed-time events use the keyword after followed by a time expression.
- Change events monitor the object and/or its environment for some change. Change events use the keyword when followed by a Boolean expression.
- Signal events are asynchronous invocations, much like call events but without requiring a reply.
- Guard conditions may qualify the execution of an event. The event only executes when the guard condition is true.
- The UML supports the ability to open up a state and break it into smaller pieces. The smaller pieces are substates, states within a state. The larger containing state is referred to as the superstate or composite state.
- The substates are modeled as a Statechart diagram within a state. All the normal notation of a Statechart is available within a state. When there is more than one concurrent substate, simply split the superstate icon with dashed lines separating the superstate into regions.
- Split and merge of control use the synchronization bar to represent forking or synchronization or both.
- The Sequence diagram provides the events that can affect an object's condition. It also helps to identify the periods of time between the changes caused by the events. These periods of time when the object remains unchanged may represent states on the Statechart diagram. To derive the Statechart diagram from the Sequence diagrams use the following steps:
1. Identify the events directed at the lifeline of the object you're modeling.
2. Identify candidate states by isolating the portions of the lifeline between the incoming events.
3. Name the candidate states using adjectives that describe the condition of the object during the period of time represented by the gap.
4. Add the new states and events to the Statechart diagram.
- The scope of the Sequence diagram is only one scenario. The scope of the Statechart diagram is the entire life of the object, so it might take many Sequence diagrams to build one Statechart.
![]()