
CHAPTER 16
Using Deployment Diagrams in UML 1.4
![]()
In This Chapter
- Defining the Deployment diagram
- Defining and modeling nodes and node properties
- Defining and modeling node associations
- Modeling component containment
- Defining and modeling node and component instances
- Defining the «become» and «deploy» stereotypes
![]()
A Deployment diagram describes an execution architecture, that is, the configuration of hardware and software that defines how the system will be set up and how it will operate. The purpose of a Deployment diagram is to present a static view, or snapshot, of the implementation environment. A complete description of the system will likely contain a number of different Deployment diagrams, each focused on a different aspect of system management. For many of these views the Deployment diagram is combined with the Component diagram to show the relationship between the hardware and the software. For example,
- For a multi-tiered application, the Deployment diagram would model the distribution of the application layers, their physical connections, and their logical paths of communication.
- Another diagram might focus on how software components are distributed across the network resources, such as where the source code resides and where it is shipped for implementation.
- Another diagram might model how an executable is loaded from one node where it is stored to another node where it actually runs.
The Deployment diagram consists of nodes and associations between nodes. It represents the same information often modeled in network diagrams that represent the devices and connections of a computing architecture. UML 1.4 describes the Deployment diagram in two contexts:
- A Deployment diagram can define node types, much like a Class diagram that defines object types.
- A node represents a type of processing resource, such as a CPU performing calculations or a human being performing a manual task.
- An association defines the type of relationship that supports the communication between nodes.
- A Deployment diagram may include component instances within node instances to illustrate the runtime environment.
- A node instance represents a specific processing resource of a designated type.
- A node link represents a specific connection of a designated type (defined by an association between nodes).
 Although the Component and Deployment diagrams have been part of the UML specification since its inception, they are relatively new to most people and there are a lot of different ideas out there about how to use them. These tools can be very helpful, but they will not make or break an implementation. Use good judgment. Practice. Find out where the benefits lie for your project. Exploit the tool for your success instead of just following a standard.
Modeling Nodes and Associations
The simplest form of the Deployment diagram models hardware only. The Deployment diagram is really just a network diagram like those used for many years now by network management folks. The icons are much simpler, which seems like a step backward, but remember that the UML does not limit how you represent an item or how you extend the model, so you can still use the icons you are used to for disk drives, servers and clients, hubs and routers, and so forth.
A node can represent just about anything that can perform work. Depending on the type of system you are modeling, a node could represent a disk drive with long-term memory, a server with temporary memory and processing capability, a mechanical device like an automated welder or conveyor belt, or even a human being or organizational unit such as a department or team.
The UML 1.4 version of nodes is very simple. Figure 16-1 shows the portion of the UML 1.4 metamodel that describes nodes and components. A node is simply a type of classifier that may contain components.

Figure 16-1: UML 1.4 node metamodel.
©OMG 1.4
In UML 1.4 nodes may not contain other nodes. Because it is quite common to have processing units within other processing units, such as a server with multiple CPUs and disk drives, this limitation is corrected in UML 2.0.
Because the node is a subclass of Classifier, it may have attributes and operations, and may participate in associations. This means that a node may be defined in terms of its features, such as memory size, number of processors, processing speed, and so forth, and its abilities, such as boot, shutdown, and restart. These details can be valuable when you are specifying the equipment that you will need to support the implementation of the system. For example, the specification of a desktop computer for graphic design can be very different from that of a desktop computer used for business applications like spreadsheets and word processors.
Figure 16-2 illustrates a type-level server node with attributes, operations, and associations, and an instance-level server node with attribute values and links.
I need to note, however, that many modeling tools do not provide the ability to model attributes and operations on a node, so you might need to use the documentation area of the node specification to provide these details. This area is typically a window accessed from the node icon within the modeling tool.
Figure 16-3 illustrates the two levels of Deployment diagram. On the left is a type-level diagram. On the right is an instance-level diagram. In the type-level diagram, each node defines only a type of processing unit. A node type is just like a class in that it provides a definition and can be instantiated. The node name uses the form
node-name ‘:’ node-type
The type name may be used by itself, such as “Server” or “AccountsPayable”. The instance may use the complete form, such as “SAN09 : Server”, or just the name, such as “SAN09”. When only the instance name is used, the colon is omitted. Figure 16-3 shows all the instance names fully qualified with name and type.
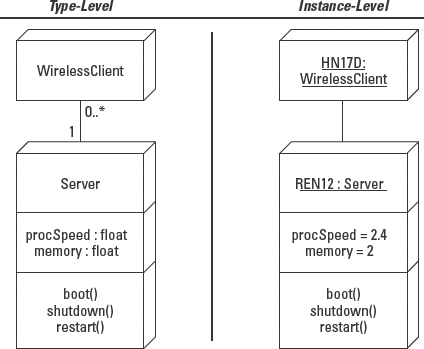
Figure 16-2: Nodes described with features–attributes, operations, and associations.

Figure 16-3: Node names on a Deployment diagram.
The associations between nodes follow the same rules as associations between classes. Each association defines the multiplicity at each end. But the association names for nodes pose a small problem. Because the diagram deals exclusively with hardware, every association could wind up with the name “connects to”. This wouldn't add much meaning to the relationship.
What matters most when connecting hardware is how the nodes are connected—Ethernet, token ring, parallel, TCP, USB, and so on. So typically, instead of a name, node associations use a stereotype, for example, «parallel», «Ethernet», or «TCP». Figure 16-4 adds the «Ethernet» stereotype to the association between the database server and the middleware server.

Figure 16-4: Association stereotype between nodes.
Modeling the Runtime Environment with Components
The Deployment diagram can combine nodes and components to model the relationship between the processing resources and the implementation of the software. When a component resides on a node, it can be modeled within the node itself on the diagram. To show the logical communication between the components, draw a dashed dependency arrow, the same as is used on the Component diagram, as illustrated in Figure 16-5. The nodes, components, and dependencies in this figure describe the following relationships:
- The database server contains the performance database.
- The middleware server runs the performance EJB, which depends on the performance database.
- The client runs the JSP pages, which depend on the performance EJB.
Placing the component icon within a node explicitly represents containment of the component within the node. The same thing could be accomplished by drawing a dependency between the node and the component using the «deploy» stereotype. Figure 16-6 says that the PerformanceEJB component is deployed on the SAN10 : MiddlewareServer.
Note that the components drawn in a Deployment diagram are always component instances. The Component diagram by itself models type-level components, that is, component definitions. The combined Deployment and Component diagram models the runtime environment. Consequently, the components illustrated on nodes are the resident instances of the components defined on the Component diagram.

Figure 16-5: Modeling components contained within / residing on nodes.
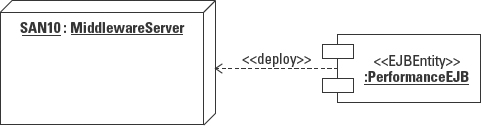
Figure 16-6: Using the «deploy» dependency stereotype to model containment.
Combined Deployment and Component diagrams can also illustrate software migration at runtime or during distribution. For example, in Figure 16-7, the performance JSP file resides on the middleware server, but is loaded onto the client at runtime. UML defines the stereotype «become» to represent the transformation, or migration, of a piece of software from one location to another.
These examples make it obvious that the component notation alone does not clarify everything needed to describe a system. For example, what exactly is the difference between the component on the server and the component on the client? UML 2.0 expands the concept of implementation artifacts to clarify this relationship between the requirements of a physical component and the description of the types of artifacts used to provide the physical implementation. Artifacts are fully explained in Chapter 17.

Figure 16-7: Migrating software using the «become» stereotype.
Summary
The Deployment diagram models hardware architecture by identifying the processors. Processors are typically computers or equipment, but may also be people who perform manual processing. Nodes, or processors, may contain and run software components. Node connections are modeled as associations, complete with stereotypes and multiplicity.
- A node may be modeled like a class with attributes and behaviors. However, some modeling tools do not support this view.
- Associations between nodes typically use stereotypes instead of names to describe the nature of the connection. Node associations represent the physical communication paths such as TCP or Ethernet.
- Component and Deployment diagrams may be combined. Components reside on a node. Component icons are placed inside the expanded node icon, or connected to the node icon using a «deploy» dependency (dashed arrow), to model containment.
- Communication between components on the nodes is modeled as a dependency (dashed arrow). Dependencies model the logical communication requirements.
- The «become» dependency stereotype describes the migration or movement of software from one location to another.