
Chapter 8
Culture Versus Alternate Theories: Arguments and Evidence
Arguments and Evidence
Culture isn't just one of the drivers. It is the driver of the innovation of firms.
THE PRIMARY THESIS OF this book is that the culture of a firm drives its innovativeness, or the degree to which it introduces radical innovations. Chapter 1 gives a synopsis of the meaning of culture and subsequent chapters detail each component of culture. Critics may argue that the examples in each chapter have been cherry-picked to support that particular example of culture. Such critics may want to see broad cross-sectional evidence in support of culture as the primary driver of innovativeness. This chapter provides such evidence.
The need for evidence is especially important because scholars across a variety of disciplines have proposed alternate theories or explanations for the innovativeness of firms. Few studies have scientifically compared all these competing theories to ascertain which one is most consistent with the evidence. This chapter also serves that goal.
Over the last twenty years, my coauthors and I have formally tested various alternate explanations for innovativeness and published our results in a series of peer-reviewed articles.1 The important feature about these studies is that they are not based on cherry-picked examples but on an objective sampling of markets and firms. The studies that we have assembled provide strong evidence that the internal culture of the firm trumps every alternate theory for what could be the driver of a firm's innovativeness. This chapter classifies and reviews each alternate theory and presents the evidence we have collected on each.
The many alternate theories for firm innovativeness can be grouped into either micro-theories that operate primarily at the market level or macro-theories that operate primarily at the global or country level.
Micro-Theories
Among the explanations for firm innovativeness, four theories or effects have become popular, partly due to books or articles espousing them: Wall Street effect, the size effect, disruptive technology effect, and S-curve effect. This section briefly describes these theories and then presents contrary evidence from one of my large cross-sectional coauthored studies.
Wall Street Effect
When I was presenting the thesis of this book at a meeting, a senior manager from a large multinational corporation stood up and said, “It's not the incumbent's curse, it's the Wall Street Curse.” He went on to explain that the key reason that publicly traded incumbents today are not innovative is because senior executives work very hard to shore up the stock price on Wall Street by meeting the numbers. The numbers here are sales and earnings forecasts. He went on to state, “No one got fired for meeting the numbers.” We all know that many CEOs got fired for sustained or sharp declines in sales, profits, and especially market capitalization.
Can managers boost their firms' stock prices by adopting short-term measures? What are these measures? Do they take away from innovation? There are at least two ways that firms can boost earnings through so-called short-term measures. First, managers can cut costs in administration, manufacturing, marketing, and R&D. Second, managers can lay off employees, especially in functions not essential to immediate sales and marketing, such as R&D. Both these measures may lead to higher profits, earnings, and stock prices, at least in the short term. To the extent that these cuts in costs or laying off employees affect R&D or any innovation activity, it will reduce the flow of future innovations despite increasing short-term profits, earnings, and possibly stock price. If indeed such measures increase short-term stock price at the cost of long-term growth and market cap, then the measures would be myopic. At least one study shows that such myopic practices do exist, especially in recessions.2
The Wall Street Curse boils down to this phenomenon: pressure from investors on Wall Street causes managers to cut investments in innovation to boost current earnings and stock prices, at the cost of future innovation, growth, and long-term market cap.
Is this really true? How does the stock market respond to announcements about investments and progress in R&D and innovation? Does the market really respond negatively to such investments?
To answer this question, Professor Ashish Sood of Emory University and I analyzed 5,481 announcements made by sixty-nine firms in five markets between 1977 and 2006.3 These announcement related to various stages of the innovation process, beginning as early as opening a lab or starting a research project, through the developments of prototypes and patents, until the launch of a product and its winning awards. The method used for the analysis depends on market returns to announcements calculated via an event analysis. Our analysis controlled for a large number of other explanatory variables, especially market factors that are known to affect returns (market movements, small versus large firm effect, growth versus value stocks, and momentum). What we found came as a big surprise and runs counter to the Wall Street Curse. In particular, five findings are highly pertinent to this discussion.
These results show that the stock market is not as oriented toward the short term as it is often criticized to be. If one analyzes the data carefully, the market does respond positively to long-term innovation and growth. The Wall Street Curse is a scapegoat for failure to make the tough decisions that need to be made when investing in long-term research projects for innovation. The root cause of the problem is the incumbent's curse laid out in this book.
Size Effect
The size effect comes from the theory of creative destruction ascribed to Joseph Schumpeter.4 The central thesis of this theory is that radical innovations destroy old ones but create new markets that increase consumer welfare. For example, the automobile industry destroyed horse carriages, the personal computer and printer destroyed typewriters, and MP3 players destroyed mobile tape players. While there was much pain with the demise of an old market, the welfare of all consumers improved with the rise of the new technology. The important question the theory addresses is: who introduces the radical innovations? Schumpeter and his followers assume that all such radical innovations are introduced by small firms and that the destruction of the old industry invariably involves the failure of large firms.
My coauthor Rajesh Chandy of the London Business School and I tested this hypothesis. Our results were published in a peer-reviewed scientific journal.5 We decided to focus on two broad categories of products—office products and consumer durables—because they are the most often studied in this area, enabling us to compare findings with prior studies. Within these two markets, we sampled all major innovations over the prior 140 years. Our criterion for major innovation was whether the innovation led to a new market that generated over one million dollars in revenues. Three experts classified these innovations on a 9-point scale of radicalness. We defined radicalness based on how much the innovation used an entirely new technology and provided substantially new benefits to consumers compared to the product it replaced.
The primary research question of our study was whether radical innovations came from large firms or small firms. Contrary to Schumpeter's belief, we found that the number of radical innovations from large firms (42%) was only a little lower than those from small and medium firms (48%). Moreover, in a multiple regression model, the size of a firm was not a significant determinant of the radicalness of an innovation. Further, an analysis across time explains how the small firm theory may have originated (see Figure 8.1). Prior to World War II, 83% of radical innovations were from small and medium firms and only 17% were from large firms. After World War II, that distribution shifts dramatically: 74% of radical innovations are from large firms and only 26% are from small and medium firms. Thus, Schumpeter's theory and those of others who followed him were likely based on evidence prior to World War II. The situation today has changed dramatically, as Figure 8.1 shows.
Figure 8.1 Size of Firms Introducing Radical Innovations by Time Period
Source: Adapted from Chandy, Rajesh and Gerard J. Tellis, “The Incumbent's Curse? Incumbency, Size and Radical Product Innovation,” Journal of Marketing, 64, no. 3 (July 2000): 1–17.
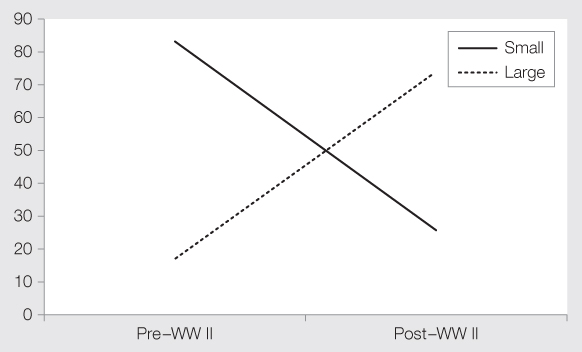
That a large number of all radical innovations now come from large firms implies that many large firms are innovative. But small and medium firms still produce a nontrivial number of radical innovations, implying that in those markets, some large firms fail to come up with the radical innovation. So the question remains: why are some large firms innovative and others not? Our answer is that it is not size per se that matters but the culture of the firm.
A good example is the case of IBM. In the 1970s, IBM was the leading manufacturer of mainframe computers. Prior to the birth of desktop computing, IBM mainframes dominated the computer market. True to Schumpeter's small firm thesis, a small start-up in New Mexico called MITS introduced the first desktop computer called Altair. The Altair was primitive and stayed a hobbyist's toy until Apple introduced the Apple I and popularized personal computing. It was only in 1980 that IBM decided to enter the market. Why the delay? Prior to its entry, IBM's internal culture was centered on mainframes. Longtime IBM insiders either saw no value in desktop computing or feared it would cannibalize the huge profits from the mainframe business. So the mainframers stalled or killed every effort at introducing a desktop computer.
But IBM did ultimately introduce a highly successful personal computer in 1981, the IBM PC. To overcome the culture within, IBM set up a skunk works6 at Boca Raton, Florida, completely independent of headquarters, with the mandate of introducing a personal computer in one year. It even kept the division secret from mainframers at IBM to prevent any effort to cripple the project. Thus, it was the creation of an autonomous unit, free from the stifling culture of the mother ship, which enabled IBM to overcome its own noninnovative culture. In this case, the large firm failed to innovate before 1980 but still did in 1981. The difference was the culture within and the efforts used to overcome it, not the size of the firm per se.
In the early 1990s, IBM was on the verge of implosion with the rise of rivals Microsoft and Intel, and the decline of its personal computing and mainframe businesses. At that point, the firm hired Louis Gerstner Jr., CEO of RJR Nabisco. In a period of nine years, Gerstner orchestrated a radical change in IBM, transforming it from a hardware company focused on patents to a services company focused on complete IT solutions for business clients. IBM became once again a highly innovative company. One could argue that Gerstner did not change very much. After his retirement, at a major conference in Los Angeles, when asked what he changed at IBM, he answered with one word, “culture.” Chapter 5 describes this amazing transformation.
This book does not dispute creative destruction per se. It instead refutes a major premise of that theory that innovations that cause such destruction come exclusively from small firms rather than large firms. Our research suggests that not size but culture (as described in prior chapters) drives a firm's innovations.
Disruptive Technology Effect
Professor Clay Christensen of Harvard University put forth the theory of disruptive technology in a top-selling business book.7 The essence of the theory is that leading firms in a market invest in the currently dominant technology even when its performance, as measured on the primary dimension of performance, exceeds the needs of the mass market or majority of consumers. During this time, a new (disruptive) technology emerges on the horizon. The new technology is superior to the dominant technology on some secondary dimension that appeals only to a niche market and not to the mass market, and so the market leaders ignore or belittle the new technology. Initially the new technology's performance is inferior to that of the dominant technology and below the needs of the mass market on the primary dimension of performance. For this reason, the mass market does not embrace the new technology. However, the new technology continues to improve in performance on the primary dimension until it meets the needs of the mass market. Then, because it is also superior on the secondary dimensions of performance, it represents a better buy for the mass market than the dominant technology. At that point, the new technology disrupts the dominant technology.
Which firm introduces the new technology? Christensen's answer reflects a key finding of the theory: “The firms that led the industry in every instance of developing and adopting disruptive technologies were entrants to the industry, not its incumbent leaders.”8 According to this result, all incumbent leaders cling to the old technology while all new disruptive technologies are introduced by new entrants to the market.
One problem with this theory is that it does not contain a precise, unambiguous definition of “disruptive technology” prior to and independent of disruption. What exactly is a disruptive technology before it disrupts? How does an analyst identify it? In the absence of such a definition, there is the danger of defining the disruptive technology after the event. That is, after some new technology disrupts incumbents, it will be classified as disruptive. In that case, the theory becomes circular and has no predictive value.
Professor Ashish Sood and I carried out a study to test this theory and imbue the concept of disruptive technology with meaning. Our study, published in a peer-reviewed scientific journal,9 is based on thirty-six technologies across seven markets. We took pains to sample all technologies in each market, both those technologies that disrupted and those that did not, those that were new and those that were old. For each market, we sampled a time period ranging from 53 to 127 years. Overall, the data took several years to collect and involved a team of research assistants. We defined a technology on scientific principles independently of disruption. In particular, we defined those new technologies that are initially inferior to the dominant technology on the primary dimension of performance as “potentially disruptive.”10
What are the results of this study? There is no doubt that new technologies arise with increasing frequency and that they destroy entire markets. Consistent with the theory, we too find that new technologies initially appeal to niche segments but later with improvement, they appeal to the mass market. However, our study refutes the two most important tenets of the theory of disruptive technology. First, incumbents in a market introduce potentially disruptive technologies more frequently (53%) than new entrants (47%). Second, and more important, incumbents are significantly more likely to cause disruption in a market than entrants.
Thus, contrary to Christensen's theory, disruption is not the prerogative of new entrants. We find that some incumbents are disrupted by new entrants, while other incumbents themselves introduce disruptive technologies. In other words, some incumbents are innovative and others are not. What is the reason for this difference? The thesis of this book is that the internal culture of the firm determines whether it will be innovative or not, not its status as an incumbent or the arrival of some external technology. Firms that have an innovative culture are able to develop, embrace, and deploy disruptive innovations. Firms that do not have such a culture cling to their old technologies and are disrupted.
For example, in the market of photography, digital photography has disrupted analog photography. Kodak was the dominant player in analog photography since its founding by George Eastman over a hundred years ago. The uninformed might suspect that some new entrant researched and introduced digital photography. However, surprisingly, the firm that developed the most technologies and that has the most patents in the digital photography market is Kodak. Yet Kodak did not become the unquestioned leader of digital photography. The reason is not because it ignored the new technology or failed to invest in it or failed to develop it as the theory of disruptive technology would suggest. The reason is Kodak's fear of cannibalizing its established film business based on the analog technology. Chapter 2 explains in greater detail the pervasive culture that critically inhibited Kodak despite efforts by its CEO.
There are some valuable insights in the theory of disruptive technology. However, the danger in this theory is to attribute failure primarily to an external technology. The real cause of success or failure is within: the culture of the firm.
S-Curve Effect
The S-curve effect or theory was put forth by Richard Foster, a former director and senior partner of McKinsey & Company.11 The basic premise of the theory is that the evolution of the performance of a technology on a primary dimension of performance follows the shape of an S-curve. The S-curve emerges because the new technology's performance initially is flat due to technological hurdles, then improves rapidly as researchers overcome these hurdles, and finally flattens out in maturity as it reaches the limits of growth. A new technology emerges above the starting point but below the current level of the dominant technology when the latter is still in its ascendancy.
The theory asserts that all incumbents concentrate on the old technology and ignore the new one. In contrast, new entrants support and advance the performance of the new technology. However, by the time the dominant technology reaches its peak, the new technology hits its growth phase. The latter then surpasses the old dominant technology in performance and becomes the dominant technology. At that point, incumbents make a last effort to improve the old technology. They strive to push the limits of the old technology and may squeeze out a little performance from it, but the amount is too little to compete with the fast-growing new technology. As Foster states, “If you are at the limit, no matter how hard you try, you cannot make progress.”12 The incumbents then fail with the old technology, while the entrants who supported the new technology become the market leaders. As Foster states, “These [technology] patterns suggested that in most cases it is companies with new ideas and approaches, not entrenched large ones that collectively have the advantage—the attacker's advantage.”13
The problem with this theory is that it suggests a path of technological evolution that is too stylized to hold for every technology in every market. Moreover, the theory is based on selective cases and not on an exhaustive list of all technologies in a market. By using selective examples, the author runs the risk of cherry-picking examples to suit the theory.
Professor Ashish Sood of Emory and I tested this theory with data similar to that collected in our study reported earlier.14 We sampled every technology in six markets. By selecting every technology, we ensured that we did not cherry-pick examples to support or reject a certain position. We published this study in two articles: one in a peer-reviewed scientific journal and the other in a working paper of the Marketing Science Institute.15
Our study led to five results that were all contrary to Foster's S-curve of technological evolution (see Figures 2.3 and 8.2): (1) Technological performance does not evolve in the shape of smooth S-curves. Rather it evolves in a series of step functions; (2) sometimes, the evolution may show a spurt in performance even after a long period of dormancy; (3) new technologies emerge at random intervals, sometimes above and at other times below the performance of the dominant technology; (4) the performance paths of technologies cross not only once, but multiple times; and (5) most important, an approximately equal number of new technologies come from entrants and from incumbents. Thus, contrary to Foster's view, new technologies are not the prerogative of new entrants. Why are many incumbents innovative while others are not? The underlying driver is culture. Those that have the necessary culture (described in the first chapter and elaborated in subsequent chapters) stay at the cutting edge of technological advances with radical innovations. Those that lack that culture fail to innovate and decline in market share or die out.
Figure 8.2 Technology Evolution in Printers
Source: Adapted from Sood, Ashish and Gerard J. Tellis (2005), “Technological Evolution and Radical Innovations,” Journal of Marketing, 69, 3 (July), 152–168.
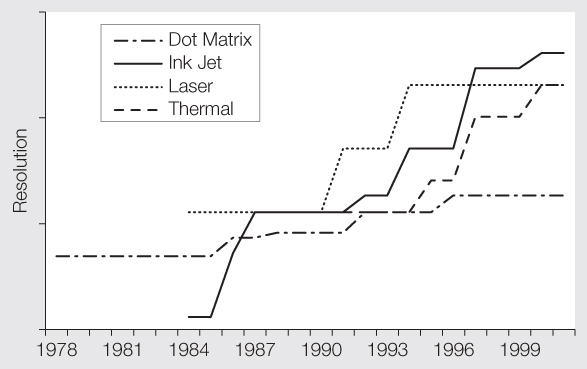
For example, Figure 8.2 shows that the technological paths of inkjet printing and laser printing crossed many times. Any firm that abandoned one of these technologies when surpassed by a rival would have lost a great opportunity.
Indeed, HP became the dominant player in printing because it backed both technologies. It established a culture of internal markets that allowed two competing divisions to each develop and market one of these competing technologies. Chapter 6 explains the principles of internal markets with this and other examples to show how a firm stays at the cutting edge of innovation.
Thus, although technologies do evolve in distinct curves, they are not single S-shaped but multiple-step functions. The danger in assuming a single S-curve is that managers may abandon a promising technology at the first indication of a flattening of the technology's performance. Most important, incumbents are not doomed to fail simply because they are incumbents. Rather, incumbents can remain dominant by building a culture for unrelenting innovation.
Macro-Theories
During the course of my many presentations to and discussion with executives, individuals have proposed rival explanations to the theory of culture that I have emphasized in this book. Oftentimes these rival explanations have been raised quite simply as plausible alternates: “Oh, that is typical of such and such (culture, country, religion, or climate).” Interestingly, these rival explanations are not merely those of lay people. Scholars over the decades have proposed several macro explanations for innovativeness. In this section, I summarize some of these theories in a nutshell even though entire treatises and books have been written and continue to be written in support of them. I then argue why culture is a better explanation of innovativeness than any of these rivals. Finally, I describe a study we conducted to test all these theories versus a theory of culture. When reviewing these theories, readers may see the limitations or fallacies in the arguments. Yet I include these theories to be complete in my review of other explanations and to establish the preeminence of culture as an explanation for a firm's innovativeness. I focus on the following alternative theories: religion, climate, geography, patenting, and education
Macro-Theories in a Nutshell
The explanation for religion rests on the argument that certain religions focus on inward bliss (Buddhism), abstinence (Hinduism), or rewards of the afterlife (Catholicism), whereas others focus on development and advancement of the internal self or external world (Judaism and Protestantism).16 The latter religions motivate followers to build products, firms, or markets and adopt or commercialize innovations. Followers of the former three are less motivated to do so. Perhaps the best known proponent of this theory is Max Weber, who coined the phrase, “the Protestant work ethic.”17 Popular examples given in support of this theory are the greater economic progress and innovativeness of Northern Europe (predominantly Protestant) versus Southern Europe (predominantly Catholic) and the dominance of the West over the East in the last five centuries.
The explanation for climate rests on the argument that warm climates are not as conducive to work, industriousness, and innovativeness as are cool climates. In particular, hot climates lead people to minimize energy expenditure so as not to generate further heat from work, whereas cool climates lead people to work with greater frequency and effort in order to generate heat and keep themselves warm. Another explanation for climate is that warm climates are more abundant in natural, animal, and plant life, allowing inhabitants an easier lifestyle with less motivation for work. On the contrary, cold climates are more hostile, require long-term planning, and motivate people to work.18 Both claims hold that innovativeness flourishes where there is a greater drive for and output of work. The evidence offered in support of this theory is the greater economic development in the last 500 years of Northern Europe over Southern Europe, North America over Central and South America, and Europe (predominately cool) over Asia (predominantly warm).19
The explanation for geography takes various forms. One of these, best put forward by Jared Diamond, is that certain geographic regions were well endowed with critical natural resources (primarily wild domesticable cereals and animals) and with good trade routes to neighboring regions. These then began to progress through a positive self-sustaining cycle of innovation and economic wealth. Diamond's primary evidence is the success of Mesopotamia, then Mediterranean countries, and then Western Europe over Africa, Australia, and North and South America, especially up to the sixteenth century.20
The explanation for patenting rests on the argument that a patent enables the recipient to reap monopoly profits from its commercialization for a period of time. This motivates the recipient to develop and commercialize innovations.21 The need for such motivation increases with the cost, effort, and time required to develop and commercialize innovations. Intellectual property protection is a term used to cover protection by patents, copyrights, and branding, all of which could be related to the advancement of innovations. Evidence for patents as a driver of innovation has been used to explain why in the sixteenth to twentieth centuries more innovations were developed and commercialized in Western Europe over China and India. Though China and India were more advanced than Western Europe prior to the sixteenth century, the Europeans developed a more formal patenting system from about the fifteenth century than what existed in China and India.22
The explanation for education states that inventing requires at least some technical knowledge best attained through a strong education system. This factor is especially important for innovations in science and engineering.23 During the twentieth century, the United States developed the most extensive, deep, and sophisticated education system in the world—especially at the postsecondary level. Some authors use that explanation to explain its come-from-behind advance over Europe to become a global superpower in the twentieth century with the highest number of innovations across most fields.
Refutation of Macro-Theories
Most of these macro-theories are based on observations of a narrow set of countries or across a narrow time period. One can refute these theories by giving examples of firms that have performed well on innovations outside of these sets of countries or time periods. The issue pertinent to us is whether these theories hold in the twenty-first century, with its radically different economic, political, and environmental conditions. Rather than proceed with theoretical arguments, I will present notable examples that run contrary to the theories presented above.
Good examples to refute the theory of religion are Japan, India, and the United States. Since the 1960s, Japan's economy developed rapidly to achieve high levels of innovation, at least in some fields (for example, automobiles, miniaturization, and robotics). Protestantism is not the dominant faith in Japan; Buddhism is. That Buddhism shuns materialism and strives for internal bliss has not hindered Japan from making great material progress. India is another good example. Prior to 1992, India's economic backwardness could be attributed to the Hindu philosophy that advocates renunciation of material goods and pleasures and reconciliation with one's karma or destiny. Indeed, the slow rate of growth in India from 1947 to 1992 was referred to derogatively as the “Hindu rate of growth.” However, India was a prosperous country in several time periods prior to the sixteenth century despite prevalent Hinduism. It was so wealthy that it became the destiny of numerous invaders and plunderers in prior centuries. Also, with economic liberalization in 1992, the economy grew rapidly and spawned numerous highly innovative firms.24 The country is predicted to be one of the top three economic powers by 2050.25 Clearly, Hinduism, the prevalence of which has remained approximately constant during this time period, cannot explain these dramatic changes in progress and prosperity. Further, the theory of religion cannot explain why the United States grew to be so much more innovative than Northern Europe in the twentieth century though both of them are predominantly Protestant. These examples of Japan, India, and the United States show that the theory of religion does not hold beyond a narrow set of countries (for example, Western Europe) over a relatively small time period (for example, the fifteenth to the nineteenth century).
Good examples to refute the theory of climate are Singapore, India, Greece, and Italy. Singapore is a country with a hot, humid climate. Yet in a period of forty years since 1962, the people of Singapore transformed a backward swamp into a highly developed country with the potential to develop innovations of its own. India has had a predominantly warm climate throughout the last three thousand years. However, as stated earlier, its economy changed dramatically during that time period. India was a wealthy country prior to the sixteenth century, wealthier than most, if not all, European countries. During much of the twentieth century until 1992, India was a poor, backward country with few innovations about which to boast. It developed rapidly due to economic liberalization in 1992 and produced impressive innovations. Yet, India's climate has not changed as dramatically as its economy has in the last two thousand years. Greece and Italy lag behind northwestern Europe in economic progress today, but around two thousand years ago, they were the very epicenters of economic progress and innovation in Europe—Greece during the glory days of Athens as a city-state, and Italy during the Roman Empire. Again, over the last twenty-five hundred years, the climate of Europe has not changed dramatically, though the fortune of these countries has. Thus, climate is a poor explanation of economic wealth and innovativeness.
Geography may have played an important part in the development of countries and regions at one time, but not any longer. With means of rapid transportation across the world and the growth of the Internet, people even in remote areas are now well connected with the world community. Thus, the isolation of communities, which hindered progress and innovation in the past, is no longer a hurdle.26 The best example to refute the theory of geography is China. Until about 1421, it was the most advanced economy in the world with numerous innovations of the time.27 Then it entered a long period of economic decline and stagnation. Beginning in 1978, it entered into a new period of rapid economic progress and innovation that lifted billions out of poverty.28 China currently has the fastest growth rate of any major economy, has the second largest economy in the world, and is slated to become the largest economy by 2050.29 Most important, it has developed innovations in many areas, albeit with complaints that these innovations may have been copied from the West. Throughout these dramatic changes in economic performance, China's geography did not alter much. What did change is its organization. Indeed, the culture for innovation, especially for firms within the country, changed the most. That better explains the rise, fall, and rise again of the Chinese economy.
The theories for intellectual property protection and education are valid. Although intellectual property protection and education are necessary for innovation, they alone are not sufficient. Most major economies of the world today have a minimum set of laws protecting intellectual property and have institutions that provide education at least for some portion of the population. Yet the innovativeness of firms within these countries varies dramatically. For example, the United States has an excellent system of intellectual property protection and university education. Yet within the United States, one-time strong and dominant firms declined and fell because of a failure to develop, embrace, or commercialize innovations, as the examples in Chapter 1 and subsequent chapters show. Indeed, in every country, one can find firms that are highly innovative and others that are not. What explains these differences? I explain these differences with the culture of the firm. And a culture that lends itself to innovation transcends the patent and education system within any country.
In 2003, Rajesh Chandy of the London Business School and Jaideep Prabhu of Cambridge University and I undertook a study to test the theory of culture against other micro- and macro-theories as a causative explanation for a firm's innovativeness. We published this study in 2009 in a peer-reviewed scientific journal.30 What made this study challenging is that we targeted over four thousand firms across seventeen countries (see Table 8.1). Over 770 of these firms responded, representing a relatively good response rate of 20%.
Table 8.1 Countries and Firms Sampled
| Country | Sample | Responses |
| Australia | 128 | 35 |
| Canada | 154 | 25 |
| China | 183 | 31 |
| France | 242 | 39 |
| Germany | 315 | 81 |
| Hong Kong | 167 | 15 |
| India | 139 | 28 |
| Italy | 99 | 32 |
| Japan | 409 | 57 |
| Korea | 333 | 87 |
| Netherlands | 62 | 17 |
| Singapore | 176 | 24 |
| Sweden | 113 | 26 |
| Switzerland | 80 | 23 |
| Taiwan | 243 | 83 |
| UK | 383 | 67 |
| USA | 848 | 102 |
| TOTAL | 4,074 | 772 |
Source: Adapted from Tellis, Gerard J., Jaideep Prabhu, and Rajesh Chandy (2009), “Innovations of Firms Across Nations: The Pre-Eminence of Internal Firm Culture,” Journal of Marketing, 73, 1 (January), 3–23.
For the survey, we developed a questionnaire that measured characteristics of the responding firm, including religion, geography, climate, patenting, and education. We also measured the innovativeness and culture of the firm. For these latter variables, we used standard published scales that were developed and adjusted through prior studies. These scales consisted of an average of three items for innovativeness and each component of culture. We worded multiple items with opposing positive or negative valenced terms, such that respondents with a particular response would have to switch between the right and the left end of the scale.31 So doing allowed us to discriminate between respondents' bad, thoughtless responses (that answer the same way across items irrespective of their valence) and good, thoughtful responses (that change with the valence of the items). In short, using multiple oppositely valenced items enables a researcher to distinguish between internally consistent and inconsistent responses. In addition, we collected market data on an exhaustive list of about two hundred variables for each firm, including economic conditions, R&D investments, stock market performance, and so forth.
The study has two dependent variables: the firm's innovativeness and its stock market performance. The study has two important findings, one from each of these dependent variables. First, innovation is an important driver of financial performance. Second, the culture of the firm is the most important driver of the innovativeness of the firm (see Figure 8.3). In particular, five key components of culture turned out to be significant drivers of the innovativeness of the firm (all described in prior chapters except internal markets). Besides culture, the only other important variable that affected firm innovativeness is R&D by sales. In addition, none of the other drivers of innovativeness posited by the various competing theories reviewed earlier were significant drivers of innovation.
Figure 8.3 Effects of Alternate Variables on Innovativeness of Firms.
Note: Non-significant effects are portrayed as 0. Religion is measured as belonging to one of several religions including Catholic, Protestant, Hindu-Sikh, Buddhists, or Other. Patents are measured as citation weighted patents. Location is measured as latitude of the capital of the country from the equator. R&D is measured as percentage of all employees in R&D. Innovativeness is measured by a three-item Likert scale. Size is measured as sales volume. The effect of culture is the sum of the effects of five dimensions of culture that were significant, each measured by a three-item Likert scale: willingness to cannibalize current products, tolerance for risk, focus on future, incentives for enterprise, and empowerment of champions. Internal competition was not significant.
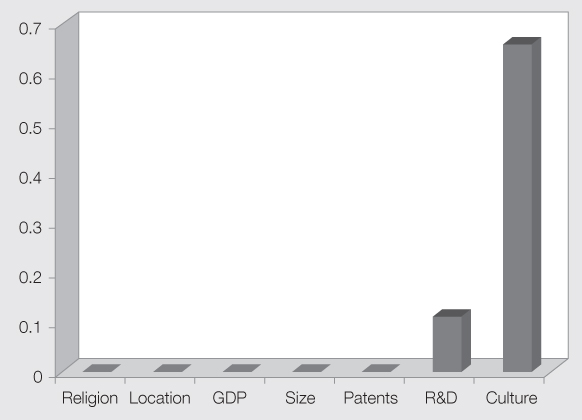
When we presented our results at various conferences, audiences were especially surprised that patents did not turn out to be a significant driver of innovativeness. For decades, and in most economic theories, patents have been identified as an important output of innovation of a firm. However, our thesis is that patents may be a good measure of creativity but not of commercialized innovations. That is, having merely a large number of patents does not ensure that a firm is innovative. Table 8.2 shows this point dramatically.
Table 8.2 Productivity of Patents in Sony and Apple in 2006
| Firm | Market Cap | Patents |
| Sony | $40 billion | 1,447 |
| Apple | $45 billion | 103 |
For example, about the time the iPod was introduced, Sony had ten times as many patents as Apple. That huge body of patents did not help Sony much. As Chapter 2 detailed, before the launch of the iPod, Sony was five times the size of Apple in terms of market capitalization. However, once the iPod took off, Apple became twice the size of Sony (Figure 2.4). Thus patents represent a measure of inventiveness but not of commercialized innovations.
Indeed, a heavy emphasis on patenting may create an inward-looking culture of creativity. According to Louis Gerstner, former CEO of IBM, this is the mentality that ailed IBM when he took over.32 However, market success depends on an outward-oriented culture of successfully commercializing radical innovations for future mass markets. Like patents, religion, geography, climate, patenting, and education have no explanatory power on the innovativeness of these 772 firms across seventeen countries (Figure 8.3). The survey instrument from this study can be used by firms to gauge their own innovativeness and benchmark their firm's culture and performance against the over 772 firms in our database.
Conclusion
Scholars from many disciplines have postulated several theories, both micro and macro, for the drivers of innovativeness of countries and firms within countries. This chapter reviews a number of these theories. Among micro-theories are the Wall Street effect, the size effect, the disruptive technology effect, and the S-curve effect. Among macro-theories are religion, climate, geography, patenting, and education. This chapter argues that the culture of the firm is a better explanation for a firm's innovativeness than these other theories. The chapter also describes four large, formal studies that present relatively objective evidence that none of these other theories constitute a compelling and complete explanation for the innovativeness of firms in contemporary markets. In particular, the fourth study shows that culture trumps every other variable as an explanation for innovativeness.
To show that the examples in the text are not cherry-picked, this chapter provides formal evidence in support of the theory of culture. The evidence is based on a series of studies involving massive data collection that were subjected to rigorous peer review. Most important, the studies are all based on systematic or random sampling—but not selective sampling—of firms, markets, or innovations.
Although firms cannot completely control Wall Street or their incumbency, size, country of operation, climate of operation, religion of employees, or technological evolution, they can control their culture. I define firm culture with three important traits: willingness to cannibalize successful products, embracing risk, and focusing on the future. Altering cultural traits is difficult. But traits are influenced by practices. Three important practices for innovation are: creating incentives for enterprise, establishing internal markets, and empowering innovation champions. A firm's leaders have the power and opportunity to change practices and thus shape its culture for innovation. The prior chapters explain each of these components of culture with case histories of successful innovation or missed opportunity
My explanation of culture births hope.
1 Sood, Ashish and Gerard J. Tellis, “Demystifying Disruptions: A New Model for Understanding and Predicting Disruptive Technologies,” Marketing Science, 30, no. 2 (March-April, 2011): 339–354; Tellis, Gerard J., Jaideep Prabhu, and Rajesh Chandy, “Innovation of Firms Across Nations: The Pre-Eminence of Internal Firm Culture,” Journal of Marketing, 73, no. 1 (January 2009): 3–23; Sood, Ashish, and Gerard J. Tellis, “Technological Evolution and Radical Innovations,” Journal of Marketing, 69, no. 3 (July 2005): 152–168; Chandy, Rajesh and Gerard J. Tellis, “The Incumbent's Curse? Incumbency, Size and Radical Product Innovation,” Journal of Marketing, 64, no. 3 (July 2000): 1–17; Chandy, Rajesh and Gerard J. Tellis, “Organizing For Radical Product Innovation,” Journal of Marketing Research, 35 (November 1998): 474–487; Sood, Ashish, and Gerard J. Tellis, “Do Innovations Really Pay Off? Total Stock Market Returns to Innovation,” Marketing Science, 28, no. 3 (May-June, 2009): 442–456.
2 Mizik, Natalie, “The Theory and Practice of Myopic Management,” Journal of Marketing Research, 47 (August, 2010): 594–611.
3 Sood and Tellis, “Do Innovations Really Pay Off?”
4 Schumpeter, Joseph, Capitalism, Socialism and Democracy, (New York: Harper, 1975). Originally published 1942.
5 Chandy and Tellis, “The Incumbent's Curse?”
6 The term skunk works was originally used to describe Lockheed Martin's Advanced Development Programs, which was responsible for a number of famous aircraft designs, such as the U-2. The term is used for a division or business unit that is given great autonomy to work on a secret project away from meddling by the established bureaucracy.
7 Christensen, Clayton M., The Innovator's Dilemma: When New Technologies Cause Great Firms to Fail (Boston: Harvard Business School Press, 1997).
8 Ibid., 24.
9 Sood and Tellis, “Demystifying Disruptions.”
10 We do so to compare our results with Christensen who claimed that all his disruptive technologies are initially inferior in performance to the dominant technology on the primary dimension of performance.
11 Foster, Richard, Innovation: The Attacker's Advantage (New York: Summit Books, 1986).
12 Ibid., 34.
13 Ibid., 21.
14 Sood and Tellis, “Technological Evolution and Radical Innovations”; Sood, Ashish, and Gerard J. Tellis, “The S-Curve of Technological Innovation: Strategic Law or Self-Fulfilling Prophesy?” Marketing Science Institute working paper, no 04–116, 2004.
15 Ibid.
16 Gorski, Phillip, The Disciplinary Revolution: Calvinism and the Rise of the State in Modern Europe (Chicago: University of Chicago Press, 2003); DeLong, J. Bradford, “Productivity Growth, Convergence, and Welfare: Comment,” American Economic Review, 78, no. 5 (1988): 1138–1154.
17 Weber, Max, The Protestant Ethic and the Spirit of Capitalism, (New York: Penguin Books, 2002). Originally published 1904.
18 Landes, David S., The Wealth and Poverty of Nations: Why Some Are So Rich and Some So Poor (New York: Norton, 1998).
19 Parker, Philip M., Physioeconomic (Cambridge, MA: MIT Press, 2000).
20 Diamond, Jared, Guns, Germs and Steel: The Fates of Human Society (New York: Norton, 1999).
21 Gutterman, Alan S. and Bentley J. Anderson, Intellectual Property in Global Markets Cambridge, MA: Kluwer Academic, 1997); Webster, Andrew, and Kathryn Packer, Innovation and the Intellectual Property System (Cambridge, MA: Kluwer Law International, 1996).
22 Landes, The Wealth and Poverty of Nations.
23 Freeman, Christopher, “Formal Scientific and Technical Institutions in the National System of Innovation,” in Lundvall, Bengt-Ake (Ed.) National Systems of Innovation (London: Pinter Publishers, 1992), 169–187; Daniels, P., “Research & Development, Human Capital and Trade Performance in Technology-Intensive Manufactures: A Cross-country Analysis,” Research Policy, 22, no. 3 (1993): 207–241.
24 Prahalad, C. K., Fortune at the Bottom of the Pyramid, (Upper Saddle River, NJ: Pearson, 2005); Meredith, Robyn, The Elephant and the Dragon (New York: Norton, 2007); Radjou, Navi, Jaideep Prabhu, and Simone Ahuja, Jugaad Innovation (San Francisco: Jossey-Bass, 2012).
25 PriceWaterhouseCoopers (2011) study. http://www.pwc.com/gx/en/world-2050/index.jhtml
26 Friedman, Thomas L., The World Is Flat: A Brief History of the 20th Century (New York: Farrar, Straus and Giroux, 2005).
27 Menzies, Gavin, 1421: The Year That China Discovered America (New York: HarperCollins, 2002).
28 Meredith, The Elephant and the Dragon.
29 Hawksworth, John, “The World in 2050,” PriceWaterhouseCoopers (2006). http://www.pwc.com/gx/en/world-2050/pdf/world2050emergingeconomies.pdf
30 Tellis, Prabhu, and Chandy, “Innovation of Firms Across Nations.”
31 An example of a positively valenced item is: “We have no difficulty in introducing products that are radically different from existing products in the industry.” An example of a negatively valenced item is: “Our firm rarely introduces products that are radically different from existing products in the industry.”
32 See Chapter 1.