Chapter 21
Server Testing and Maintenance
To get the most out of your servers, you need to know how well they are operating, what is "normal" behavior, and what to change when your server(s) don't operate normally. Part of good management practice is the collection of performance data because with that data you can better tune your servers, plan for upgrades, and know when to upgrade your systems.
This chapter describes some of the tools and techniques you can use to test and monitor your servers. Modern operating systems and server applications provide some powerful tools that you can use to help in this area. Performance monitoring is accomplished by using small code snippets called counters that trap and measure when system events occur. Windows, UNIX, NetWare, and other server operating systems come with a large array of counters for measuring the resource consumption of key system components, such as processors, memory, disk space, and more. Beyond simple consumption, you can also get information about the efficiency of your system, speeds, throughputs, and more. When you install a server application, it may install additional counters for you to use. You can track the results of your performance measurements by using performance monitors or by executing a number of commands from the command line.
The second area of server testing is troubleshooting, and one of the primary tools for troubleshooting is the collection and analysis of system events. In an event-driven programming environment, a system is constantly reacting to events, and a typical system may generate hundreds, if not thousands, of events each second. Many events, such as screen redraws, may not be particularly significant, but an event such as a user logon is a valuable event to record. Systems store a number of different logs you can use, including application, security, and system logs. This chapter looks at events and event logs and discusses how to get more information about logs as well as how to determine which events are significant. You can build different redundancies into your servers to get different levels of fault tolerance. By paying attention to good backup strategies and building redundancy into your servers, you can give your systems a fault tolerance that will help you survive any disaster that could conceivably happen.
Finally, this chapter presents the topic of disaster recovery. Disaster recovery involves planning and preparation, coupled with having an understanding of the kinds of things that can go wrong.
Gathering Baseline Performance Data
There are three good reasons to collect data on the baseline performance of your servers:
- To know where they've been
- To know where they are now
- To figure out where they will be sometime in the future
The only way to really know any of these three things is to have reliable data that you can use to relate one state to the other. You collect data on your servers so that you can establish a baseline—that is, a measured level of performance of that server at a point in time. A baseline study can include a number of key measurements, including the following:
- Speed—How fast key components such as your backup to disk are operating
- Consumption—How much of a resource, such as memory or disk space, is being consumed
- Throughput—The rate or speed/time of a key component such as your disk I/O or the number of messages/second that your Exchange Server sent and received
- Efficiency—The overall success the system is having at best utilizing a resource, such as your processor or the amount of data your system gets from RAM cache versus the amount of data that is retrieved from disk cache (page files)
- Availability—The percentage of time that your system is up and running or the percentage of time a database transaction succeeds
When you benchmark a server, you establish the baseline for normal performance, or what passes for normal at that particular moment. If you don't know what "normal" is, then you are hard pressed to resolve problems when your system is behaving in a manner that isn't normal. The tools used to create benchmarks and establish baselines are system and event monitors. These tools create data that is written to a log file, and you can export that log file to a standard spreadsheet or database format for further analysis.
You can use benchmarks for three tasks:
- To troubleshoot problems when they arise
- To optimize your system or a component of your system in order to get the best performance possible
- For capacity planning so that you can use trends to predict the future
Benchmarking should be part of everyday administration practice because collecting meaningful data takes a long time. Modern operating system and application vendors build into their software useful tools for benchmarking, so you don't have to look far to find a tool that will help you get started. Solaris, NetWare, Windows, and others network operating systems come with their own performance monitor and event logging applications. These tools are included because they are among the first tools that developers need when they are creating the software you will eventually use.
Most of the various performance monitors are configured for real-time analysis of a system. That is, they collect data on the CPU, disk, and so on. This occurs as often as several times a second to every few seconds so that the tools can display the current behavior of your system. Although that is useful when you want to know what's happening immediately in front of you, it is way too much data over much too short a time to be valuable when you are benchmarking your system. You need to change the default time interval in your performance monitor so that it collects only a few data points per hour so that your log file is able to maintain a meaningful record.
For most purposes, you want to collect from 1 to around 20 data points for each hour. The number you should collect is a function of how representative of the condition the instantaneous measurement you are making is. If you are measuring something that varies over the course of a day, such as email traffic, then a measurement every 10 or 15 minutes will probably be sufficient. You should measure the growth of your log file and determine how much data is stored for each data point. Knowing the frequency and the size of each data point allows you to change the default log size so that you can collect a meaningful data set without the data being overwritten.
When you are benchmarking a system, you should start a new benchmark log. Every change should also register an entry in your work diary so that you know when your system has changed and how. Significant changes include adding or removing software or hardware. Because those changes should alter your performance, creating a new benchmark log makes it easier to figure out where in the logs the changes were made. As a rule of thumb, you should consider starting a new benchmark log every time you might consider creating a restore point.
Tip
It's a good idea to start a notebook in which you put printouts of your trend and activity data over time. When it comes time to justify a server upgrade or you need to plan for additional equipment or set up a resource allocation, you have the information available at your fingertips. If your server room has gone paperless, consider using an Excel spreadsheet or other software tool (preferably a tool that allows you to create graphs).
You should consider creating a new benchmark study whenever you have upgraded your server or creating a new log for each of the additional servers added to your system. Other changes, such as switching from 100BaseT to 1000BaseT (GigE) on your network or replacing a central network switch, are also good points at which to create a new benchmark study.
Benchmarks are a little like backups. You should store a library of benchmarks for your future use, and you should preferably store those benchmarks on removable storage. Benchmarks are so valuable in planning and troubleshooting that you should protect them the same way you protect your company's documents.
Operating systems provide two major tools to measure baseline activity: counters that measure performance by trapping events and an activity log of significant events that are trapped by your operating system or server application.
You should create a baseline of the following components as a function of time:
- CPU utilization—A server's CPU utilization might run at 30% normally. All systems respond with 100% peak utilization when larger tasks are presented. However, if your server consistently runs at about 75% CPU utilization, there probably isn't enough overhead to run your system when a significant load occurs. Instead, your system will just grind to a halt.
- Cache buffer utilization—Your cache is first-level memory and can greatly improve your system's performance when needed data is found in RAM cache instead of in your system RAM or, worse, on your hard disk. A good level to aim for is when your cache buffer is around 65% to 75% of your available server memory. There's no penalty other than component cost for a larger cache, but you might find that your server's performance suffers at a level of 45%.
- File reads and writes—The amount of disk I/O is a measure of the activity of your system. If you find that you are getting an increased number of server-busy notices sent to your clients or if your I/O queue length is growing or is too high, that's an indicator of a disk I/O bottleneck and may require that you upgrade your storage system with a faster controller or a different disk or array type.
- Volume utilization—The number of drives that are allocated and no longer available for reads and writes is a measure of your server's capacity to accommodate more users, applications, and tasks. It's a useful capacity planning feature to know your disk consumption over time. Modern operating systems can run with disk utilization as high as 85% to 90%. However, when you consume this much disk capacity or more, you start to eat into your page file allocation. Therefore, when you see that your disk utilization is greater than 75%, it's a good idea to create more free space or add more storage.
Note
Much of the data stored on your servers' disks is useless information. If you run a storage resource manager to categorize your data, you will find data that is duplicated, data that belongs to users who no longer belong to your organization, old and unused files, and files such as MP3s or JPEGs that don't belong on your system.
- Processes that are running on your server (both services and applications)—It's a really good idea to create a process map that details what each process is that is running on your server, as well as a standard level of CPU utilization of each. You can view processes in Windows by using the Task Manager (by pressing Ctrl+Alt+Del) and in Linux/Solaris/UNIX by using the process –ls command. (Some operating systems use the ps command or some other utility.) When you understand which processes are legitimate, you can close any rogue processes and make rational decisions about which processes to turn off and which help your system perform better. The latter is one of the best methods for tuning a server for a particular purpose.
These five factors are the measures of the critical system resources: processing, I/O throughput, storage resources, and the standard state of your server. When we say that you need a baseline as a function of time, we mean time in two dimensions: You need to establish the variation of your server's activity as a function of your organization's standard work cycle (usually a week) and how that standard work cycle is changing over the course of months and years. That information gives you a feeling for the normal variation in system resource usage, and it allows you to determine how that variation is trending.
Using Windows Server 2003 Diagnostic Tools
Windows Server offers two primary diagnostic tools for servers: Performance Monitor and Windows Event Viewer. A third tool that you might want to use to diagnose your server is Network Monitor. All three of these tools are discussed in the following sections.
![]() For more general information on Windows 2003, see "Windows Servers," p. 758.
For more general information on Windows 2003, see "Windows Servers," p. 758.
Windows Performance Monitor
Performance Monitor is a real-time monitoring tool that offers a wide range of counters for you to monitor. The utility is offered up as a graphical tool, most often shown in strip chart form, but you can configure it in several additional ways. When you run Performance Monitor, you can save the results to a file, and those results can be useful for tuning and for benchmarking studies. Figure 21.1 shows a sample run of Performance Monitor.
Figure 21.1 A sample run of Performance Monitor.

To open Performance Monitor, do one of the following:
- Press Windows+R (or select Start, Run), enter perfmon in the dialog box that appears, and then press the Enter key.
- Select Performance from the Administrative Tools folder of your Program submenu of the Start menu.
Note
Both Windows Performance Monitor and Windows Event Viewer are self-documented tools. That is, if you select their help commands, you find a relatively complete description on how to use these tools and the various capabilities they offer.
Windows Event Viewer
Windows Event Viewer is a window into the contents of the Windows event logs, and can be view within the Microsoft Management Console (MMC). This utility shows the logs in the left pane and the events in the right pane. To open Event Viewer, do either of the following:
- Press Windows+R (or select Start, Run), enter eventvwr in the dialog box that appears, and then press the Enter key.
- Select Start, All Programs, Administrative Tools, Event Viewer.
The Event Viewer is a self-documented tool. If you open the Help system, you will find a detailed description of how to use the tool and what all the different symbols mean. In examining events, you should pay attention to not only error events but also the sequence in which events occur. The sequence of events is often an important clue as to what generated an error.
The Windows event IDs are not always well described in the Event Viewer. Therefore, you may need to consult the Microsoft Knowledge Base or one of the websites devoted to Windows events in order to decode them.
When you are finished with the Event Viewer, you can press Ctrl+F to close the program.
Windows Network Monitor
A third tool that you might want to use to diagnose your server is the Network Monitor, or netmon.
![]() For more information on Network Monitor, see "Locating Bottlenecks," p. 571.
For more information on Network Monitor, see "Locating Bottlenecks," p. 571.
To open and view the Network Monitor, do either of the following:
- Press Windows+R (or select Start, Run), enter netmon in the dialog box that appears, and then press the Enter key.
- Select Start, All Programs, Administrative Tools, Network Monitor.
With Network Monitor, you should be able to determine what the throughput levels for your NICs and determine how many errors your NIC sees. If you are getting a large number of network errors, you should follow up on it because it may indicate that you have either a configuration problem or a hardware problem. NICs sometimes fail, and when they do, they often don't just go dead—that would be too easy. When NICs fail, they get flaky first, perhaps dropping their connections at irregular intervals.
Note
If Network Monitor doesn't appear to be installed on your version of Windows Server or is missing drivers or other components, you may need to install it by using Add/Remove Software and specifying it in the Windows Components section. The version of Network Monitor found in Windows Server is not as complete as the version that ships with Windows SMS (Systems Management Server).
Windows Server 2003's diagnostic tools are a capable, if not elegant, set of utilities for establishing system and networking benchmarks. The Performance tool (formerly called the Performance Monitor) can be used to create a strip chart that records various system parameters, not only on a per-server basis but on networks as well. You can often correlate the behaviors you see with events that you see in the event log. With Network Monitor, you can correlate the network traffic you see with network performance to determine the actual types of traffic, their origins, and their target on the network.
Using Sun Solaris Diagnostic Tools
Solaris is replete with performance management tools, borrowing many from the UNIX bag of tricks and also including a few developed at Sun. Many of these tools are command-line tools, but you can find graphical utilities that you can either display the data in or redirect the data to. The following sections describe some of the most commonly used command-line tools.
![]() For more general information on Sun Solaris, see "Sun Solaris," p. 763.
For more general information on Sun Solaris, see "Sun Solaris," p. 763.
The perfmeter Command
The most obvious graphical tool is perfmeter, which is the Solaris performance monitor. Actually, perfmeter is an OpenWindows XView utility. perfmeter creates a graphical display of your system resource consumption, either in the form of a strip chart or as a set of analog dials. The following are some of the performance factors it measures:
- cpu—Percentage of CPU utilized
- pkts—Ethernet packets per second
- page—Paging activity, in pages per second
- swap—Jobs swapped per second
- intr—Interrupts per second
- disk—Disk I/O per second
- cntxt—Context switches per second
- load—Average number of processors running over the previous minute
- colls—Ethernet collisions per second detected
- errs—Errors detected in received packets per second
While perfmeter is very useful for real-time analysis and troubleshooting, other UNIX commands are more useful for logging information to a file and for creating a baseline or benchmark study.
One commonly used tool for measuring performance is the vmstat utility, which measures the use of virtual memory in a system. With vmstat you can determine how much your CPU is being utilized, the amount of disk swapping, the number of page faults, and the amount of memory usage.
The vmstat command can use the following syntax:
vmstat [-cipqsS] [disks] [interval[count]]
You can use a number of switches with the vmstat command to get useful output, including the following:
- -c—Reports the cache flushing. This switch is now obsolete.
- -I—Reports the number of interrupts per device.
- -p—Reports the paging activity. A variety of paging actions can be specified.
- -q—Does not report messages that the system generates during a state change.
- -s—Reports the number of system events since the system boot.
- -S—Reports the amount of disk swapping.
- count—Reports the number of times that your specified switches are repeated.
- disks—Lets you determine which disks are measured.
- interval—Reports the time period, in seconds, that vmstat runs its statistics.
For a more detailed explanation of the vmstat command, see the Solaris man pages at http://docs.sun.com/app/docs/doc/816-5166/6mbb1kqjv?a=view.
The mpstat Command
The second performance command you can use to measure processor performance in a multiprocessor Solaris system is mpstat. The syntax of this command is as follows:
/usr/bin/mpstat [-a] [-p| -P set] [interval [ count]]
The mpstat command returns a table of results of processor statistics. Each row in the table represents a single processor, and each column represents a different processor performance attribute. For a more detailed explanation of the mpstat command, you can view the Solaris man pages at http://docs.sun.com/app/docs/doc/816-5166/6mbb1kqjv?a=view.
Note
Keep in mind that there are often slight, and in rare cases significant, differences in the command syntax and the options and switches available in commands in different versions of UNIX.
With mpstat, each processor is listed consecutively, and the command provides information on a number of factors. You can see your overall processor load, the number of interrupts used on each processor, the amount of processor time being used by each user, and how long each processor had to wait while an I/O was in progress. In a typical mpstat table, you might see the follow columns:
- minf—Minor faults
- mjf—Major faults
- xcal—Interprocessor cross-calls
- intr—Interrupts
- ithr—Interrupts as threads
- csw—Context switches
- icsw—Involuntary context switches
- mig—Thread migrations to a different processor
- smtx—Spins on mutexes or locks not acquired on first attempt
- srw—Spins on reader/writers locks or locks not acquired on the first try
- syscl—System calls
- usr—Percentage of user time
- sys—Percentage of system time
- wt—Percentage of wait time
- idl—Percentage of idle time
Which of these columns you see depends on what options and switches you used with the mpstat command.
When you see a large difference in interrupts between processors—say a couple thousand—you can redistribute the load by moving your add-in cards around. The time a processor spends servicing a user's process should be around 85%. You should also see that the amount of time any processor has to wait should be less than around 20%. If you see that the processor spends more than 40% of its time waiting for an I/O operation to complete, you have a bottleneck in your I/O system.
The iostat Command
Yet another command-line utility is iostat (see http://docs.sun.com/app/docs/doc/816-0211/6m6nc6715?a=view), which measures the efficiency of a system's I/O. With iostat, you see a combined summary of activity in the first column, as you do with both vmstat and mpstat. The information listed is the activity since the last time your system started up, which is also true for vmstat and mpstat. The most valuable columns in the iostat command output are wait, actv, %b, and svc_t. Those columns describe the number of requests for disk writes in the queue, the number of requests pending in the disk volume, how busy the disk is in terms of a percentage, and the time it takes, in milliseconds, for any I/O request to be taken out of the queue and be processed.
Note
Each of the three commands vmstat, mpstat, and iostat is fully documented in the Solaris man files, and each has a number of switches that can modify the output of the command.
The proc Command
If you want to see what is actually using your system, then you should run a variant of the proc, or process, command. You can also see just the processes with the highest utilization by using the top command. There are three common uses of the proc command:
- % ps -eo pid, pcpu, args | sort +1n—This command lists processes with the greatest CPU utilization
- % ps -eo pid, vsz, args | sort +1n—This command lists processes with the greatest memory allocation
- % /usr/ucb/ps aux |more—This command lists processes that have both the highest CPU utilization and memory allocation.
You will probably find that you need to use the | pipe in order to freeze the screen one screen at a time. The output of the proc command can be quite long and will scroll off your screen if you don't use |.
The sar Command
Solaris has a command that can collect system information. The sar, or system activity report, command is turned off by default and must be enabled. You follow these steps to enable sar:
- Open the crontab entries for the user sys.
- Uncomment the entries for that user.
- Open the /etc/init.d/perf file and uncomment the lines in that file.
- Execute the script /etc/init.d/perf from the command line or do so after your system reboots to get a full listing of a complete system session.
The sar command writes the data it collects into a set of files created daily and located at var/adm/sa. The files are consecutively numbered saxx, where xx is the day of the month. Unless you remove files that are a month old, they get overwritten by new files. sar output contains information that you can use to benchmark your system. Check the man page for sar for information on how to set the interval between data points, as found at http://docs.sun.com/app/docs/doc/816-5165/6mbb0m9rc?a=view.
Using NetWare Diagnostic Tools
On a NetWare server running ZENworks, you can set the threshold values for services in ConsoleOne and identify trends. You can also modify server files by using the Management Agent for NetWare or by using the Management Agent for Windows. Server agents record the initial values for thresholds and trends when they are installed. Whenever you add a new object to be monitored, NetWare creates a new trend file. You can view the trends in the NTREND.INI file.
When the management agents are running, you can use ConsoleOne to modify both the threshold and trend values. If your server reboots, ZENworks reestablishes the trends and thresholds, using the last values in the trend files. If the trend files are deleted or if a new monitored component is added to the server, the initial threshold and trends are reestablished.
The trend file for NetWare is NTREND.INI, and the trend file for Windows is N_NTTREN.INI. The trend value sets the sample interval, which is the amount of time that goes by for which data is kept. A collection of trend data is called a trend bucket, and each line in the file is a separate data point. ZENworks allows you to alter the sample interval, enable or disable a trend file, and use a backup function to copy out your trend data. You should generally set a trend bucket to the length of your organization's standard work cycle.
The following are some of the server management tasks that ZENworks for Servers (ZfS) offers:
- Getting server configuration information
- Getting summary data
- Trending data
- Altering sampling parameters
- Altering server's operational settings
- Issuing server commands
ConsoleOne is similar to the MMC in terms of its organization. A two-panel window shows organizational or summary information on the left pane and detailed information in the right pane.
Using Third-Party Benchmarking Tools
Using benchmarking tools is a way to establish the relative performance of one system or platform against that of another. All sorts of benchmarks are available for you to measure server performance. Some tests are hardware-only measurements, while others measure a server running a particular operating system or an operating system/application coupling. Many benchmarks are free and easy to deploy, and others are costly both to purchase and to test against.
There are many open and freely available benchmarks, some of which are distributed by industry standards groups such as SPEC, TPC, and Mindspring. As benchmarks get older, they are often released into the public domain either because the group sponsoring them has lost interest in them, gone defunct, or made the benchmark obsolete by producing another (usually more complex) test.
You can find benchmarks that have been created by testing organizations, such as Ziff Davis's NetBench, ServerBench, and WebBench tests. Some very useful benchmarking tests are created by operating system vendors to help OEMs test their systems for capacity planning; Microsoft's MAPI Messaging Benchmark (MMB3) is an example. With an MMB3 workload for the LoadSim 20003 Exchange test suite (see www.microsoft.com/exchange/evaluation/performance/mmb3.mspx), it is possible to benchmark one Exchange server against another. Another example from Microsoft is the inetload tool for testing Web, proxy, caching, directory services, and messaging over Internet servers. Another test from Microsoft is the WCAT test. Table 21.1 lists some of the most commonly used server benchmarks.
Table 21.1 Server Benchmarking Tools

Benchmarking is best done when you are comparing two or more systems under identical conditions. Most frequently, however, that is not the case. Moving from platform to platform, moving from application to application, and dealing with equipment modifications, even when they are minor, can skew the results of a benchmark toward one vendor or another. Therefore, several industry standards groups were formed to create tests that could be developed over time, lead to meaningful comparisons, and be policed when necessary. The following sections take a look at three of these standards and testing organizations: SPEC, TPC, and Mindcraft.
SPEC
The SPEC benchmarks (see www.spec.org) are a set of standardized tests that measure systems under what are meant to be real-world testing conditions. SPEC was originally formed as a cooperative in 1988 by several workstation vendors, and later it spun off as an independent corporation called the Standard Performance Evaluation Corporation. The goal of the SPEC tests, which are constantly under revision, is to establish a standard code base that allows different operating systems running on different equipment to be measured in a meaningful way, one against another. Most often you see SPEC benchmark results described for very high-end workstations, servers, and even supercomputers in an effort to set the performance record for a particular SPEC benchmark. SPEC benchmarks not only measure system performance, but they often set standards for price/performance standards as well. That's why companies like to quote the different SPEC results in their marketing information when it suits their purposes.
There are currently SPEC benchmarks for the following systems and components:
- CPU—The CPU2000 benchmark measures the performance of a processor for floating-point operations. The CINT2000 test measures straight integer performance.
- Graphics/applications—SPEC has a set of six different graphics tests that measure a variety of operations: vector and bitmapped drawing, 3D rendering, shading, and others.
- High Performance Computing, OpenMP, and MPI—These benchmarks are aimed at measuring the performance of large systems running enterprise applications, where the advantages of a parallel or distributed architecture can make a meaningful contribution to performance. MPI is a standard based on a Message Passing Interface application.
- Java client/server—Three main Java tests run specific Java applets or applications in a client/server environment: jAppServer2004, JBB2005, and JVM98 (some older variations exist). The JBB2005 benchmark measures a Java business application where an order-processing application of a wholesale supplier is set up and measured on a Java Virtual Machine (JVM).
- Mail servers—The MAIL2001 benchmark measures the performance of a mail server to send and receive SMTP and POP3 mail. Throughput and response are measured under standard client mail workloads, with specified network connections and disk storage systems. The SPECimap benchmark measures IMAPI servers that run the SMTP and IMAP4 protocols.
- Network file systems—This SFS97 benchmark, now at version 3.0, measures the performance of a network file server running NFS.
- Webservers—The latest benchmark in this area is the WEB2005 test, which sends HTTP GET requests for both JSP and PHP pages over a broadband connection. There are work loads that measure a banking site using HTTPS, an e-commerce site using HTTP/HTTPS, and a help desk site using standard HTTP. Older versions of this standard, such as WEB99, measured straight client/server throughput, and the WEB99_SSL standard used the SSL protocol.
The purchase price of SPEC benchmarks ranges from around $100 up to as much as $2,000. The disparity in pricing is due to the complexity of the work necessary to both create the benchmark as well as the personnel and equipment needed to verify compliance of the results.
The problem with the SPEC benchmarks has been that they allow vendors to implement the tests in ways that favor their particular systems and thus they aren't as standardized as they might seem. However, this is by design. SPEC endeavors to allow vendors the freedom to run the benchmarks in a way that allows them to demonstrate the advantages of their system. So although the SPEC benchmark uses standard source code that is based on existing applications that have already been created by members of the organizations, it is up to the benchmarker to take the benchmark, compile the source code, and tune its system to obtain the best results. Thus there are inherent differences between test results.
To consider how benchmarking might work, consider a test based on a specific webserver such as Apache. Apache exists on most major operating system platforms, and certainly on any of the ones you are likely to consider working with if you are reading this book. Although Apache's code is the same in any case, when you compile it for Linux, Solaris, HP-UX, or even Windows, you get different versions of the software. Even the compiler you use can make a slight difference in performance. That's the first level of differences. In addition, each vendor can tune its system so that it provides the best performance possible for that particular application. So if one vendor is smarter than another in how it tunes its disk system, that's yet another advantage. SPEC is replete with these potential advantages and disadvantages.
Still, SPEC measures systems by using standard applications, and the results that vendors get are real results. So even if one vendor is able to achieve a new benchmark standard, that benchmark is a legitimate performance measurement. SPEC publishes several hundred of its members' benchmark results every year.
TPC
The Transaction Processing Performance Council (TPC; see www.tpc.org) is an industry group that consists of nearly all the major server vendors. The tests that TPC sponsors focus on transaction processing and database benchmarks. These tests define a set of transactions that would be of interest to a business. The kind of transactions the tests create are meant to be similar to the ones you create when you withdrew money from a checking account at an ATM. Similar types of transactions are used to update a database system when you make an airline reservation or when a warehouse ships or purchases inventory items.
In many large-scale enterprise deployments, TPC benchmarks are often requested. This is because TPC benchmarks simulate actual deployments and let a buyer evaluate a system as a whole rather than one subsystem at a time. Large government and corporate projects often request these tests for their larger systems, so many of the TPC benchmarks that are run are never published or publicized. In these instances, the vendor running the benchmark may choose to customize the benchmark to make it more suitable for the project that is being evaluated. As you might imagine, it's relatively easy for vendors to modify the TPC tests in ways that give their systems an unfair advantage over other vendors. The TPC has established a fair-use policy as well as an audit process to make sure that its benchmarks aren't misused.
The TPC sponsors four main benchmarks:
- TCP-App—The TCP-App benchmark sets up a test platform using application servers and a web service. It uses applications that are commercially available, including messaging servers and databases such as Exchange, Domino, SQL Server, and Oracle. A client workload is generated against this system so that the performance of multiple sessions in a managed environment can be measured. TCP-App sessions try to make use of the latest technologies, so XML documents and SOAP are used for data exchange, and transactions are managed in a multitiered distributed architecture. The databases used have a variety of tables and relationships, and their integrity (that is, ACID properties) is also established.
- TCP-C—TPC-C v5 is one of the most well known of all the large server benchmarks. TPC-C was first established in 1992, and it has been the standard measurement for large-scale online transaction processing (OLTP). The TPC-C benchmark creates a complex database that simulates an order-entry system against which a large number of users create several kinds of transactions, such as orders, payments, status checks, and warehouse management functions. This is exactly the kind of system that enterprise management systems or enterprise resource planning (ERP) applications such as SAP/R3, PeopleSoft, Oracle Applications, and others are meant to address. TPC-C benchmarks give two results: one that measures performance in tpm-C (transactions per minute) and one that measures the price performance in $/tpm-C. Thus vendors quote success in TPC-C benchmarks for each of these two different factors.
- TCP-H—The TCP-H benchmark is an ad hoc decision support database that allows users to generate queries against the database and make modifications based on the results. The results of this benchmark are expressed in terms of the TPC-H price/performance measurement and expressed in terms of $/QphH@Size (query per hour at a certain database size).
- TCP-W—TPC-W is a web e-commerce benchmark application. In this benchmark, a transactional webserver application is subjected to a transactional load, using standard TCP/IP transport and browsers. The environment generates on-the-fly, dynamic, data-driven web pages against a complex database system where transaction integrity must be maintained and where there is contention for access to the database as well as for data modifications. The result of the TPC-W benchmark is expressed in terms of a shopping metric (WIPS), a browsing metric (WIPSb), and a web-based order-entry metric (WIPSo). When all these are measured, the result leads to the overall measure of the WIPS rate and its associated price/performance measure of $/WIPS, which is the actual quoted benchmark. A new version of TCP-W is in development.
Note
To view the top 10 results for each of the TPC benchmarks, go to www.tpc.org/information/results.asp.
TPC tests are often very involved affairs; not only are the tests relatively expensive to buy, but they can be very expensive to run. Vendors sometimes stage tests with million-dollar pieces of equipment, so it's not unheard of for some of the more involved tests, such as data warehousing tests, to run into six figures or more. However, when a server vendor is trying to sell a top-level business manager on a system that will run a significant part of his or her business—and often a mission-critical part—many vendors believe it is well worth spending the money.
Mindcraft
Mindcraft (see www.mindcraft.com) is an independent testing laboratory that was created in 1985 by people already involved with SPEC. Mindcraft does both contract benchmark testing and creates its own benchmarks. Among the tests that Mindcraft has developed are the following:
- DirectoryMark—This is a test for the performance of Active Directory on both Windows Server 2003 and Windows Server 2000 domain servers, as well as Active Directory running on an application server. This test is available for free download, as is its source code, and it's available for both Windows and Solaris servers. This benchmark measures the performance of a server that is running a Lightweight Directory Access Protocol (LDAP) 3 sever. Data is transferred in LDIF format, and it is possible for vendors running this benchmark to create their own special scripts that execute the kinds of directory transactions that their systems will use.
- AuthMark—This benchmark tests products that authenticate access to web-based products. One simulation tested is called the Login scenario, which measures how long it takes for a user to request and download a web page from a secure webserver. The second tested configuration, called the Extranet scenario, has a login scenario that measures the time it takes external users (for example, customers or suppliers) to request and get information from a private website. These two scenarios are measured under different loads.
- iLOAD MVP—This tool creates loading for systems being benchmarked. The tool can be used not only for benchmarking but also for capacity planning, and it can also be used as a regression testing tool.
- WebStone—This is probably the best known of Mindcraft's tests. WebStone 2.5 is downloadable for free from Mindcraft's website, as is its source code. The WebStone benchmark was first developed by Silicon Graphics to measure their systems' performance as webservers. Mindcraft acquired the rights to the benchmark from Silicon Graphics and has enhanced the tests and modified the workloads that the WebStone test runs. The benchmark places a client load on a webserver, which requests (through HTTP commands) that pages and files be returned to clients' browsers. The test provides performance data for how well HTML commands are processed, how fast CGI scripts run, and how well the webserver's API performs as a function of load. Mindscape has WebStone running on Microsoft Internet Information Server's (IIS's) ISAPI and Netscape's NSAPI.
Mindcraft has become the repository of a number of older benchmarking standards that the company continues to develop. Several of these benchmarks are available in an open standard format, meaning that both the application and the source code are available for download.
Routine Maintenance
Servers are meant to run without much attention the great majority of the time. Therefore, you might think that there isn't much regular maintenance involved. That's largely true, but there are tasks that you need to do on a regular basis in order to protect your data. As your server chugs along, you have to pay attention to its status by doing a regular reading of the server's vital signs, its performance trends, and its event logs.
When it's time to do routine maintenance on your server, chances are that the work will disrupt the service that the server is doing for your clients/users. This results in the dreaded "Server is down for maintenance" message. Timing and notice are, of course, important. You should notify all users with reasonable notice prior to bringing down any essential service. Given how busy people are these days, it's not a bad idea to start giving daily notices about a week prior to maintenance. On the day of maintenance, you should probably post a couple notices during the day.
There's some contention about when is the best time to perform server maintenance. Most people recommend after-hours, and often late at night, because that will affect the fewest people. Many people recommend doing maintenance on Friday and Saturday nights because if something goes wrong, you still have at least one weekend day to fix the problem before the work week begins. A minority recommendation is that Monday nights are the best time because if there is a problem, you are in the beginning of a work week, and you have additional help and service resources available to you to fix the problem.
Backup and replication are probably the most important pieces of routine maintenance. With modern server technologies, you shouldn't have to bring a server offline to perform a backup. However, a backup will affect your server's performance. Therefore, you should also do backup and replication at low-activity time.
The sections that follow look at a few additional routine maintenance tasks:
- Drive and media testing
- Routine cleaning
- Virus and spyware checking
- Disk defragmentation
Drive Testing
If your server starts to experience read or write errors, or if you see stop errors from the operating system or random weird behavior, it's not a bad idea to test your hard drives to see if there is a problem with a drive or with some portion of it. In a high-end RAID or storage solution, diagnostic software is usually included as part of the package. If you are lucky, that software runs in the background or runs periodically. However, you might need to run such a utility manually.
All modern operating systems ship with a diagnostic disk utility for testing a drive, the file system that's on it, and the data structures contained on the drive, such as indexes. Because your operating system actually formats the disk, writes the file system, and writes the files, it's a good idea to start drive testing by using the tools that the operating system supplies.
It's good practice to run a disk checking utility from time to time because even if you aren't experiencing a problem at the moment, the utility can find damaged sectors and mark them so that they can't damage future files or I/O. It may take a while to do a disk check on a large drive, so it's best to perform these tasks at time of low workload. Also, if your system is highly available, you may have to remove the volume to test your drives, and despite the hassle, you should do so from time to time. Let's briefly look at a couple of examples of how this is done, first with Windows Server 2003 and then with Sun Solaris.
Checking a Disk in Windows Server 2003
When Windows uses a hard drive, particularly a system drive, it puts a lock on the drive, preventing it from being low-level tested on a bit-by-bit basis. The original DOS CHKDSK disk checking utility was modified in Windows and is now called Check Disk. However, just like CHKDSK, Check Disk has to be run from outside Windows on an unmounted volume. It's most often run at startup.
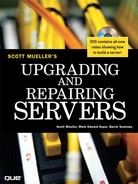
You run Check Disk by doing the following:
- Open My Computer, right-click the drive to be tested, and then select Properties.
- Click the Tools tab and then click the Check Now button in the Error Testing section. The Check Disk dialog box appears, as shown in Figure 21.2.
Figure 21.2 The Check Disk dialog box shown in Windows Server 2003.
- Click on both the Automatically Fix File System Errors and the Scan for and Attempt Recovery of Bad Sectors check boxes and then click OK.
- When the Check Disk utility posts a dialog box, asking you if you would like to schedule the check when Windows next restarts, click Yes.
- Close all dialog boxes and restart your system. Scanning a large drive can take some time, so it's best left for periods when the system will be lightly used, if at all.
Note
In the Windows 2000 operating system, the Check Disk utility is referred to as ScanDisk.
Checking a Disk in Sun Solaris
With Sun Solaris, the disk check utility fsck is rather similar to its Windows equivalent. It is fully documented in the Solaris man pages, and you can find its procedure for use at www.cs.manchester.ac.uk/solaris/sun_docs/C/solaris_9/SUNWaadm/SYSADV1/p145.html#FSTROUBLEFSCK-28. In a nutshell, fsck checks the file system for data integrity. The drive being tested needs to be unmounted, and some file systems aren't supported. (However, UFS is supported.) fsck can be used with a number of switches, and those switches differ, depending on the version of UNIX you use.
One good utility for disk repairs and testing is Gibson Research's SpinRite 6.0 (see http://grc.com/spinrite.htm). This utility finds bad sectors, predicts the ones that are likely to fail, reads the data out of that region, and then marks off the problem areas. SpinRite is a replacement for the original DOS CHKDSK command and does a read-only surface scan when run. ScanDisk also does a read-only scan and can mark off a bad sector, but SpinRite does data pattern testing, defect scrubbing, data relocation, and sector repair and recovery in addition. At a price around $100, SpinRite pays for itself many times over and works with Windows, Linux, and other file systems.
When a disk starts to fail, you should start to see more read and write errors in your event log. It's a good idea to set up an alert system so that when one of these factors starts to increase beyond what's normal, you get a message. At that point, you should run your standard disk diagnostics and make sure that your backups are in good order.
Disk checking utilities have some significant limitations. For one thing, they don't work on a mounted volume. Also, they work only on drives that your operating system manages. Your operating system cannot perform a low-level disk check on any drive attached to a disk controller. For those types of disks, you need to use a compatible utility. SpinRite, for example, can work with some RAID 0 or RAID 1 configurations, where the RAID is an on-board chip and isn't managed by its own processor. As a general rule, SpinRite's maker says that if DOS can recognize a RAID volume, then SpinRite can check that volume. Chances are that any controller you buy has an on-board processor on it.
Defragmentation
Disk defragmentation is among the most common tasks that administrators perform. Although you can experience measurable performance improvement when you defragment a single user's single-disk workstation, when you move to a server with multiple users running software on multiple disks, the benefit of disk defragmentation becomes less apparent. Most servers run RAID configurations that stripe their files across several disks, and multiple heads access those disks to satisfy a complex workload, so rearranging files to make them contiguous doesn't have a lot of impact.
Note
Keep in mind that when you copy a disk's contents to another location on a file-oriented—or file-by-file—basis, the target system is automatically defragmented. This is not true of a bit-level or XCOPY operation, where each bit is copied bit-by-bit and each sector is copied sector-by-sector. In that case, the fragmentation is preserved. Server backup programs fall under both categories: file oriented and bit oriented. If you do a file-level backup, you end up with a defragmented disk if you did a disk-to-disk copy. If you have backed up to tape, then a restore from tape will also result in a defragmented disk.
In studies of server systems running older versions of Windows server systems, system performance improvements of between 7% and 11% have been achieved. That's not insignificant, but it isn't dramatic either. When many more disks are involved, the performance improvement is even smaller. Still, there is little downside to defragging your disk system other than the load that the operation places on your system: When you perform the operation at a time of low activity (at night, for example), the benefits justify the effort.
Keep in mind that most defragmentation tools need to have 15% of the drive free in order to perform a defragmentation.
Antivirus and Firewall Software and Systems
Unfortunately, it has become necessary to deploy antivirus software at several levels in the enterprise. Antivirus software should be costed into any server deployment and should be on virtually every computer on your network.
Many analysts believe the following:
- General antivirus server software should be deployed at all firewalls (perimeter protection). The best protection is achieved using software that provides virus scanning capability and enforces a set of policy rules. When an antivirus software program scans a system's files, it is looking for the signatures of known viruses. Those signatures can be code snippets, registry entries, filenames, file types, file locations, and so forth.
- Domain servers should be locked down as much a possible.
- Application servers should run specialized antivirus software that may be effective in preventing viruses from attacking that type of application. Antivirus vendors sell specialized software for messaging applications such as Exchange and Domino; databases such as SQL Server, Oracle, and DB2; complete office solutions such as Microsoft Small Business Server; and so forth.
- Antivirus software and personal firewalls should be installed on desktops and workstations. It's important to keep this software up-to-date so that it can detect current threats and so its scanning protection is enabled.
- Antivirus software and personal firewalls must be installed on laptops, handheld PDAs, and networked wireless devices, as well as any traveling systems.
This four-pronged approach to virus management is illustrated in Figure 21.3.
Figure 21.3 Antivirus software should be deployed at several layers of a network in order to provide protection from attack from without and attack from within.
The two most important places to stop viruses and spyware are at the firewall and at the desktop. If you can stop viruses and spyware before they gain entry to your network, you can save your systems from performing a lot of extra work. The desktop is also very important because it is impossible to stop 100% of all threats; mistakes and accidents happen. By being vigilant at the client level, you can catch problems before they make it through to the entire network.
In the past, most large ISPs considered virus and spyware protection to be something that their clients must do, and not the responsibility of the ISP itself. However, as the industry has matured and become even more competitive, many ISPs are now offering virus and spyware protection tools as part of their standard packages—to businesses as well as to consumers. Some companies offer a prescanning service either by redirecting traffic through their servers or as part of their hosting package. It's worth seeking out this additional protection.
It's useless to spend large sums of money installing antivirus software on servers if you don't install the appropriate firewalls that allow a worm or Trojan Horse to gain access to your system through a back door. Similarly, it is useless to position firewalls and antivirus software on your servers to protect the front end of your network if you have mobile systems that can propagate viruses and other malware when they are reattached to your network. Failure to protect mobile systems is one of the major errors many companies make when they implement security systems. (Failure to properly back up mobile systems is another issue that doesn't get enough attention from network administrators.)
Antivirus software and firewalls that use a packet-sniffing approach have two cost components. The first cost is the up-front cost of the software and the yearly subscription costs for servers and clients. The second cost, one that most people don't account for, is the reduction in server performance for any server that is forced to run this type of software. You can figure that antivirus software will reduce your server's performance anywhere from 5% to 15% in most cases. However, when you are under attack, you may find that your antivirus software's consumption of server resources goes up dramatically.
Note
One common method for virus propagation is through network shares. When some viruses detect a network share that they can copy themselves, they take full advantage of the opportunity. Propagation of the virus then proceeds when the virus searches for other network shares and copies executable software to those directories. When you set your shares' permissions, you should make this type of propagation mechanism difficult or impossible.
Rather than just guess, it's a good idea to measure the impact of your antivirus software by using a performance monitoring tool to gauge the increase in activity for your CPU(s), the increased memory usage, and, to a much lesser degree, disk I/O. Keep in mind that unusual situations occur when you are under attack. If you are experiencing an attack of an email worm or mass mailing, your messaging server's antivirus software may consume considerably more resources than it would under normal conditions.
More and more appliances are becoming available for front-end networks and server systems. Few companies put their most significant firewalls on their application or domain servers these days. The trend toward self-contained appliances probably means that more products will move their antivirus programs off servers. In fact, many higher-end firewalls also come with antivirus software that is either built in or can be activated with payment of an additional fee. If you deploy a system like that, be sure that your firewall's antivirus program doesn't interfere with anything you are deploying on workstations, desktops, or laptops. Often firewalls download client antivirus software (and in some cases, firewall clients as well), and they can interfere with other products. It's good to test these issues before you commit to a vendor's product.
Keeping Case Fans and Filters Clean
Very little attention is paid to keeping servers clean inside. For the most part, you can get away with negligence because modern electronics are often sealed devices and relatively impervious to dust. However, neglecting to keep a server clean may get you in trouble when you write to an optical disc inside the server, where a dust particle can interfere with the laser that is writing to the disc. Other components, particularly mechanical components, can fail. Also, dirty heat sinks aren't nearly as effective as clean surfaces at shedding heat.
The heat modern processors throw off is truly amazing. In demonstrations, people have cooked eggs on working processors. That may not be something you actually want to do, but it does speak to the temperatures involved. You only have to consider Intel's BTX replacement platform for the ATX casing, what Intel refers to as the "heat advantaged chassis." In the BTX form factor–compliant cases, large (massive?) heat sinks sit on top of the processors and pull air in from outside the case to cool the processor.
Very few modern cases and fans filter the air coming into the case. You can dramatically lower the amount of dust and dirt in a system if you follow these simple rules:
- Make sure your air flows in one direction. Systems usually have air flowing from the front of the case to the back of the case, with fans blowing in at the entrance point and fans blowing out at the exit point.
- Close all holes in the case that don't have significant airflow out of them. Don't leave the opening of an expansion slot uncovered, for example.
- Place filters so that all air coming into the system is filtered.
Filtered fans can be a little hard to find, and many server OEMs don't go to the trouble to use them. Still, it's worth the effort to add them. You can find fan filters at a number of online stores because they tend to be popular with gamers. A filter is a flat panel that screws onto the outside of your case, in front of the fan.
Tip
To filter incoming air in a low-cost way, consider cutting out an appropriate-sized cardboard frame and then gluing to it a cut piece of nylon panty hose. Don't stretch the nylon when you are fitting it to the frame; it's a more effective filter when the pores are smaller sized.
When you're adding fans to a server case or replacing a stock heat sink or CPU cooler, size matters. Bigger fans can move more air, even when they rotate more slowly than smaller fans. Therefore, bigger fans are quieter. Similarly, bigger heat sinks can absorb more heat, and they can shed more heat than smaller heat sinks. When looking for high-efficiency cooling solutions for CPUs, you should try to mate the two: large heat sinks with large but slower-moving fans. For sound absorption, you can get good (but not great) results by adding to systems sound absorption panels from manufacturers such as Asaka.
At some point, you need to open your server and physically remove the dust that has accumulated inside it. The best way to do this is by using a canister of compressed gas specifically sold for dust removal. This canister should come with a long plastic tube spout that can be aimed into cramped spaces. It's important that the product you use leaves no residue. To see whether your compressed gas leaves a residue, spray it on a very clean piece of glass or a clean window and observe whether a film or particles are left behind. If the product you are considering using leaves a residue, you should replace it immediately with a better dust removal product.
When you are dusting out your case, it is fine to vigorously dust nonmechanical parts. Memory, hard drives, and other components aren't likely to be displaced or damaged by a stream of gas, and because they are enclosed, they can't be damaged. However, you should make sure you don't displace a wire or connection. More importantly, if you aim a stream of compressed air into a mechanism that is open, such as the door of a floppy disk drive, you can cause the drive to malfunction.
When you are trying to remove dust from a server, you need to be extremely careful when you are trying to clean an optical or mechanical drive. DVDs, CD-ROMs, tape drives, and floppy disk drives, among other components, contain delicate internal equipment such as aligned laser heads that can be damaged or misaligned if disturbed too vigorously. You should therefore clean internal drives like these with products that are designed for them. You can find tape cleaning cartridges for all types of tape drives, specially designed optical disks for cleaning CD/DVD drives, and so forth.
Error Logging and Tracking
In the event-driven programming environments that are a feature of all modern network operating systems, event logging is a standard capability. Not only does the operating system log events, but so do major server applications, which log events in their own proprietary logs. Events can be either hardware or software related, or they can be a function of both. The following kinds of events are stored in event logs:
- Error condition
- Alert or warning issued
- Status update
- Successful monitored condition
- Unsuccessful monitored condition
Event logging imposes a certain amount of overhead on a server and on the applications that run on it. That's why many of the logging capabilities of a network operating system or a server application are not used. In some cases, entire logs are always on by default; this is the case with Windows Server logs. In other cases, you have to explicitly turn on logging; for example, you might have to do this with an application log.
The snippets of software code used to trap events and record their existence are called counters. Counters are available to measure CPU utilization, the number of active processing threads, aspects of memory usage, and on and on. When you install an application, you may install with it a whole new set of counters, many of which aren't activated by default. If you logged all the counters that were actually available to log, the overhead would slow your system to a crawl. Therefore, many counters are left off by default.
One set of counters you have to turn on is the Windows server disk counters in Windows 2000; they are turned off by default in that operating system because using them affects disk I/O performance.
To turn on the disk performance counters in Windows Server 2000, you do the following:
- Select Start, Run, enter cmd in the dialog box that appears, and then press Enter.
- Enter the command diskperf –ye for standard IDE or SATA drives, or enter diskperf –ye for software RAID and mirrored drives. (Note that hardware RAID is not affected by this command.)
Note
The diskperf disk counters are turned on in Windows Server 2003 by default.
- Open the Windows Performance Monitor by entering perfmon in the Command window and then press Enter.
- Verify that the disk performance counters are now available from the list of counters.
Different operating systems and different applications offer additional counters that are turned on (and off) either using command-line tools or through the use of graphical interface tools. You need to consult those products' documentation for details.
The Purpose of Event Logging
The purpose of event logging is to provide a means of analyzing the state of your system as well as provide you with a historical record of the system's performance. When you examine an event log, you see the type of events listed, and each event is identified by its source and some kind of an ID number. The sequence of events is often a key to understanding why something on your system doesn't work properly or how you can change your system to make it perform better. Many people turn to event logs when things go wrong.
Typical scenarios where you would want to examine your event logs include the following:
- Hardware failure—If you are experiencing problems such as an intermittent network connection or a disk error, you should check your event logs.
- System performance issues—If your system or application doesn't seem to run as well as it should, and you suspect some kind of resource issue such as a memory leak or errant daemon, you should check your event logs.
- Security issue—If you want to check who has logged on to your network or one particular server or who has logged on to a database application, you should check your event logs.
- Resource access—If you have a network share that can't be accessed and you want to find out whether the issue is a permissions problem, hardware problem, or some other issue, you should check your event logs.
- State of an application—If you initiated a system backup and want to know how long it took and whether it is finished, you should check your event logs.
As you can see, event logs can be very useful even when your system seems to be running correctly.
Proper analysis of your event logs can offer you all sorts of valuable information; they are veritable gold mines of information. And that's the real problem: With so many recordable events that it is possible to record, it is hard to keep track of them all, correlate them with behavior, manage the information they contain, and, most importantly, figure out which event has particular significance. No wonder the area of event analysis and management has given rise to a whole host of management tools that monitor events, collect events, analyze events, alert you when an event occurs, and more.
Many events just keep on happening. When your mouse button sticks, it sticks. If your event log records MouseDown events, your log is going to be getting a lot of MouseDown events to record. Chances are that you only need to see a few of these events to figure out the cause.
Many network, network operating system, and application operations repeat themselves. Give a command, and chances are that if it doesn't successfully complete, the application will continue to execute the command, if only to determine whether the resource required is simply busy and not permanently unavailable. When you examine an event log, you should see that it is loaded with large numbers of similar events, and this can be overwhelming at first. Any event log or product that manages events requires a good search filter utility to aid in finding events of interest. Smart products must be able to differentiate between multiple instances of the same event and related events that occur in an escalating chain. Understanding the relationships is one of the best troubleshooting tools for a server administrator.
You need to keep in mind that event logs of operating systems and event logs of applications are almost always in different formats. In most instances, you can export all event logs to database files and then analyze them in a database. However, when you try to pull all the information from multiple sources, you may find that you can't because all the different data isn't organized in the same way. Therefore, to work with the combined data from multiple event logs coming from different sources, you need to do considerable work up front to make the data compatible. This is an area where you need to rely on third-party tools to help you out, such as Kane Security Analyst's Event Log Analyzer Tool. One tool you can try is Microsoft's free LogParser 2.0, which is a command-line utility that lets you execute a SQL query against an event log file.
Event Logs
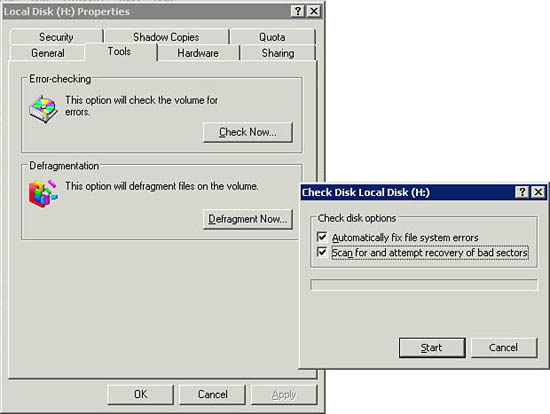
The Windows Server 2003/2000 operating system comes with several different event logs that system administrators can use. Which logs exist depends on the type of Windows server you have. All Windows servers come with three logs, and additional event logs are maintained for domain and DNS servers. Figure 21.4 shows the Windows Event Viewer.
Figure 21.4 The Windows Event Viewer.
These are the standard system logs for Windows servers:
- Application log (AppEvent.evt)—This log, found on all Windows servers, contains information for all counters that applications install and all others that they enable.
- Directory Service log (NTDS.evt)—This log, found on Windows domain controllers only, records the events associated with the Windows Active Directory service.
- DNS Server log (DnsEvent.evt)—This log is found on all DNS servers, whether they are domain servers, application servers, or even standalone servers.
- File Replication log (NtFrs.evt)—This log, found only on Windows domain servers, records replication events associated with domain controllers.
- Security log (SecEvent.evt)—This log, found on all Windows servers, contains information that is set by the Windows security audit policies.
- System log (SysEvent.evt)—This log, found on all Windows servers, contains information about the operating system and hardware components.
To view any of the specific log files, you should look for them located in your Windows directory, at %systemroot%system32config.
By default, the Windows event logs maintain a fairly small log size and overwrite older events on a first-in, first-out basis. You may find that the default settings for log size are inappropriately small and that a log doesn't maintain a record of events long enough to maintain an appropriate historical record.
To change the behavior of the different Windows event logs for Windows servers on a network, you can open the Windows Group Policy Editor and click the event log settings. These settings let you control the size, access to, retention methods, and other policies for the Application, Security, and System logs. Figure 21.5 shows the Group Policy Object Editor event log settings.
Figure 21.5 The Group Policy Object Editor event log settings.

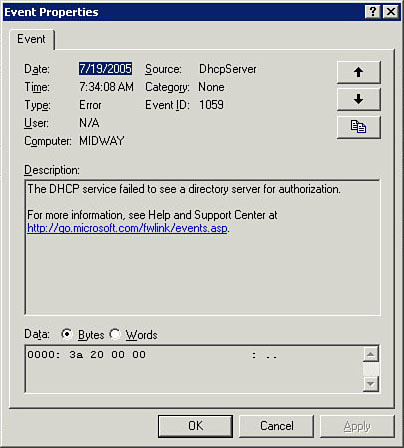
You can access the Application, Security, and System logs from the Event Viewer utility. To access the event log, you select Start, All Programs, Administrative Tools, Event Log (refer to Figure 21.4). To view a specific event, you click the log you want to view in the left panel and then double-click the specific event you want to view. Figure 21.6 shows a sample event from the System log—one that logs a DHCP error condition. The specific event properties list a variety of information, including when and where the error happened, the source of the error, and what the specific type or ID of the error is. The event log is well known to almost all Windows administrators. A little less well known is what to do with specific errors after you view them.
Figure 21.6 A particular event's description.
The problem with many event logs and with Microsoft's logs in particular is that they offer explanations that can often be difficult to decipher. Over the years, the messages have gotten somewhat better, but they still have the ability to confuse and confound. They also don't offer much in the way of practical advice on how to fix the problem in question. So the first step in most cases where you are diagnosing a Windows issue from the event log is to get more information about the event in question. At the end of an event's description (refer to Figure 21.7) is a hyperlink to Microsoft's event library. When you click the link, you are asked if you will allow the information to be sent to Microsoft so that it can match the event's ID. If you agree, the Windows Help and Support Center opens a browser window with more details on the event in question, as shown in Figure 21.7 If you liked the description of the event in the event log, chances are that you will like the description in the Help Center.
Figure 21.7 Windows Help and Support Center information on an event.

You might want to look at additional sources of information to help decipher different event IDs. One of them is EventID.Net (see www.eventid.net), which is run by the consulting group Altair Technologies. When you enter an event ID and its source into the EventID.Net search field, you get an alternative description of the event. The EventID.Net database contains a collection of event descriptions and also descriptions of the experiences of a number of contributors. If you scroll further down the page, you see comments, questions, and answers detailing experiences with this particular event, which can really be useful.
Novell maintains specialized event logs for security audits, as a management platform for Windows events, and with many of its applications, such as the GroupWise messaging server.
Solaris has several log files that you may want to check:
- /etc/system—This log lists your kernel configuration parameters.
- /var/adm/messages syslog—This log is the daemon log. Problems are listed with flags such as warnings, errors, panics, reboots, and so on. This is the most important Solaris log to examine.
- /etc/release—This log lists your OS version information.
Note
Sun offers a concise performance monitoring tutorial at http://sunsolve.sun.com/pub-cgi/show.pl?target=content/content3&ttl=article.
Implementing Hardware Redundancy Options
The purpose of a server is to provide reliable network services to clients. In order for a server to be reliable, it must be available a large percentage of the time. Not every service must be operated 24 hours a day, 7 days a week, 52 weeks a year—but in the age of global commerce and the Internet, many do. It's a fact that sooner or later, system components fail, and the more components you have in a system, the greater the chance of failure. Therefore, in order to build a more perfect server, you need to build in redundancies and have the capability to fail over to those systems when problems arise.
The purpose of having hardware redundancies is to provide greater availability, which is another way of describing a server's fault tolerance. People measure the fault tolerance of their servers in terms of the amount of time that the server is available to clients. Thus a server that can be accessed 9 days out of 10 is 90% available, which is also referred to as "one nine" availability. You probably don't think you need to do much to have a server run 9 days out of 10, and you're right. If a hard drive fails, you can probably restore it within 1 day, and chances are that any network outage isn't going to last more than 1 day, either. An availability of "two nines," or 99.0%, is also something that isn't all that hard to achieve, as it means that your server is down only approximately 87.7 hours a year, or 3 days, 15 hours, and roughly 40 minutes. Most departmental servers with standard RAID systems run in the range of from 98% up to around 99% of the time, depending on what applications they run.
Let's say that your website must be running 99.9% of the time, or "three nines." You've done the calculation that shows that if your system goes down for longer than that period, your business will lose so much money that you could have replaced your server entirely. With three-nines availability, your window to fix potential problems or outages shrinks to only 8 hours 45 minutes each year, which is uncomfortably close to just one single working day. You might be able to replace a drive once a year, but if your network goes down for longer than a working day, you've lost more money than your company can afford to lose. Therefore, additional measures are called for: extra drives, redundant network connections, readily available duplicate data sets, and so forth.
Now let's consider the next step up: "four nines," or 99.99%. A system that is available at the level of four nines is referred to as "highly available." With a system of this type, your allowable downtime shrinks to just under an hour, or around 53 minutes. That's not enough time to deal with a network outage; it's probably not enough time to replace a disk and rebuild its data set. If your system must achieve four-nines availability and doesn't, you have just about enough time to catch lunch and consider new career options. To get to this level of availability, not only must every subsystem associated with the server be fully duplicated but failover to the redundant systems must be swift. At this level, you could sustain maybe one reboot a month or so. Many people refer to this level of availability as "mission critical," and almost all organizations can get by with four nines. This is the level that the big banks and financial houses aim for as their minimum.
In rare instances, four nines isn't good enough: A system may be required to be up 100% of the time. This is the case when a system is needed for a life-and-death situation and when the cost of a system's downtime is so large that no downtime is really acceptable. Some of the very largest OLTP financial institutions that process millions of dollars of transactions each hour fit into that category. At this level, "five nines," your window for downtime is a little more than 5 minutes a year, which translates to roughly one reboot. At this level of fault tolerance, it is not adequate to duplicate all computer subsystems. The entire computer itself must be duplicated, as you might do in a clustered server system. A small number of companies sell servers that have been engineered to be "fault tolerant." Probably the best known of them are the Tandem (now part of Hewlett-Packard) NonStop systems (see http://h20223.www2.hp.com/nonstopcomputing/cache/76385-0-0-0-121.aspx), Stratus Computer's VOS and FT systems (www.stratus.com), and Marathon Computers (www.marathontechnologies.com). FTvirtual server is another example of a fault-tolerant system.
Table 21.2 summarizes the basics of server fault tolerance.
Table 21.2 Different Levels of Server Fault Tolerance

Integrated NICs, Memory, and Power Supplies
When your buy server hardware, you should expect to pay extra for the parts you purchase. Some of that additional cost goes into hardening the equipment so that it is less likely to fail. Drives meant for servers are manufactured to a higher standard than drives meant for desktops and laptops. Another factor that adds cost is redundancies built into the equipment you buy.
Server motherboards can contain a number of redundant features. One very useful feature is a dual set of memory banks. With such a system, when a memory stick fails or is about to fail, a diagnostic utility in the server BIOS detects the problem and takes that bank offline and enables the available spare memory. Not all server motherboards have this feature, but it's a very useful one.
Another feature on some server motherboards is dual integrated NICs. The first generation of these multihomed cards comes with one fast NIC port and one slower NIC port, typically a GigE port and a Fast Ethernet port. The manufacturer intends for you to use the fast port for your standard network connection to the server and to use the slow port as a management connection. Even when you purchase a motherboard with two NICs integrated into it, you should still install an extra NIC into your server. The rationale for this is that NICs do not consume much power or system resources, and integrated NICs seem to have a high failure rate. With an extra NIC installed, you can more easily switch over to the extra card. You can also install a second GigE card if you need a second fast port for throughput, as you might if you were building a proxy server or a router. Today's enterprise OSs support fault-tolerant NICs that work as failover devices or clustered devices. They can be embedded, PCI, or PCI-X cards in many cases.
It is possible to find servers that support multiple power supplies, which allows for failover if one supply stops working. Power supplies have a relatively long lifetime, but when they fail, they don't tend to simply stop working. Their output starts to vary, and you may find that your server starts to experience some very bizarre behavior. You may start getting STOP errors, see blue screens, have applications fail, and experience other problems that may seem to be unrelated. Having a second power source lets you swap over and diagnose the problem a lot more easily. Not many server motherboards support dual power supplies, but it's a great feature to have, and it is highly recommended for any critical server in your organization.
Load Balancing
The highest level of availability is achieved when you duplicate entire computer systems. There are two approaches to creating this type of fault tolerance:
- Load balancing—Many computers work together, providing the same service with service requests apportioned out to the most available server.
- Clustering—Two or more computers are logically grouped together as if they were a single computer.
With load balancing, each server is a member of a domain, and the system is front-ended by a routing service either in hardware (such as a BigIP box) or implemented in software through a cluster service. An example of a cluster service is Microsoft Clustering Services (see www.microsoft.com/windowsserver2003/technologies/clustering/default.mspx), which appears in Windows Server 2003 as the Cluster service and Network Load Balancing service.
A load-balanced set of computers is commonly referred to as a "server farm." When a computer fails in a server farm, the load balancing service simply removes the faulty server from the overall aggregate of servers. A user would notice a drop in service performance only if the server were operating at or near its rated load. When convenient, a new server can be added to the server farm to replace the one that was removed, and then it can be registered with the load balancing service. Figure 21.8 illustrates how load balancing works.
Figure 21.8 How load balancing works.

Load balancing is best used when a system is I/O limited and when you want to scale the system up by scaling out. A server farm is a highly reliable system with great redundancy. Server farms do not fail because of server failure; they typically fail because of problems with the infrastructure (for example, network connection or power failures). You can find server farms in enterprise websites such as Yahoo! or Google, in telecommunications systems where computers serve as switches and routers, and in many other places.
Every network operating system you have read about in this book has a load balancing solution available for it either from the operating system vendor itself or from a third party. With NetWare 6.5, load balancing is built directly into the operating system. There are load balancing solutions for network operating system services such as DNS, DHCP, and others, as well as for applications running on servers.
Because you can implement load balancing in both hardware and software, a very wide range of solutions are available in this area. Among the most notable solutions are the following:
- balance (http://balance.sourceforge.net)—This is an open source TCP proxy.
- Citrix MetaFrame (www.citrix.com)—MetaFrame is a load balancing arrangement of Windows terminal servers that offers a large portfolio of additional services, such as application launching and management.
- Coyote Point Systems's Equalizer series (www.coyotepoint.com)—This is a software application traffic load balancer for Windows server applications.
- F5 Networks's BigIP (www.f5.com)—BigIP is a hardware solution that routes requests to servers based on their availability. It is OS independent.
- Netscaler Application Delivery Systems (www.netscaler.com)—This is a hardware switch/gateway for routing requests to different applications, such as Oracle, PeopleSoft, SAP, Siebel, and web applications.
- Linux Virtual Server (LVS; www.linuxvirtualserver.org)—This is open source load balancing software for Linux.
- Load Sharing Facility (LSF; www.platform.com)—This is a load balancing software solution for Sun Solaris.
- Queue (www.gnu.org/software/queue)—This is a GNU load balancing application with batch processing.
- Sybase EAServer (www.sybase.com)—This is an example of an application-level load balancing application for Sybase's enterprise database. Many server applications come with this capability.
- Windows Server 2003—All versions of Server 2003 come with Network Load Balancing.
This list includes only a very small portion of the available load balancing applications that are on the market today and is meant to be representative of the range of possibilities.
Load Balancing Versus Clustering
Many people confuse load-balanced servers with clusters because both utilize multiple servers to the same end. Most of the time, when you load balance servers, each server retains its own separate identity as a computer, and when you cluster servers, they appear on the network as if they were a single computer. (We say most of the time because there are instances in which the software abstracts the different systems in a server farm from view, making it appear as if they are a single system; there are also times when a cluster appears to be multiple systems on the network, even if for the purpose of clustering only one logical entity can be addressed.)
So if the situation is so cloudy, where is there a clear distinction? The answer lies in the mechanism involved in fault tolerance. In load-balanced situations, the system doesn't fail over when a member server fails; the capabilities of the failed server are simply removed from the service. A cluster, on the other hand, always fails over when a member server fails. The ability to always fail over quickly that characterizes a cluster also means that the mechanism for failover requires that the cluster have a rapid means of communications by which a failed server can be identified as failed and the control and activity of the cluster is then passed on to another server in the cluster. Different clustering products have different methods of communicating, but the predominant method is to have members of a cluster share a common bus and have a "heartbeat" signal poll the status of the cluster on a second-by-second basis. Figure 21.9 shows how a clustering works.
Figure 21.9 How clustering works.

High-Performance Clusters
Many different types of clusters are available in the market today, from two-node clusters on up. Broadly speaking, clusters can be classified into one of the following categories:
- Share-nothing—With this type of cluster, two or more servers that are set aside for the same purpose work independently. In some instances, a server is maintained to provide "hot backup" for a server when it fails; some clusters, such as IBM's x-architecture, maintain a "spare" unused cluster node that's activated when another node fails.
- Share-something—With this type of cluster, two or more servers share a critical component such as a RAID array and use a communications method to determine when a server has failed. These servers can be in peer-level relationships or in master/slave relationships.
- Share-everything—A share-everything arrangement duplicates all aspects of a computer system, has all components operating under load, and simply removes a failed component from the operational mix when a failure occurs. Tandem's NonStop systems, Stratus's FT servers, and others fall into this category.
Let's consider these different possibilities a little more. The simplest cluster is a two-node cluster with failover. Examples of this architecture can be built with Microsoft Cluster Server and Linux-HA software. In the arrangement of a two-node cluster shown in Figure 21.10, two nodes of a cluster share a common RAID array where the data is stored. The RAID array is usually protected by being a 0+1 RAID level, which allows for both performance (0—striping) and failover (1—mirroring).
Figure 21.10 An example of a two-node cluster with a shared storage array.
A second SCSI bus connects one node directly to another, with a heartbeat signal running over that bus. When a server fails in this two-node arrangement, the second server takes over the host responsibility for the storage array and assumes the other duties of the cluster. The failed member is removed from the logical association until the administrator replaces it and adds the newly working system back into the cluster. The concept of polling in a cluster is called a "quorum" and can be extended to include a multinode cluster of any size. For more information about quorums, see www.windowsnetworking.com/articles_tutorials/Cluster-Quorums.html.
A share-nothing cluster implies that the servers in a cluster operate independently, but a mechanism exists that allows failover of the cluster to another cluster node when a fault is determined. Share-nothing clusters are a variation on simple load balancing. Not many systems are built with the share-nothing approach because it is an expensive architecture, and for the cost, OEMs prefer to build share-everything systems.
High-performance clusters are often built with many connected computer systems. These types of systems aren't new, but their application on lower-costs PC server platforms has popularized them. As early as 1977, Datapoint had developed ARCnet as a commercial cluster. The best known of the early implementations probably were the VAX/VMS VAXClusters that appeared in the 1980s.
When you move beyond two nodes in a cluster, the most important characteristic of the cluster technology becomes the high-performance interconnect technology. Clusters and high-speed networking are intimately related. In a high-speed network, each cluster node on the network requires some sort of CPU offload technology to move network processing to very-high-speed ASICs on the networking card. Among the technologies that power the larger clusters today are GigaNet's CLAN, Myrinet, Quadrics, InfiniBand, and Tandem's ServerNet, among others. These networking technologies typically work in the 2Gbps range and are expected to move to the 10Gbps range in the near future. Working clusters with more than 100 servers have been built in the past.
Note
The Top500 organization publishes a list of the highest-performance computer systems in the world at www.top500.org/lists. The current list at the time of this writing had the following five systems at the top:
- DOE/NNSA/LLNL's IBM eServer Blue Gene Solution
- IBM Watson Research Center's eServer Blue Gene Solution
- DOE/NNSA/LLNL's IBM ASC Purple eServer pSeries p575
- NASA/Ames Research Center/NAS's Silicon Graphics Altix 1.5GHz, Voltair InfiniBand
- Sandia Labs' Dell Thunderbird
The top system used 131,072 processors to achieve a rating of 280.6 Tflop/s, which is a measure of how fast these system run the LINPACK Benchmark. LINPACK is a set of linear equations that measure the floating-point performance of a system. See www.top500.org/lists/linpack.php for more information.
As you peruse this list, notice that quite a few of the listed supercomputers are built using PC-based servers as their building blocks, along with very-high-speed interconnect technologies.
Among the products used to cluster PC servers are the following:
- Beowulf (www.beowulf.org)—This is an open source project for application clustering.
- LinuxHPC (www.linuxhpc.org)—This is an open source project for Linux super computing.
- Microsoft Cluster Server (www.microsoft.com/technet/prodtechnol/windowsserver2003/technologies/genclust.mspx)—The Cluster service was a standalone product but is now part of Microsoft Windows Server 2003. The Cluster service is included in Server 2003 Enterprise Edition and Datacenter Edition, but not in Standard Edition or Web Edition. You can cluster up to eight systems by using this technology.
- Novell Cluster Services (NCS) 1.7 for NetWare 6.5 (www.novell.com/products/clusters/ncs/)—With NCS you can manage up to 32 NetWare 6.5 nodes with up to 32 processors per server. It provides support for iSCSI and Fibre Channel SAN connects, can pool free disk space, and has both failover and fallback capabilities. NCS supports dynamic configuration of clusters and storage volumes without rebooting.
- Sun Cluster 3.1 (www.sun.com/software/cluster/)—Offering up to 16-node support on both SPARC and x86 Solaris, this software ships with a management suite.
- Red Hat Cluster Suite (RHCS; www.redhat.com/software/rha/cluster/)—RHCS offers both application/server failover and IP load balancing. It supports up to eight cluster nodes. Features include NFS/CIFS failover, shared storage (required), SCSI and Fibre Channel support, and automated failover. The product can run on Red Hat Enterprise Linux ES on x86, AMD64/EM64T, and Itanium processors.
The next step beyond simple clusters is grid computing. What differentiates grid technology from traditional clusters is that although a grid gives you distributed processing through large numbers of computers, it is still just collections of computers that don't operate as a unit, don't form a domain or share security credentials, and don't have the fast failover of a high-performance computing (HPC) cluster.
Disaster Recovery Planning
Eventually every system fails, and occasionally systems fail in very unpredictable ways, such as the following:
- A construction crew cuts through the main optic cable line and disables all data communication to your city.
- Your building is struck by an act of terrorism.
- A water main leak or hurricane floods your entire data center.
- Your building is swallowed up by the earth during an earthquake.
- A computer virus destroys all of your systems' boot files or a hacker gets into the system and takes control.
- Solar flares knock out a power station in Ontario, which disables the entire North American power grid.
- Someone causes a fire in your building.
- Mergatroid in IT successfully upgrades your domain controllers but fails to migrate all the user accounts before overwriting all the information. Heavens!
All the aforementioned qualify as disasters, and we all pray that we are spared problems like these. However, good practice necessitates that organizations do disaster planning to keep critical business processes working or to recover from these problems as quickly and as cost-effectively as possible.
The Purpose of Disaster Recovery Planning
When disaster strikes, your first inclination when trying to address the problem is likely to be wrong, and in fact may make things worse. In an emergency, there's a very strong tendency to act first and think second. A well-thought-out disaster recovery plan is an essential component of any well-run computing center. In some locales, planning for business continuity is not just good business practice—it is the law.
The purpose of disaster planning is to codify a set of rules and actions that are to be followed when a problem occurs. Disaster recovery takes time to plan, and if disaster doesn't strike, it's a cost in time and salaries you might be tempted to forgo. A plan is a lot like insurance: If you don't need it, it's a waste of money, but when you do need it, it can save your organization a considerable amount of money, improve the quality of the recovery, and greatly diminish your downtime.
Disaster recovery planning is part of an overall fault tolerance strategy. It's where you utilize all your backup systems and test your strategies. However, you don't have time to fix any deficiencies in your systems at the time a disaster occurs. Therefore, it is absolutely critical that every system that you count on for recovery be tested beforehand. Just as is the case for data backups themselves, it is absolutely critical that you know the integrity of your systems by doing the following:
- If you have a data backup system you count on, do a restore from that system.
- If you have a mirrored disk system, test it by taking one-half of the mirror offline, running from the second mirror, and then reestablishing the mirror.
- If you have a clustered server system, try removing one of the nodes.
- If you have a backup power system, pull the plug on your main system.
- If there are people who are important in the chain of notification, call them to see if they respond.
There are many different tests that you can perform to test the viability of your recovery plan. The point is that none of them are any good if you decide to test them at the time a disaster strikes. So as part of your recovery plan, you need a set of regular action items to test the systems you count on.
An Example of a Disaster Recovery Plan
A disaster recovery plan should be an ongoing effort that results in a working document. Every year, at the appointed time, the document should be brought out and revised. People at every significant level of the organization should review and sign off on the plan. Disaster planning is not just an IT exercise; the level of loss that an organization is willing to endure or the amount of money that an organization is willing to pay to avoid a loss is really a business decision. There should be a reasonable calculation made to quantify the decisions made in the disaster recovery plan.
A disaster recovery plan should be written in the same way that any project plan is written. The plan should start with a clear and concise description of its purpose, there should be a table of contents for the issues the plan covers, and each issue should be written up in its own section. Sections should not only describe the issue and its potential solution(s) but designate who is responsible for action.
Note
A disaster plan needs to be readily accessible when needed. If your disaster plan is found only on a computer system, it isn't going to do you any good if that system goes down. A disaster plan should be a paper document that is stored with emergency equipment, with a copy or set of copies stored offsite in logical locations.
Disaster recovery plans are a little different than a lot of other project plans. They don't include definite time lines, although they may specify how long operations should take. They must also specify how problems are identified and how to escalate actions to the next level when issues aren't resolved. A good disaster recovery plan should include flowcharts that illustrate how actions should flow.
Table 21.3 shows an example of the parts of a disaster recovery plan.
Table 21.3 The Parts of a Disaster Recovery Plan

With a fully developed disaster recovery plan, if and when a disaster strikes, you will be in a much better position to minimize the damage, contain the costs, and bring your systems and services back online much more quickly. At times of great difficulty, it is best not to have to spend time thinking through complex responses.