
CHAPTER 9
Systems Management and Monitoring
CONTENTS
9.2 Traditional A/V Monitoring Methods
9.3 AV/IT Monitoring Environment
9.3.1 Traditional IT Device and Network Monitoring (Mon 1)
9.3.2 A/V IP Stream Monitors (Mon 2)
9.3.3 File Transfer Progress Monitor (Mon 3)
9.3.4 A/V File and Metadata Inspector (Mon 4)
9.4 Standards for Systems Management
9.4.1 The Management Information Base
9.4.2 The Simple Network Management Protocol
9.4.3 Web-Based Enterprise Management (WBEM)
9.4.4 Windows Management Instrumentation (WMI)
9.5.1 Configuration Management
9.7 It’s a Wrap—Some Final Words
9.0 INTRODUCTION
Managing the IT infrastructure is one of the thorniest problems facing business executives today. It is not easy, vacuums up resources, and is ever changing. To some, the cost of managing IT is pure overhead with no apparent positive return on investment. However, when the gains of productivity, availability, and efficiency are counted, coaxing out every ounce of performance is wise and contributes to the bottom line.
This chapter reviews the fundamentals of systems management for pure A/V systems and hybrid AV/IT systems. Monitoring is a part of systems management and is covered with sufficient emphasis to be showcased in the chapter title. The following topics are discussed:
• Systems management 101: The FCAPS model
• A summary of traditional A/V monitoring
• IT monitoring methods
• An AV/IT system monitoring framework
• Systems management IT standards
• Methods for diagnosing problems
Remember, the management plane is part of the three-plane model discussed in Chapter 7, so it plays a pivotal role in IT systems. However it is the least developed of the three planes for A/V systems. Still, it is fitting to discuss the principles of the management plane, its developmental status, and how it can grow to meet the needs of A/V.
Who are the users of management systems? Broadly, they can be classed as
• Access to a device by local service personnel. They typically need the most detailed device reporting and diagnostics with hands-on access.
• Systems management for a campus or enterprise IT infrastructure—managing groups of devices from a central location by IT staff.
• Access to devices by remote vendor service personnel—ideally do any management operation remotely that can be done on-site. This challenges some A/V gear but enables remote troubleshooting.
The concepts discussed in this chapter apply to all three types of users.
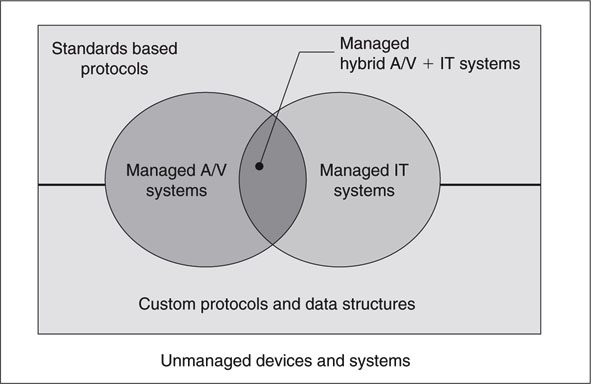
Figure 9.1 illustrates the landscape of managed systems and devices. A “managed” device or system component (including software applications) is one that exposes its internal states to external observers over a network. A standalone device with only front panel error reporting does not fall into this category. This would be an unmanaged element. There are two general techniques to manage an element: using management standards or proprietary methods. Our focus is on standard methods. Also, there are three management domains for purposes of our discussion: traditional A/V, standard IT, and hybrid A/V + IT. All are considered. So let us get started.
FIGURE 9.1 The landscape of managed systems.
9.1 THE FCAPS MODEL
In service of the telecoms industry, the ITU-T derived the FCAPS acronym to describe the salient aspects of systems management. It has been applied to managing IT as well. FCAPS (fault management, configuration, accounting, performance, and security) is a categorical model of the working objectives of network management. There are five levels: the fault management level (FM), the configuration level (CM), the accounting level (AM), the performance level (PM), and security level management (SM). Table 9.1 outlines the function of each level. Monitoring is an amalgam of select FM, AM, and PM functions.
Table 9.1 FCAPS Breakdown
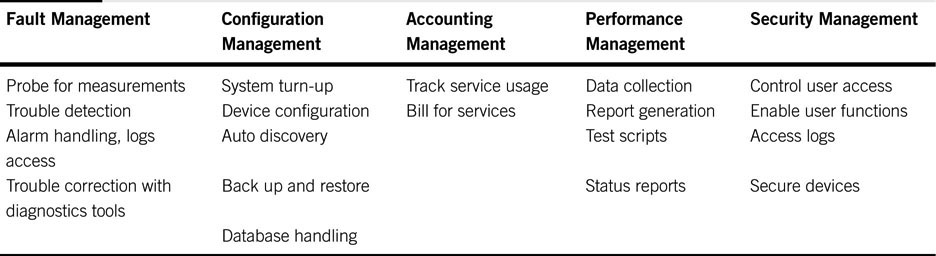
The categories are self-describing, and Table 9.1 provides hints for each functional definition. This chapter focuses on fault management and performance management. But why not cover every column? Configuration management is vital, of course, but there are precious few standards today. Although configuration management is fundamental, it also tends to be vendor specific, so it will be skipped for now. Accounting is also vendor specific and is applicable to facilities that rent equipment per hour or project for the most part. The security column was covered in Chapter 8. The lion’s share of systems management, for our purposes, is related to monitoring, reporting, diagnosing, and repairing devices and systems.
Although not originally encompassed, the FCAPS model may be extended to cover Web applications management. It is not enough just to manage the IT infrastructure but ignore the applications layers. Modern systems management solutions can drill into applications as they run and report status, resource problems, performance, security issues, and so on.
Ideally, all device/link/application-related FCAPS functions can be managed from a centralized station(s) connected to an IP network. Then hundreds of links, devices, and processes can all be monitored from one or more stations with integrated reporting across the entire system. This sure beats having to manage a multitude of devices individually with specialized protocols and methods.
If possible, every component, device, link, and network is 100 percent monitored, and faults (or preventative indicators) are reported with appropriate alarms. In some cases the cause of a fault is obvious, such as “Storage Array ABC, Disc 5 failed.” There is no need to hunt down the bad element. The guilty party is replaced with a new disc drive. At the other end of the scale, the root cause of a fault may not be apparent. How should a technician respond to the reported fault “Protocol XYZ failure: audio level parameter L3 out of bounds”? Logs need to be scanned and interpreted and diagnostic tools run to discover the root cause(s) of the fault. These can be tricky problems to debug, and diagnostics tools are mandatory to avoid protracted troubleshooting. Of course, there is no magic bullet to resolve all problems, but applying the FCAPS model is a step in the right direction.
FCAPS implementation in the IT space has become an industry with many vendors supplying standards-based solutions. However, we are also interested in management solutions for hybrid A/V + IT systems, and this combination has been vendor specific with a only smidgen of IT-based FCAPS thrown in. Still, there is huge promise for FCAPS to be adopted by the A/V industry, and this chapter shows its potential. Of course, adopting the model is just a start. What is really needed is adoption of the standards that support the model. Before we explore this potential, we outline the status quo of A/V monitoring and problem resolution.
9.2 TRADITIONAL A/V MONITORING METHODS
The maturity of A/V standards has enabled a variety of monitoring techniques and methods. Figure 9.2 illustrates an exaggerated monitoring landscape. There are six monitor and reporting classes shown (the device class, the visual viewing class, and so on), and each is discussed in this section. The source of A/V is a video server for this example but could be any A/V source.
FIGURE 9.2 Traditional A/V device and signal monitoring.1
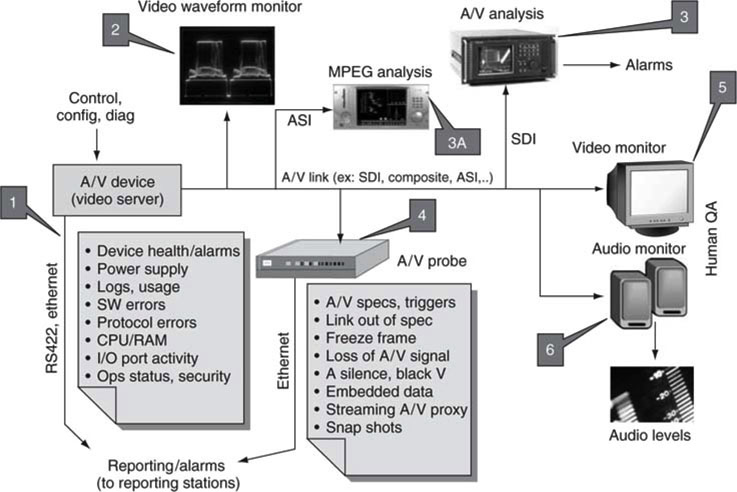
The most common monitoring method is to examine the internals of the device under test, point #1 in the diagram. This class enables the managed A/V device—the left lobe in Figure 9.1. Typical internal measured data points are listed. Monitored data are reported to remote observers over LAN or serial RS-422. There are several protocol means to report on the device health over IP networks. Many are proprietary, but one is based on an IT standard: the Simple Network Management Protocol (SNMP). This is an IETF standard for accessing measured device data over an IP network. SNMP is the workhorse for monitoring IT gear of all sorts. SNMP reads device internal data values arranged in a Management Information Base (MIB). MIB data reside inside the target device. A MIB is a tree-like data structure populated with measured values specific to the device under observation (alarms, power supply health, storage stats, I/O status, etc.). SNMP was designed to read this tree of data and return the values to a monitoring station. SNMP and MIBs are explained in more detail later in this chapter. Unfortunately, and this is key, there are very few standardized MIB definitions for A/V gear. Video servers, routers, switchers, and so on that have MIBs use proprietary ones for the most part. True, MIB data structures are usually published by the vendor to enable reporting, but they are still proprietary.
Device management is often based on vendor-specific technology and data structures. This frustrates plans for uniform facility monitoring as is available for IT systems. There is a nascent interest in establishing MIB A/V standards, but the work has been slow. However, MIBs for IT gear are plentiful and mature.
Monitor point #2 in Figure 9.2 is the time-honored video waveform monitor class. This time-based device displays one or more horizontal video lines. Video amplitude and timing-related specs are checked most commonly. A close cousin is the vectorscope used to measure color parameters. Even some non-technical users refer to the waveform display for a confidence check of min/max video luminance values. Some models can be configured to report over a network when illegal values are encountered. For a representative sample of signal monitors, refer to Tektronix (www.tektronix.com), Harris (www.harris.com), and Magni Systems (www.magnisystems.com).
Monitoring point #3 in Figure 9.2 shows the venerable VM-700 from Tektronix. This is the granddaddy of video measurement gear and can test every conceivable video spec. Some facilities use this as a quality and confidence monitor for master output feeds. Because these are expensive, simple-minded A/V probes are more practical for multilink monitoring. Point #3A in Figure 9.2 is a related method for monitoring MPEG TS streams over ASI links (and other links). The DVStation from Pixelmetrix (www.pixelmetrix.com) is such a device. Because DVB, ATSC, ISDB (Japan), and digital cable TV standards are all MPEG based, there is ample need to monitor/report on streaming MPEG signal integrity for these systems.
A relatively new class of monitor is the A/V probe (point #4 in Figure 9.2). These devices can be scattered throughout a facility and probe critical or suspect A/V links for signal integrity. They do not have an embedded display, such as a waveform monitor, but rather send a wide variety of real-time data points to centralized reporting stations. The method supports remote monitoring from virtually any Internet access point, which is powerful for multifacility monitoring from a central location. Each probe can be configured to report only when a trigger threshold has been reached. For example, say that the audio of a link is intermittent. A monitoring probe can be programmed to send a report only when the audio is silent (the trigger) for more than, say, 3 s. There is no end to the number of measured parameters and thresholds that can be programmed. Judicious configuration can find odd problems that rarely occur, which is a life saver for big system debugging. They can also be programmed to report continuously on select parameters for display on a central console.
Several vendors offer A/V probes with centralized reporting stations. Figure 9.3 shows an example PC screen shot from Miranda’s iControl (www.miranda.com). It illustrates a full-featured reporting display that receives its data from Miranda A/V probes. All manner of stats, data points, alarms, trigger thresholds, latched triggers, meters, and proxies are displayed. Other providers include Evertz (www.evertz.com) with its VistaLINK series signal monitoring and reporting.
FIGURE 9.3 A/V probe reported data.
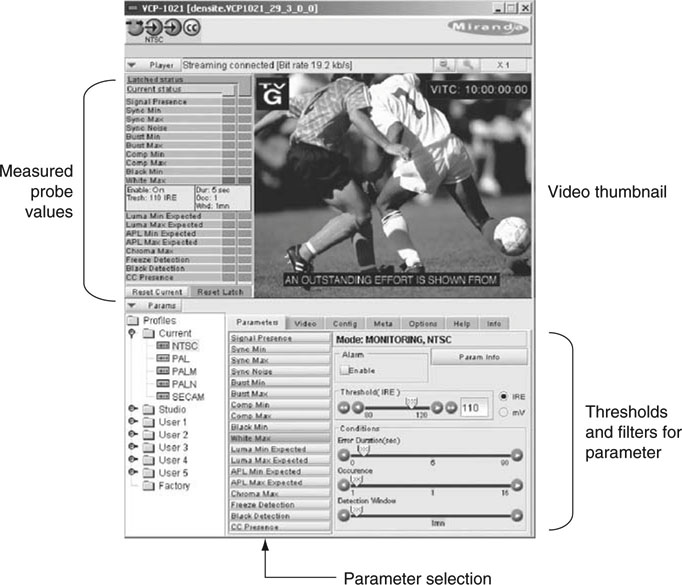
Image courtesy of Miranda Technologies.
Monitor points #5 and #6 in Figure 9.2 are legacy visual and aural monitors. With standalone video, monitoring problems are detected only if someone is watching/listening at the moment of signal corruption. Modern control rooms and sports vans often use a monitor wall showing many channels simultaneously. They have embedded signal alarms and triggers based on A/V analysis. Barco’s iStudio, Evertz’s MVP, and Miranda’s Kaleido are among several products that combine video images with overlaid data monitoring and alarms on the same display. See Figure 9.4 for a representative example.
FIGURE 9.4 Integrated wall display for A/V channel monitoring and stats.
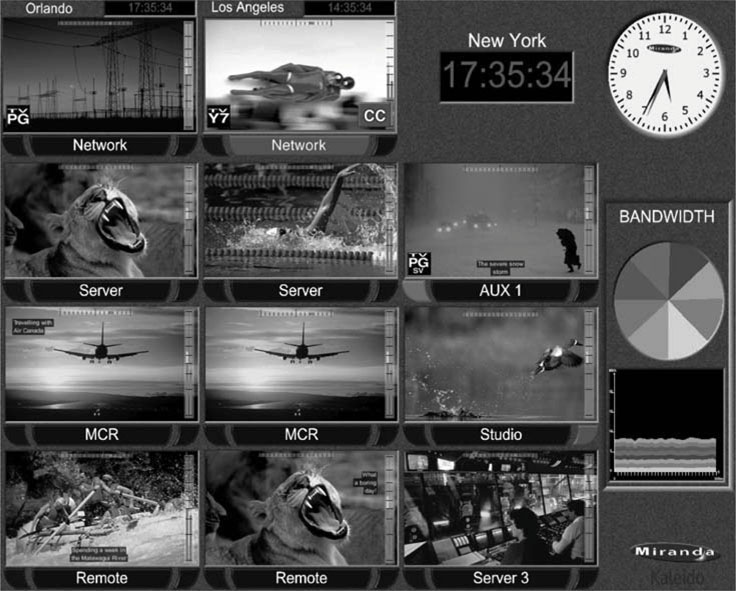
Image courtesy of Miranda Technologies.
9.2.1 The Challenge
Monitoring methods #2–6 are alive and well. They are based on existing A/V standards and signal links. A/V probes (#4) use custom data structures and reporting. Ideally, this could be standardized, but market pressure to do this is minimal at present. However, monitoring method #1 is problematic. A mediumsized facility may have 200 devices from possibly 30 different vendors. Device management using 30 different protocols, data structures, and reporting screens is a nightmare. There are too few standards, and most solutions are ad hoc and vendor specific. Progress is needed to standardize device-specific MIBs with agreements on how to use Microsoft’s Windows Management Instrumentation (WMI) for reporting OS, device resource, and application layer parameters. WMI is Microsoft’s implementation of WEMB discussed in Section 9.4.4.
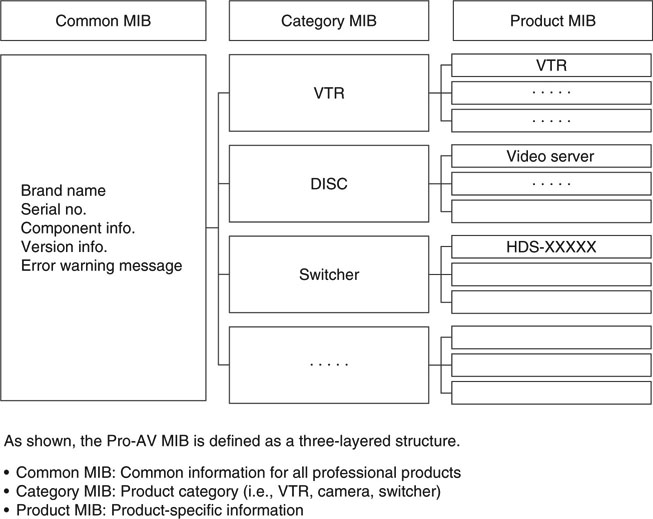
One exception to the status quo is a Sony effort to set a company-wide standard for professional A/V device MIBs. Called the Pro-AV MIB, it spans all of Sony’s new A/V equipment. The MIB was first defined in 2001 and is now included with all new Sony professional products. Figure 9.5 shows a general outline of the structure of this MIB across product lines. Actually, the Pro-AV MIB is defined by combining MIBs from individual products. It is not yet a SMPTE standard, but it does have category MIBs for the most common A/V elements.
FIGURE 9.5 Sony Pro-AV MIB general overview.
9.3 AV/IT MONITORING ENVIRONMENT
As systems migrate to hybrid A/V + IT technology, are strict A/V monitoring methods sufficient to meet users’ needs? No, new monitoring methods are needed. Ideally, we need to add functionality to Figure 9.2 to include at least the following:
1. IT systems integrity—links, routers, rates, QoS measurements, alarms, performance, and usage. Storage system health, stats, reports (online, near-line, offline, and archive). (Mon 1, 1A)
2. File transfer progress reporting (Mon 3)
3. A/V file analysis, integrity, proxy viewing (Mon 4)
4. Metadata browsing (Mon 4)
5. A/V stream taps. Monitor an A/V stream over a network connection (possibly UDP/IP based) with a non-intrusive monitor probe (Mon 2)
6. Workflow reporting, job progress reporting
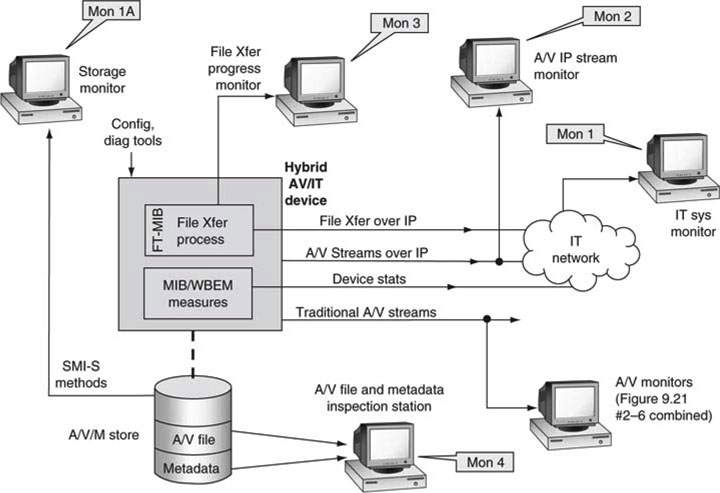
This domain is the merged overlap area shown in Figure 9.1. Mon 1–4 in the preceding list indicates reporting methods referenced in Figure 9.6.
All but the first item in the list are A/V specific. Standard IT means are sufficient to meet just about any network and storage measurement or monitoring scenario (#1 in list). However, functions #2–6 are not commonly available on centralized reporting displays, although some of these are available using vendor-specific tools.
Figure 9.6 illustrates a full-featured AV/IT monitoring environment. It uses all the methods shown in Figure 9.2 and augments them to include the functions in the list given earlier. The added items are identified as Mon 1/A, 2, 3, and 4. They are shown separately but could be combined into one or more stations for convenience as needed. Each one will be outlined.
FIGURE 9.6 Full-featured AV/IT monitoring environment.
9.3.1 Traditional IT Device and Network Monitoring (Mon 1)
Mon 1 is the traditional IT infrastructure monitor means. This is the right lobe in Figure 9.1. Using MIBs (data structures populated with monitored and static values) and SNMP (the protocol used to retrieve MIB elements),2 most IT elements may be monitored. Mon 1A in Figure 9.6 is dedicated to storage management, but is really just a subset of Mon 1. This area is well developed, with hundreds of vendors supplying reporting gear based on many standardized MIBs and other data structures. For example, the following grouping is of common network device-related MIBs as defined by the IETF:
RFC 1493 Bridge MIB; RFC 1213 MIB II; RFC 2096 IP Forwarding Table MIB; RFC 2737 Entity MIB; RFC 2665 Ethernet MIB; RFC2819 Four groups of RMON: 1 (statistics), 2 (history), 3 (alarm), and 9 (events); RFC 2021 RMON probe configuration; RFC 1850 IP Routing MIB
In fact, 145 official IETF RFCs in early 2009 referenced the word MIB in their title. In addition, there are thousands of proprietary MIBs. A few standards of noteworthy mention are MIB-I, MIB-II, and RMON MIBs. One of the first MIBs to be defined is called MIB-I (RFC 1156) and is used to manage the TCP/IP protocol suite. MIB-II is an updated version and is included in most devices that support TCP/IP. It is shown later in Section 9.4. The MIB is a tree structure with the upper part leading a path to the actual data elements in the lower part.
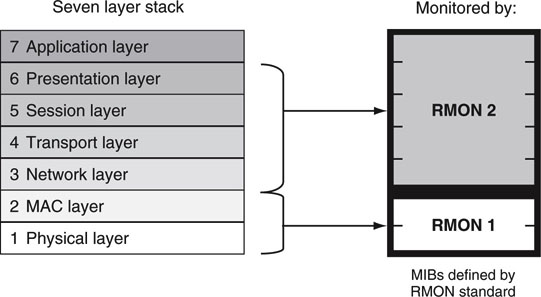
The RMON (versions 1 and 2) specification is an extension of MIB-II. RMON stands for remote monitoring and was designed to enable vendorneutral IP stack network monitoring. A RMON-compliant probe (an IP stack parameter measurement device) can accumulate data and report when thresholds are reached. See Figure 9.7 for the breakdown of RMON 1 and 2 measurement domains. Because RMON defines a MIB standard, vendors can compete by selling probes and centralized reporting stations, knowing that the entire food chain is defined. The RMON equivalent for A/V-specific gear and links does not exist, yet. However, the Pro-AV MIB described earlier comes close.
FIGURE 9.7 RMON MIB monitoring for the IP stack.
In addition to MIBs and SNMP, the Web-Based Enterprise Management Initiative (WBEM) is a separate set of technologies developed to manage enterprise computing environments (integration platforms). WBEM provides the ability to deliver an integrated set of standard management tools that leverage Web techniques. More on this in Section 9.4. One special area is storage management. The Storage Networking Industry Association (www.snia.org) has defined how to use WBEM to manage storage systems. Networked video relies heavily on storage, so let us review the development of SNIA.
9.3.1.1 The Storage Management Initiative (Mon 1A)
The SMI was developed by the SNIA in response to the crying need for storage management across heterogeneous platforms. At its core, the SMI is composed of the following:
• Enabling and streamlining the integration of multivendor storage systems
• Leveraging established management methods
• Encouraging management consolidation (ending the nightmare of five management consoles for five different storage systems)
• Providing a common management interface for vendors to develop compatible products
• Offering interoperability and testing suites
• Providing SMI-S—the technical specification
SMI is more than a specification; it is an initiative spanning education, specs, interop testing, and marketing of the concepts. SMI-S is the specification portion, which is our focus. The SNIA states that the majority of new Fibre Channel SAN-based storage will be SMI-S compliant. Because virtually all storage vendors support this initiative, eventually most SAN storage systems will support it. The SNIA also supports NAS and iSCSI storage.
Figure 9.8 is a top-level view showing arrays, libraries, HBA, and FC switches being managed using WBEM. The basic idea is to leverage WBEM along with CIM (see Section 9.4 for details) for element, application, and system management. CIM is an information model, a conceptual view of the managed environment that unifies and extends the existing management standards (SNMP, MIBs) using object-oriented constructs and design. The CIM model (CIM Object Model in Figure 9.8) is populated with reported data values that a management station may query to determine the state of a device or process.
FIGURE 9.8 Overview of SMI-S management methods.
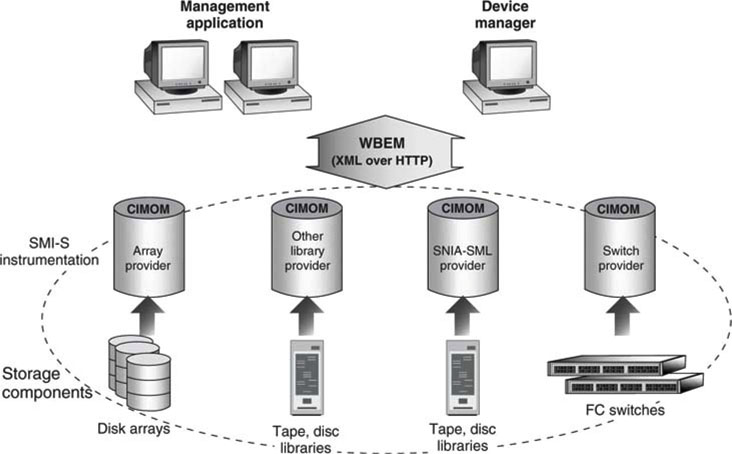
Concept: SNIA.
The SMI-S 1.1 specification documents a secure and reliable interface that allows storage management systems to identify, monitor, provision, configure, and control physical and logical resources in a storage system. Importantly, SMI-S is much more than dumb element monitoring (reporting a bad fan) and includes configuration and a hierarchy of managed objects. The bottom line is this: administrators can manage heterogeneous storage platforms using a standardized management interface and vendor-neutral management stations. Storage administrators can use one application for many of the operations that traditionally take several vendor-specific management products. This brief coverage only scratches the surface of SMI-S (refer to www.snia.org/forums/smi for a deeper look).
9.3.1.2 Centralized Enterprise Reporting Stations (Mon 1, 1A)
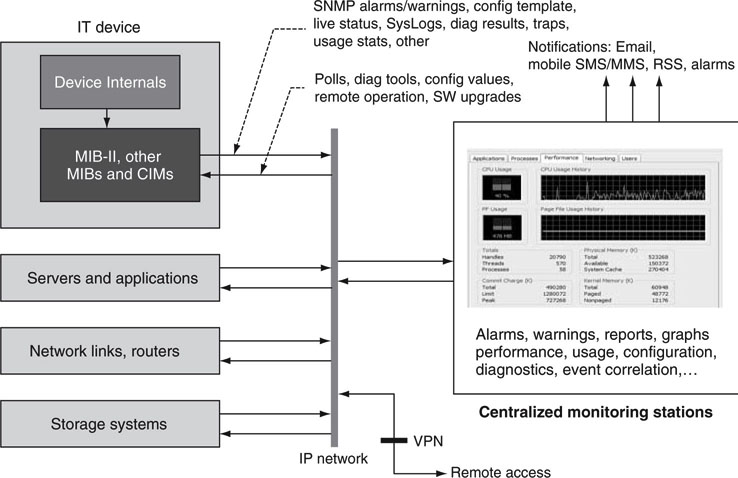
At a higher level, there is an entire industry providing enterprise-wide management stations that hide the complexity of MIBs, SNMP, and WBEM. After all, what users really want are reports and notifications informing them of alarms and potential troubles and assisting with problem diagnostics and resolution. No one wants to read strings of MIB variables or CIM models to find a problem. Managers want the fewest people to administer the most system components. Figure 9.9 illustrates a simple monitoring configuration with a centralized station(s) monitoring potentially thousands of IT elements.
FIGURE 9.9 IT element monitoring environment.
Some valuable performance attributes of the reporting station are as follows:
• General alarm reporting, including notifications to email, SMS/MMS, and so on. Support for all standard reporting means—standard MIBs, SNMP, WMI, WBEM, OMI, and so on.
• Resolving power—reporting the root cause of a problem if possible. Some problems can cause an alarm storm due to cascading errors. A good reporting tool will determine the root cause and give it priority over possibly hundreds of other cascading alarms.
• User-friendly screens—the ability to dig as deep into a system as needed. This may include embedded configuration diagrams for easy tracing of problems.
• Settable thresholds—this allows for a user to set trigger points in a device for select parameters and report only when the trigger has been reached; for example, report only when the storage capacity reaches 10 percent free space.
• Copious reporting choices—charts, graphs, and textual reporting of all sorts.
• Optional IT element diagnostics, configuration, performance, usage, event log viewing, and status are valuable features. Depending on the element(s) being managed, configuration, diagnostics, performance, and so on may be available only from the element’s vendor as a standalone function and not integrated into a generic reporting station.
It is not easy to monitor A/V gear in real time, especially accessing internal, low-level parameters. The procedure of monitoring may interfere with the A/V operation. By way of analogy, this is related to Heisenberg’s uncertainty principle. The more precisely a measurement is made, the more likely it is to interfere with process operations. It is left to A/V vendors to design their devices to be monitored non-invasively in real time. Non-real-time monitoring is easy but a nuisance, as it may miss critical events.
There is a world of choice when selecting enterprise systems management software. HP’s OpenView (part of HP Software suite since 2007), IBM’s Tivoli Management Software, and Computer Associate’s Unicenter are the big three providers. Of course, there are 30+ smaller providers that often specialize to differentiate in some manner. The big three offer a complete line of management solutions, whereas others usually offer vertical solutions in select areas. None of these players specialize in A/V systems. However, several A/V vendors offer entry-level, vertical management platforms dedicated to their own products and some third-party ones. Some sample offerings are Avid’s Administration Tool for Unity, GVG’s NetCentral, Harris’s CCS Pilot, Miranda’s iControl, Snell and Wilcox’s Roll Call, and Sony’s MMStation.
Look ahead to Figure 9.17, which demonstrates an example of a hierarchical system configuration as viewed on a management station. Users may drill deeper into any subsystem by selecting it for exposure. This example shows two levels, but more are likely for larger systems. At the lowest level, dashboards of device health are common. This example shows a video server the MIB with particular focus on the configuration details of the device. This aspect of Figure 9.17 is discussed later in the chapter.
9.3.2 A/V IP Stream Monitors (Mon 2)
The Mon 2 class of monitoring reports on A/V stream signal integrity over IP links. In a way, it is an extension of traditional A/V monitoring (class 3 in Figure 9.2) except for IP links. One such method uses UDP/IP and the RTP streaming protocol to carry MPEG, DV, uncompressed HD (RFC 3497), or other A/V payloads. Another model carries MPEG over IP directly. MXF has stream support, but there is little usage so far. Expect to see more IP usage as SDI is replaced by IP connectivity. However, as mentioned in Chapter 2, SDI will not replace IP streaming anytime soon for live event scenarios. The DVStation from Pixelmetrix is one such monitoring device, but this class is immature at present.
9.3.3 File Transfer Progress Monitor (Mon 3)
The usage of file transfer to move A/V assets has become commonplace. Many everyday operations, once based on SDI or composite links, are now performed using files. Anyone who has waited for a file transfer to complete knows the value of a monitoring display showing the stats of the transfer—time to go, percentage complete, stalled, failed, and so on. Frankly, there should be a federal law forcing vendors to always provide a meaningful progress monitor—the hourglass icon does not count!
As file transfers consume a larger part of overall A/V operations, it makes sense to have a unified way to monitor their status. One could argue that separate vendor-supplied custom monitors (usually embedded in an application) will always be acceptable, but then there is no consolidated view of systemwide transfer operations. Incidentally, if the file transfer is considered a stream, then the Mon 2 method may be used in some cases. Generally, however, monitoring the actual file as it moves across a link has little value and is difficult to implement.
One way to enable a universal view is to define a file transfer MIB populated with live stats. If 10 products from different vendors are all moving files independently and each supports this proposed FT-MIB, then a central station can easily monitor all transfers on one display. The FT-MIB would reside in the box titled “File Xfer Process” in Figure 9.6. Some may reason that the individual transfers lose their meaning on a centralized report. However, a centralized knowledge of all transfer stalls/failures, completion of crucial scheduled transfers, and aggregate consumed bandwidth is valuable information for managing the overall facility. Defining the FT-MIB is a simple task, and possibly ~15 parameters would suffice. A suggested parameter list is as follows:
• File name, file size
• Transfer ID tag (tracking number)
• Source machine name, process name, and ID
• Destination machine(s) name, process name, and ID(s)
• Time of transfer start, estimated time of completion
• Percentage complete (updated every 2 seconds or so)
• Average Mbps transfer rate, peak, minimum
• Status: transfer in progress, stalled for N seconds, failed (failure code)
There is an old saying, “If you can’t measure it, then you can’t improve it.” The FT-MIB is a step in the right direction in improving file transfer efficiency and overall infrastructure utilization.
9.3.4 A/V File and Metadata Inspector (Mon 4)
When you are inspecting a videotape, text labels are indispensable for identifying the contents. It is a snap to read a tape’s label and/or preview it on any active VTR. When you are using files, it may not be as straightforward to know what is in a file or to preview it. Enter the file inspector. This class is not strictly monitoring but rather examination. There are no alarms, warnings, or MIBs. Rather this class enables easy viewing of stored assets and associated metadata. It is a MAM element, as discussed in Chapter 7. A short list of file inspection criteria is as follows:
• Query for and locate one or more files.
• Browse file on a desktop client and view basic properties.
• Read the associated structural and descriptive metadata as appropriate.
• Move a file across the network as an option.
• (Optional) Test for validity and quality of a file; make corrections to file if needed.
• Perform validity checks for format legality—MPEG syntax, for example.
These steps are an analogy to the tape-based inspection case. Most MAM vendors offer file browsing with these features. Having access to inspection browsing reduces user anxiety in tapeless environments. Plus, with sufficient determination, it allows personnel to debug problems, find misplaced assets, and locate poorly indexed metadata. As it happens, several vendors provide utilities for testing file format (MPEG, MXF, XML metadata, etc.) legality. See the Harris QUIC product for file analysis and syntax correction.
So, there it is. Figure 9.6 outlines the salient aspects of a full-featured monitoring system. Most systems will have some subset of this universal viewpoint. Those who ignore monitoring will suffer when troubles arise. Some of the pieces are in place today, some are coming on the scene, and some are long overdue. As IT moves deeper into A/V systems, expect to see more growth and standards in these areas. If you are a user, query any potential vendors for their response to the issues and features that make up the management plane.
9.4 STANDARDS FOR SYSTEMS MANAGEMENT
The world of managed systems is built on a strong foundation of standards. Actually, layers of standards. There are standards for data types, data structures, access methods, and transport. Figure 9.10 shows a high-level view of the relevant device and application management standards that impact IT and A/V systems. Of course, there are countless custom ways to create management systems, but this section focuses on industry standards and their functions.
FIGURE 9.10 System management standards.
The chief standards and controlling bodies are as follows:
• Management Information Base—IETF body
• Simple Network Management Protocol—IETF
• XML, SOAP, HTTP, TCP/IP data wrapping and transport standards—W3C, IETF
• Web-Based Enterprise Management Initiative (WBEM)—DMTF body
• Common Information Model (CIM)—DMTF
• Windows Measurement Instrumentation (WMI)—Microsoft implementation of WBEM
• CIM extended for Windows environment (de facto standard)
Each of these standards is explored in order to shed some light on their underlying function and place in the overall management food chain.
9.4.1 The Management Information Base
A MIB is a tree structure containing human-readable data values. Its base standard is RFC 1155. Each node in the tree contains an element value. In fact, all the values are ASCII textual values. Any text processor can display the contents of a MIB in much the same way that an XML file can be examined. An example of a MIB is shown in Figure 9.11. The tree structure is obvious. Each node is labeled with a number, the object ID (OID). The label identifies an associated value. The OID is a kind of address. To locate any element in the MIB tree is as simple as following the OID pointer. Some key nodal values are
FIGURE 9.11 MIB-II definition.
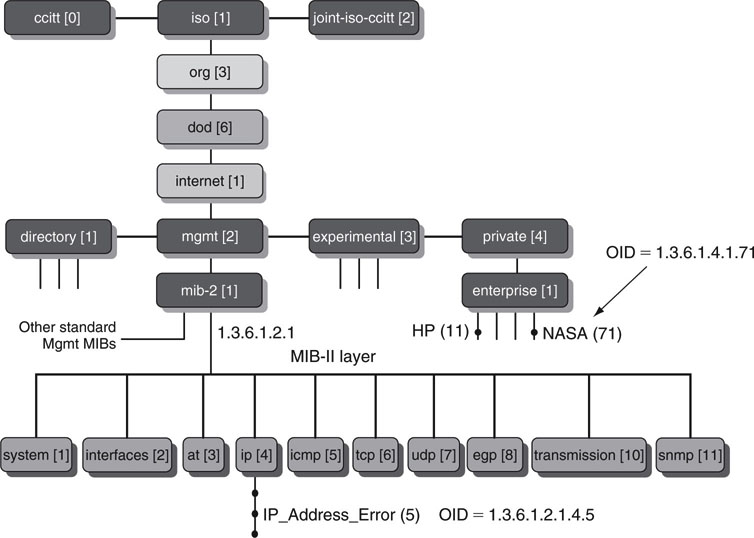
• International Standards Organization (ISO); node OID = 1
• Organization; node OID = 3 (an ISO-recognized body)
• Department of Defense (DOD); node OID = 6
• Internet; node OID = 1
• Mgmt; node OID = 2 (all elements below this node are management data)
• MIB-II; node OID = 1 (standardized IP stack measures)
The full OID 1.3.6.1.2.1 points to the top of the MIB-II data structure. Just for fun, enter this number into an Internet search engine to appreciate the ubiquity of MIB-II in managed products. MIB-II nodal objects are defined by RCF 1213. One example of a MIB-II node element value is “IP_Address_Error” at OID = 1.3.6.1.2.1.4.5 descending from the node IP (4) in the MIB. This value is defined by MIB-II and is the count of received IP address errors. Of course, the full MIB-II contains several hundred nodes.
There are thousands of defined MIBs, some standardized and some private. The private MIB “enterprise” OID always begins with 1.3.6.1.4.1. For example, 1.3.6.1.4.1.11 is reserved for all of HP’s custom MIBs. Do an Internet search using this exact value to prove it. All companies with private enterprise MIBs need an assigned OID.
End users rarely have to worry about building MIBs; that is left up to the equipment vendors. So the gory details of how to compile a MIB and what variables to include should not be an issue for end users. However, viewing the MIB may be required if the management station does not recognize it. In that case, most stations will display (using a MIB browser) the values of the MIB without knowledge of their root meaning. It is not easy to understand raw MIB values, as the viewer needs a MIB dictionary (which maps OIDs to the value of a node) to make sense of the data. Make sure your equipment vendor supplies a dictionary for any MIBs that are not standardized. You never know when the dictionary will be needed when debugging odd problems.
The MIB structure is designed to be “crawled” to read out its values, and SNMP is designed specifically to do this. The next section provides the basics of this universal tool.
9.4.2 The Simple Network Management Protocol
SNMP is the foundation protocol for monitoring system elements. Because simplicity breeds ubiquity, SNMP is supported by nearly 100 percent of IT-based devices. Its main function is to interact with element MIBs. Figure 9.12 provides a glimpse of a monitoring environment and why SNMP is indeed simple: it has only five commands. See (Mauro 2001) for a good introduction.
FIGURE 9.12 Basic monitoring using SNMP.
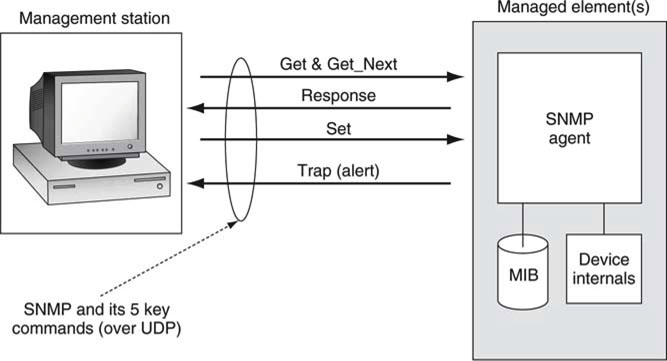
Figure 9.12 shows four main components: the management station, the managed element with the SNMP agent and associated MIB, and the SNMP. Agents are software modules that reside in system elements. They collect and store management information (errors, stats, counters, etc.) in the MIB and provide SNMP support to R/W MIB variables. The five main commands shown in an illustrative way are
• Get(1.3.6.1.2.1.4.5)—read a variable from a MIB at node OID
• Get_Next(OID)—read the next consecutive element in the MIB tree (OID + 0.1)
• Response (returned value)—value from Get or Get_Next request
• Set(OID, value)—set the MIB element at node OID to value
• Trap (returned value)—trap sent in response to some threshold reached
It is a snap to read a MIB using the Get or Get_Next commands. Sets can be useful for writing values into a MIB, but it is suggested that this feature not be overused because it quickly leads to poor data management and access rights issues. Get_Next is useful for efficiently traversing the elements of a MIB. Traps are responses to some target MIB variable reaching a critical threshold. If too many traps are set or their trigger threshold is too low/high, trap storms can arise when some upstream problem occurs. Use traps and sets judiciously.
There are three versions of SNMP: SNMPv1 (RFC 1155), SNMPv2C, and SNMPv3, each in turn with more functionality. SNMPv1 and SNMPv2C define administrative relationships between SNMP entities called communities. Communities group SNMP agents that have similar access restrictions with the management entities that meet those restrictions. All entities that are in a community share the same community name. To prove you are part of a community, access is tested against the community name during the SNMP dialog. SNMPv3 defines the secure version of the SNMP protocol.
SNMPv3 addresses security by adding two new features: authentication via hashing and time stamps and confidentiality via encryption. A management application is authenticated via a SNMPv3 remote device before being allowed to access the MIB variables. In addition, all of the requests/responses between the management station and the remote device are encrypted to prevent snooping.
Interestingly, SNMP runs over UDP, not TCP. Why? Because UDP requires low overhead, the impact on a network’s performance is reduced. SNMP has been implemented over TCP, but this is more for special-case situations over long distances. It is the responsibility of the management station to guarantee data integrity, which can be done using time-outs and retries. Also, the set operation is problematic, as there is no guarantee that it will actually change the desired variable.
In A/V applications, many devices support SNMP. The real issue is whether the MIBs that are accessed are standards or vendor proprietary. If custom, then users are practically restricted as to their choice of management stations, usually vendor supplied. Of course, if all management is Web based (with a Web server in each managed device), then this is a moot point and SNMP is not involved. The plea for A/V MIB standards cannot be proclaimed loud enough, or else users will be forced into using closed, vendor-supplied, management stations.
MIBs and SNMP do not have a monopoly on management standards. The next section considers the other standards cited in Figure 9.10.
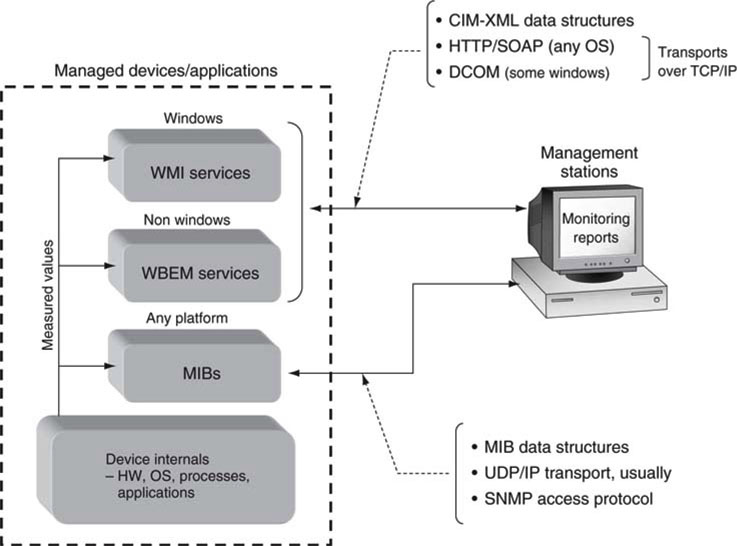
9.4.3 Web-Based Enterprise Management (WBEM)
The Distributed Management Task Force (DMTF) is the leading industry organization for the development of management standards and integration technology for enterprise and Internet environments. Its roster has reached 4,000 participants from 43 countries. Many of its participants provide IT devices enabled with WBEM technology.
The WBEM initiative was created to provide common management infrastructure components for instrumentation, control, and communication in a platform-independent and technology-neutral way. DMTF technologies include information models (CIM), communication/control protocols (WBEM), and core management services/utilities.3
The goal of the DMTF was to create a set of standard methods to manage devices, applications, and infrastructure at a high level. The aim is more far reaching than monitoring a set of MIB variables.
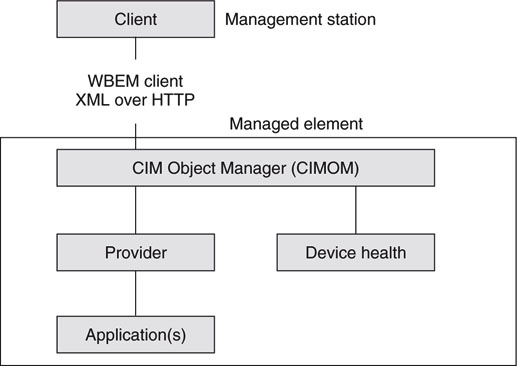
A basic outline of the architecture is shown in Figure 9.13. A core piece of the puzzle is the Common Information Model (CIM). The CIM is based on a description language. This is an object-oriented model, describing an organization’s computing and networking environments (its hardware, software, and services). All managed elements are positioned within this model, streamlining integration by enabling end-to-end multivendor interoperability in management systems. As a crude analogy, its counterpart is the MIB. Although a MIB has no notion of object-oriented design, both concepts describe management information schemas.
FIGURE 9.13 WBEM-based device monitoring.
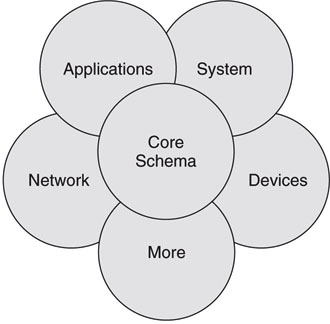
Each management area, such as networks or applications, is represented in a CIM schema. Different management areas are worked on by different DMTF specialty groups. Figure 9.14 shows how existing CIM schemas are conceptually layered. A core schema is at the center, and schemas then build on each other to represent more specific management areas. At present there are 10 (not all shown in Figure 9.14) CIM management schemas. See www.dmtf.org for full definitions of the CIM schemas.
FIGURE 9.14 CIM management schemas.
The CIM data models are managed by the CIM Object Manager (CIMOM) component. It communicates with the management station using an XML mapping of the CIM data elements over HTTP. Think of the CIMOM as a way to access data that the CIM schema describes. XML/HTTP is a common method in Web environments to interchange data elements. Again, by way of simple analogy, this is similar to SNMP, but much more flexible in operation. One advantage is that it uses TCP transport compared to SNMP’s unreliable UDP. This is especially valuable when management stations span the Web.
In theory, anything that can be managed using MIB/SNMP can be managed using WBEMs. However, the converse is not true due to the power of WBEM methodology. For example, monitoring of user application’s performance, security, and status is rarely done using MIBs but is common using WBEM. WBEM encourages high-level monitoring of applications, devices, and networks simultaneously to get the most information of overall system performance and status. With the hegemony of Microsoft in enterprise IT, it is wise to ask if it supports WBMS. Well, yes and no. MS developed an implementation of WBEM called WMI.
9.4.4 Windows Management Instrumentation (WMI)
Windows Management Instrumentation is a component of the Windows operating system that provides management information and control in an enterprise environment. Using CIM standards, managers can use WMI to query and set information on desktop systems, applications, networks, and other enterprise components. Developers can use WMI to create event monitoring applications that report when incidents occur. One area of incompatibility is how an application writes codes to WMI versus WBEM. WMI provides an API to access the CIMOM, and this API is not the same as, for example, a Linux implementation. As a result, this incompatibility complicates application porting. The Microsoft Web site offers many tutorials and white papers on WMI and its use in systems monitoring.
Because WMI is part of the Windows OS, practically any OS operating parameter may be monitored locally or by remote means. For example, Figure 9.15 shows a screen shot from the EventTracker product available from Prism Microsystems (www.prismmicrosys.com). This tool collects and consolidates all the Microsoft event logs from remote Windows devices. It can be configured to dig as deeply as needed to report on virtually any device-related parameter. User applications that are WMI compliant may be monitored with this tool. The Windows OS supports hundreds of WMI-monitored parameters. Many hardware-related stats may also be monitored using WMI.
FIGURE 9.15 Console screen shot of EventTracker application (relies on WMI).
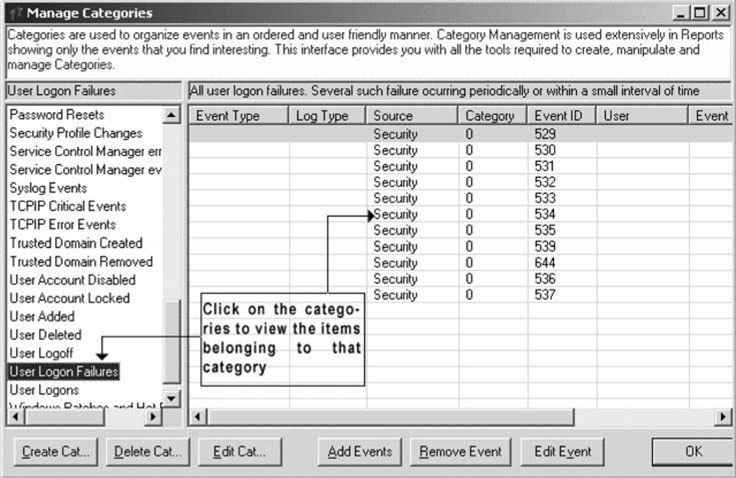
Source: Prism Microsystems, Inc.
To see what a local Windows XP/Vista machine event log looks like, examine the tools at Start, Control Panel, Admin Tools, Computer Management for a glance at some useful reporting screens.
The bottom line is that more and more IT devices, networks, and applications will depend on WBEM/WMI for management. It is not yet common to use these methods for A/V-related applications. The usual mantra applies—as IT digs deeper into traditional A/V applications space, these methods will find use. So get ready! It is always good form for users to query A/V vendors on their product’s management ability, including support for application-level WBEM/WMI.
9.5 SERVICE DIAGNOSTICS
Reporting system events is only one aspect of overall management. Another is diagnosing the root cause of a problem. Some critical application servers can easily generate thousands of events a day, although this would be uncommon in most A/V systems. It is tough to comprehend this massive flow of data. Many of these events are also cryptic and make it difficult to pinpoint specific problems. As a result, some sort of event filtering is needed for big systems. Some vendors of IT management stations offer event correlation tools that make connections between hundreds of events to spot the likely cause.
Another scenario is finding the root cause for an event such as “Video Server application: Failure: Play File ABC: Port 4, 10:24 AM.” System logs need to be scanned and interpreted for clues. At times, diagnostics tools are needed to run tests to uncover the root cause. Vendor-supplied management stations should offer some rudimentary tool set for debugging problems. Of course, there are no standards for troubleshooting, but some common techniques are available and widely used. The following is a list of general tools that should be made easily available on every modern A/V device to aid in troubleshooting:
• Easy access to the venerable Ping command. This polls a remote IP address for life. See Chapter 6 for ideas on simple network testing. Check out PingPlotter for a cool tool that reports on Ping results overtime.
• Log access. When a problem occurs, the first place to turn is the device event log. Applications that log events using WMI (or WBEM) or MIBs should be queried easily. Incidentally, RFC 3164 defines a SysLog format that should be adhered to by device designers or at least modified to suit instead of a totally proprietary log format.
• Remote access to read internal device logs, read/change configuration settings, and perform operational tests. Vendor access using a VPN along with tools such as PCAnywhere or VNC (a multiplatform product, available free) enables many device problems to be debugged and repaired remotely. Remote troubleshooting and device upgrades can cut downtime by orders of magnitude compared to on-site vendor visits.
• Configuration management (see later).
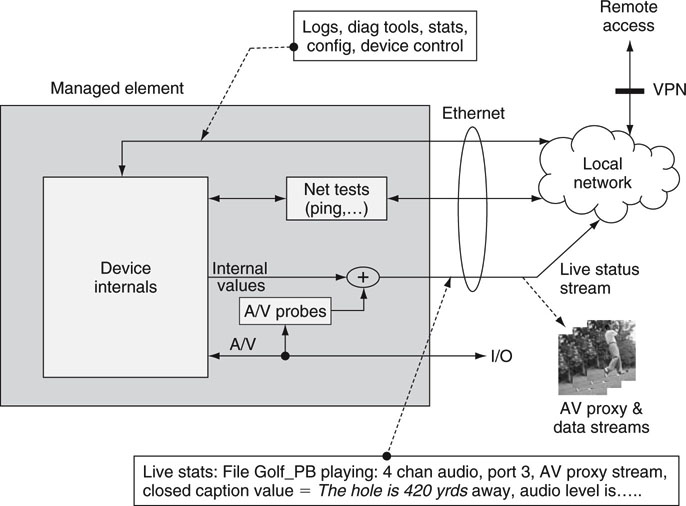
• Live status reporting for A/V gear. Instead of poll to read events (pull method), devices should also support a pushed “live status stream” over IP. The stream (maybe 30 Kbps) could contain select real-time monitored values, including small proxy snapshots of a target A/V I/O port. Think of the data stream as representing a configurable RT monitoring probe into device internals.
• If one were to dream, every I/O port should have the equivalent of an attached A/V probe as discussed in Section 9.2. The more non-intrusive eyes and ears watching and listening for anomalies, the easier it is to find and isolate problems. No real-world devices support this today, but it is a laudable goal.
Figure 9.16 outlines the ideal features of a system element that provides for the full gamut of testing and diagnostics tools in the preceding list. It is meant to be illustrative and would have one Ethernet port, and not three as shown. For the most part, diagnostics tools are a vendor afterthought as a product feature. It is always good to ask any potential vendor what tools are supported. Also, brace up to the fact that remote access (over secure VPN) for a vendor on a service contract is a good way to repair and upgrade equipment without the need for an on-site visit. It saves time and money.
FIGURE 9.16 The well-diagnosed A/V element.
CAN YOU HEAR ME?
Using the “Ping IP address” command is the simplest way to test a network connection. The command invokes a remote device to respond with “I’m alive.” Ping measures the round trip time to the remote server or device. Following are two examples of Ping in action. The first one shows a ~48 ms roundtrip delay between the sender and a Yahoo! server. The second test attempts to contact a HP server but with no response. In this case, HP decided to disable Ping responses to prevent rogues hammering their servers. Don’t be fooled; the connection path to the end server may be fine, but the end device may be silent on purpose.
C:Usersping 209.131.36.158 (www.yahoo.com)
Reply from 209.131.36.158: bytes = 32 time = 48 ms TTL = 56
Reply from 209.131.36.158: bytes = 32 time = 47 ms TTL = 56
Reply from 209.131.36.158: bytes = 32 time = 49 ms TTL = 56
Reply from 209.131.36.158: bytes = 32 time = 48 ms TTL = 56
----------------------------------------------------
C:Usersping 15.200.30.22 (www.hp.com)
Request timed out
9.5.1 Configuration Management
Device configuration parameters have been on a long leash for many years and need to be tightened up. Figure 9.17 illustrates a suggestion for MIB-based configuration data structures. While it is true that some MIBs do support configuration data (see Figure 9.5, for example), the coverage is often ad hoc and not complete. The suggested parameters fall into the following areas:
FIGURE 9.17 Hierarchical system views.
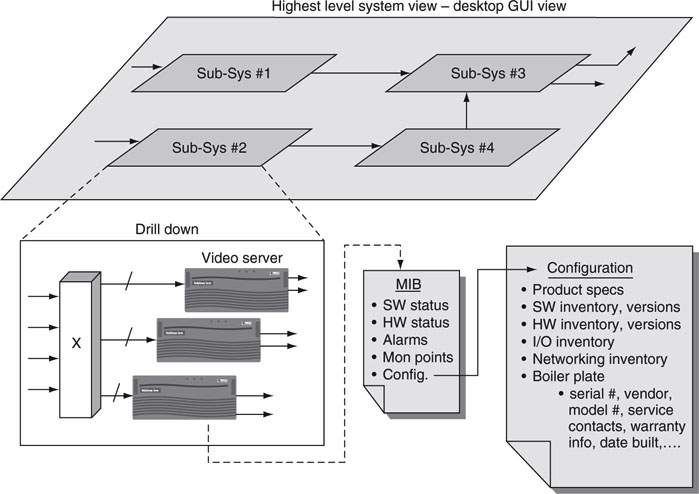
• Product specs—summary of product specs; this is very useful when new personnel are doing troubleshooting
• HW, SW, I/O, and networking inventory along with versioning information
• Boilerplate information, as listed in Figure 9.17
This is offered in the spirit of a unified vendor configuration data structure. True, it is not complete, but with a little vendor cooperation, the details could be nailed down in short order. Some parameters need to be updatable to reflect changes in device SW and HW inventory and versioning. As a result, the update method needs to be obvious and easy to use. Well, that is it for the status quo of device and system management. What does the future portend? Let us see.
9.6 FUTURES—DCML
Managing more for less is the CFO’s mantra. Only by using standards and leveraging the world of open systems will this happen. Managed IT sets the stage for how A/V should be managed. Progressive vendors see this, and others are following.
On the bleeding edge of managed systems is the work effort by Organization for the Advancement of Structured Information Standards (OASIS, www.oasis-open.org). OASIS4 is a not-for-profit, international consortium that drives the development, convergence, and adoption of e-business standards. The consortium produces more Web service standards than any other organization, along with standards for security, e-business, and standardization efforts in the public sector and for application-specific markets. Its standards encompass much more than device management. At the center of its efforts is the Data Center Markup Language (DCML).
DCML provides the first specification that provides a structured model and encoding to describe, construct, replicate, and recover data center environments and elements. Using DCML, companies have a standard method to enable data center automation, utility computing, and system management solutions.
DCML provides the only open XML-based specification designed to do for the data center what HTML did for content and IP did for networking: achieve interoperability and reduce the need for proprietary approaches. It does this by providing a systematic, vendor-neutral way to describe the data center environment and policies governing the management of the environment.
The methodology is the first standard model to describe both a recipe and a blueprint of the data center environment. As a culinary recipe provides both the list of ingredients and the instructions for successfully combining them, DCML provides both an inventory of data center elements and the desired functional relationship between them. In this way, all of its component relationships, dependencies, configuration, operational policies, and management processes are well documented so that automated processes can take over the load of running and maintaining business processes.
9.7 IT’S A WRAP—SOME FINAL WORDS
“If you cannot measure it, then you cannot improve it.” This chapter provides an overview of the big picture for monitoring and diagnostics of IT and AV/IT equipment and systems. Use this information to ask providing vendors what management solutions they offer, how they integrate with existing IT monitoring gear, and what standards are supported. You will not likely find the ideal solution because the A/V industry has only recently started providing standardsbased management solutions. So, accept the immature status quo of current solutions and support industry efforts to create progress toward the nirvana of 100 percent managed AV/IT systems.
1 Element 3A reproduced with permission of Pixelmetrix, Inc. Element 3 reproduced with permission of Tektronix, Inc.
2 MIBs, SNMP, and WBEM are described in more detail in Section 9.4. If you cannot wait, read ahead to learn more about these important IT-related specifications.
3 Some of the information in this section is paraphrased from the www.dmtf.org Web site.
4 Some of the information in this section is paraphrased from the OASIS Web site.
REFERENCES
Mauro, D., et al. (2001). Essential SNMP. Sebastopol, CA: O’Reilly.