
Being an end-to-end development environment, Visual Studio Code offers opportunities that you will not find in other code editors. In fact, in Visual Studio Code, you can work with many project types and debug your code in several languages. This chapter explains how to scaffold projects supported in Visual Studio Code and how to use all the built-in, powerful debugging features.
Creating Applications
Visual Studio Code is independent from proprietary project systems and platforms and, consequently, it does not offer any built-in options to create projects. This means that you need to rely on the tools offered by each platform. In this section, I will explain how to scaffold projects based on .NET Core, but you can similarly create projects with the command line interface offered by other platforms.
It is also recommended to create a dedicated folder on disk for the next examples. With the help of the file manager tool on your system (Windows Explorer on Windows, Finder on macOS, and Nautilus on Ubuntu), create a folder called VSCode under the root folder, such as C:VSCode or ~/Library/VSCode. In this folder, you will shortly create new applications.
Creating .NET Core Projects
.NET Core is the cross-platform, open-source, modular runtime from Microsoft to build applications using C#, F#, and Visual Basic that run on Windows, macOS, and Linux distributions. With .NET Core, you can create different kinds of applications such as web applications, Web API REST services, Console applications, and class libraries. Plans are to support desktop technologies as well.
.NET Core ships with a rich command line interface, which provides many options to create different kinds of applications. Discussing all supported project types is not possible here, so you can refer to the official documentation available at https://dot.net .
In this section I will show an example based on an ASP.NET Core web application built upon the model-view-controller (MVC) pattern. Creating a .NET Core application is accomplished via the command line. Open a command prompt or a terminal instance on the VSCode folder created previously, depending on your system.
If you typed dotnet run, the application would run in the default web browser. However, the goal is understanding how to run and debug the application in Visual Studio Code. So, open the project folder with VS Code. You can also type code . to open Visual Studio Code from the command line. Thanks to the C# extension, VS Code will recognize the presence of the .csproj project file, organizing files and folders and enabling all the powerful code editing features you learned previously.
Running the application with an instance of the debugger attached, where a debugger is available for the current project type. In the case of .NET Core, this ships with its own debugger that integrates with VS Code.
Running the application without an instance of the debugger attached.

The .NET Core web application running
ASP.NET Core web applications use an open-source development server called Kestrel ( https://github.com/aspnet/KestrelHttpServer ), which allows for independency from proprietary systems. By default, Kestrel listens for the application on port 5001, which means your application can be reached at http://localhost:5001. The default port setting can be changed inside a file called launch.json, which I will discuss more thoroughly in the next paragraphs.
With simple steps, you have been able to create and run a .NET Core project in VS Code that you can certainly edit as you need with the powerful C# code editing features.
Creating Projects on Other Platforms
where MyCordovaProject is the name of the new project. Once you have a new or existing Cordova project, you can install the Cordova Tools extension for Visual Studio Code ( https://marketplace.visualstudio.com/items?itemName=vsmobile.cordova-tools ). This extension will add support for Cordova projects to the integrated debugger for Node.js, providing specific configurations to target Android and iOS devices, as well as simulators.
Note
You will also need some additional specific tools for Cordova, depending on what system you intend to target. For iOS, you will need to install the tools described in the iOS Platform Guide from Apache Cordova ( https://cordova.apache.org/docs/en/latest/guide/platforms/ios/index.html ). For Android, you will need to install the tools described in the Android Platform Guide from Apache Cordova ( https://cordova.apache.org/docs/en/latest/guide/platforms/android/index.html ).
Debugging Your Code
The ability of debugging code is one of the most powerful features in Visual Studio Code and probably the one that makes it a step forward if compared to other code editors. Visual Studio Code ships with an integrated debugger for Node.js applications and can be extended with third-party debuggers. For instance, if you have .NET Core installed, the C# extension for Visual Studio Code detects the availability of a compatible debugger and takes care of attaching it to VS Code.
Let’s consider C# and .NET Core as the example on how debugging works, so reopen the HelloWeb folder created previously.
Note
All the features discussed in this chapter apply to all the supported debuggers (both built-in and via extensibility), so they are not specific to C# and .NET Core.
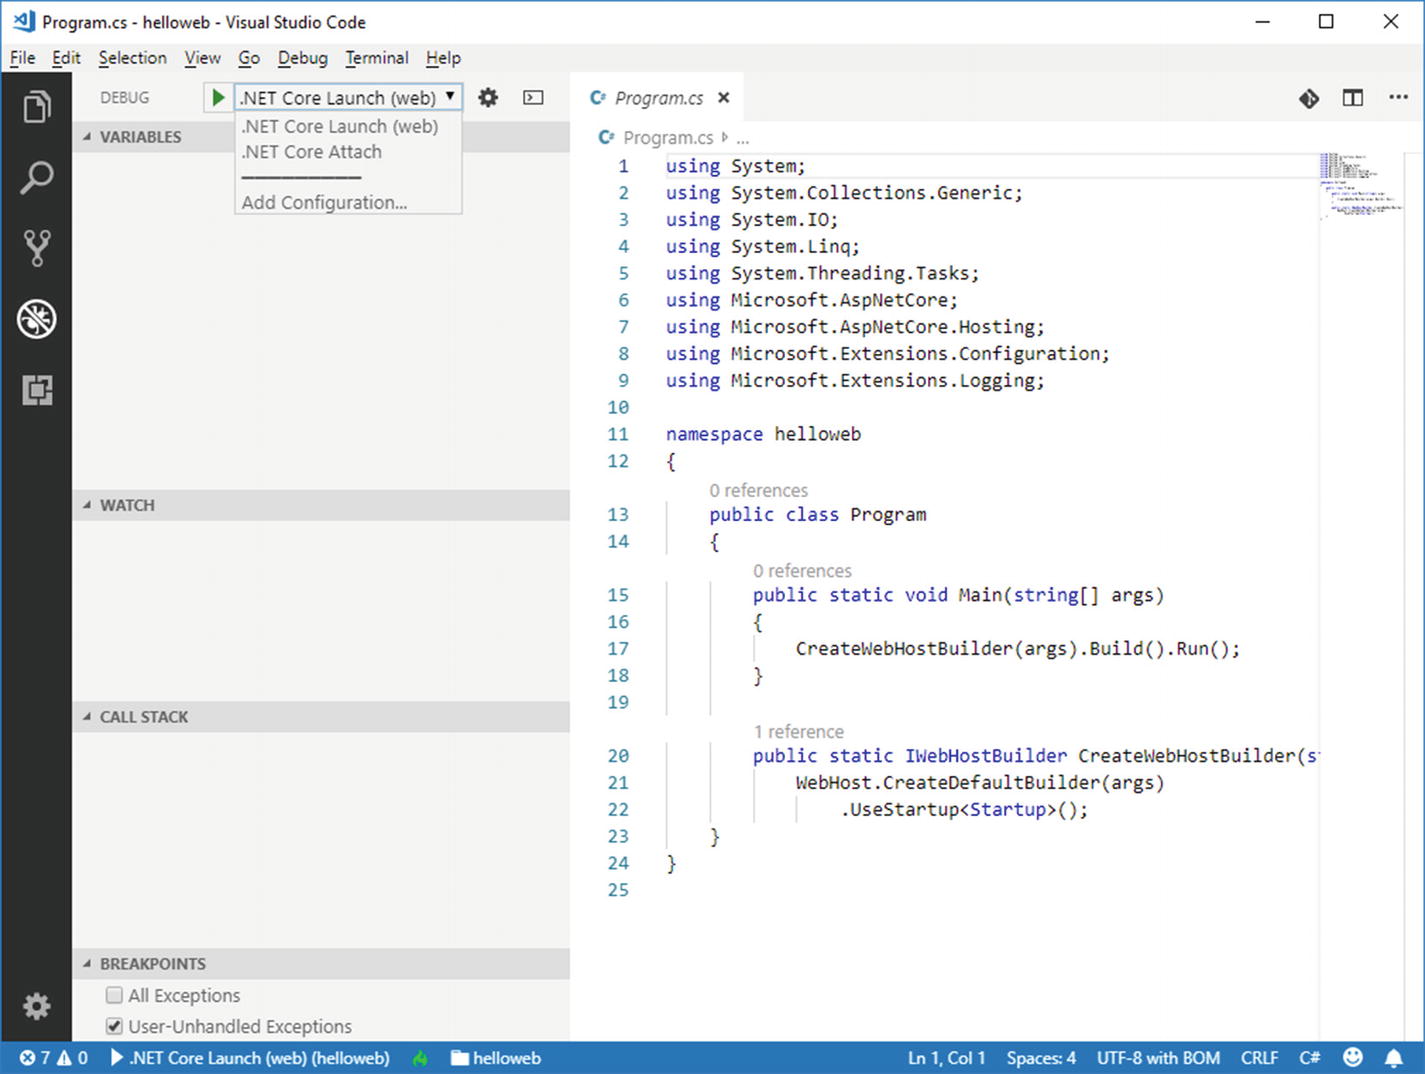
The Debug view
The Start Debugging button, represented with the green play icon. By clicking this button, you will start the application with an instance of the debugger attached.
The configuration dropdown box. Here you can select a debugger configuration for running the application.
The settings button, represented with the gear icon and whose tooltip says Open launch.json (details coming shortly).
The Debug Console button, which opens the Debug Console panel where you see the output messages from the debugger.
After this quick overview, you will now learn about debugger configurations, and then you will walk through the debugging tools available in VS Code.
Configuring the Debugger
Before a debugger can inspect an application, it must be configured. For Node.js and for platforms like .NET Core, where an extension takes care of everything, default configurations are provided. If you take a look at Figure 9-2, you can see how there are two predefined configurations, .NET Core Launch (web) and .NET Core Attach.
The first configuration is used to run the application within the proper host, with an instance of the debugger attached. For an ASP.NET Core web application like in the current example, the host is the web browser. In the case of a Console application, the host would be the Windows’ Console or the Terminal in macOS and Linux. The second configuration can be instead used to attach the debugger to another running .NET Core application.
Note
Actually, there is a .NET Core Launch configuration that is different for each kind of application you create with .NET Core. For example, the configuration for Console applications is called .NET Core Launch (Console). The concept to keep in mind is that a Launch configuration is provided to attach an instance of the debugger to the current project.
name, which represents the configuration friendly name.
type, which represents the type of runtime the debugger is running on.
request (launch or attach), which determines whether the debugger is attached to the current project or to an external application.
preLaunchTask, which contains any task to be executed before the debugging session starts. Usually, this property is assigned with the default build task.
program, which represents the binary that will be the subject of the debugging session.
launchBrowser, where operating system-specific properties contain the command that will be executed to start the application.
env, which represents the environment. In the case of .NET Core, a value of Development instructs VS Code to run the Kestrel development server.
If you wanted to implement custom configurations, launch.json is the place where you would add them. Because these two configurations, and more generally default configurations, are enough for most of the common needs, custom configurations will not be covered in this book. The documentation provides additional details about this topic ( https://code.visualstudio.com/docs/editor/debugging#_add-a-new-configuration ).
Note
If you click the Add Configuration command in the configuration dropdown box, you will be able to select from a built-in list of configurations that you can add to launch.json. This can be useful especially in those cases where VS Code should detect a project type and its configuration, but actually doesn’t.
Managing Breakpoints

Adding breakpoints
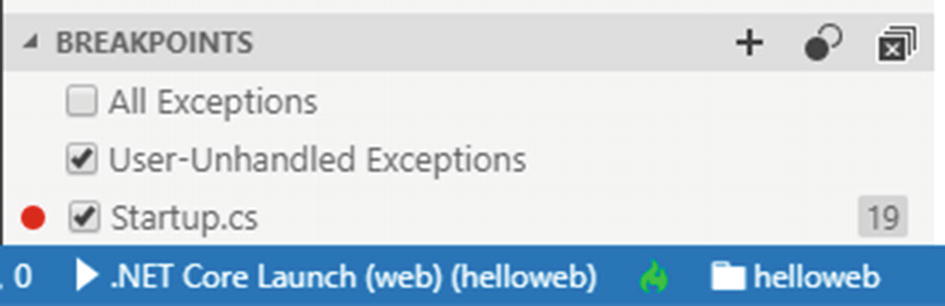
Managing breakpoints
Here you can see the list of files that contain any breakpoint and the line numbers. You can also cause the debugger to break on user-unhandled exceptions (default) and on all exceptions. You can click the Add Function Breakpoint (+) button. Instead of placing breakpoints directly in source code, a debugger can support creating breakpoints by specifying a function name. This is useful in situations where source is not available but a function name is known.
Debugging an Application
Now it is time to start a debugging session, so that you will be able to see in action all the debugging tools and make decisions when breakpoints are hit. In the Debug view, make sure the .NET Core Launch (web) configuration is selected, then click the Start button or press F5. Visual Studio Code will launch the debugger, and it will display the output of the debugger in the Debug Console panel.
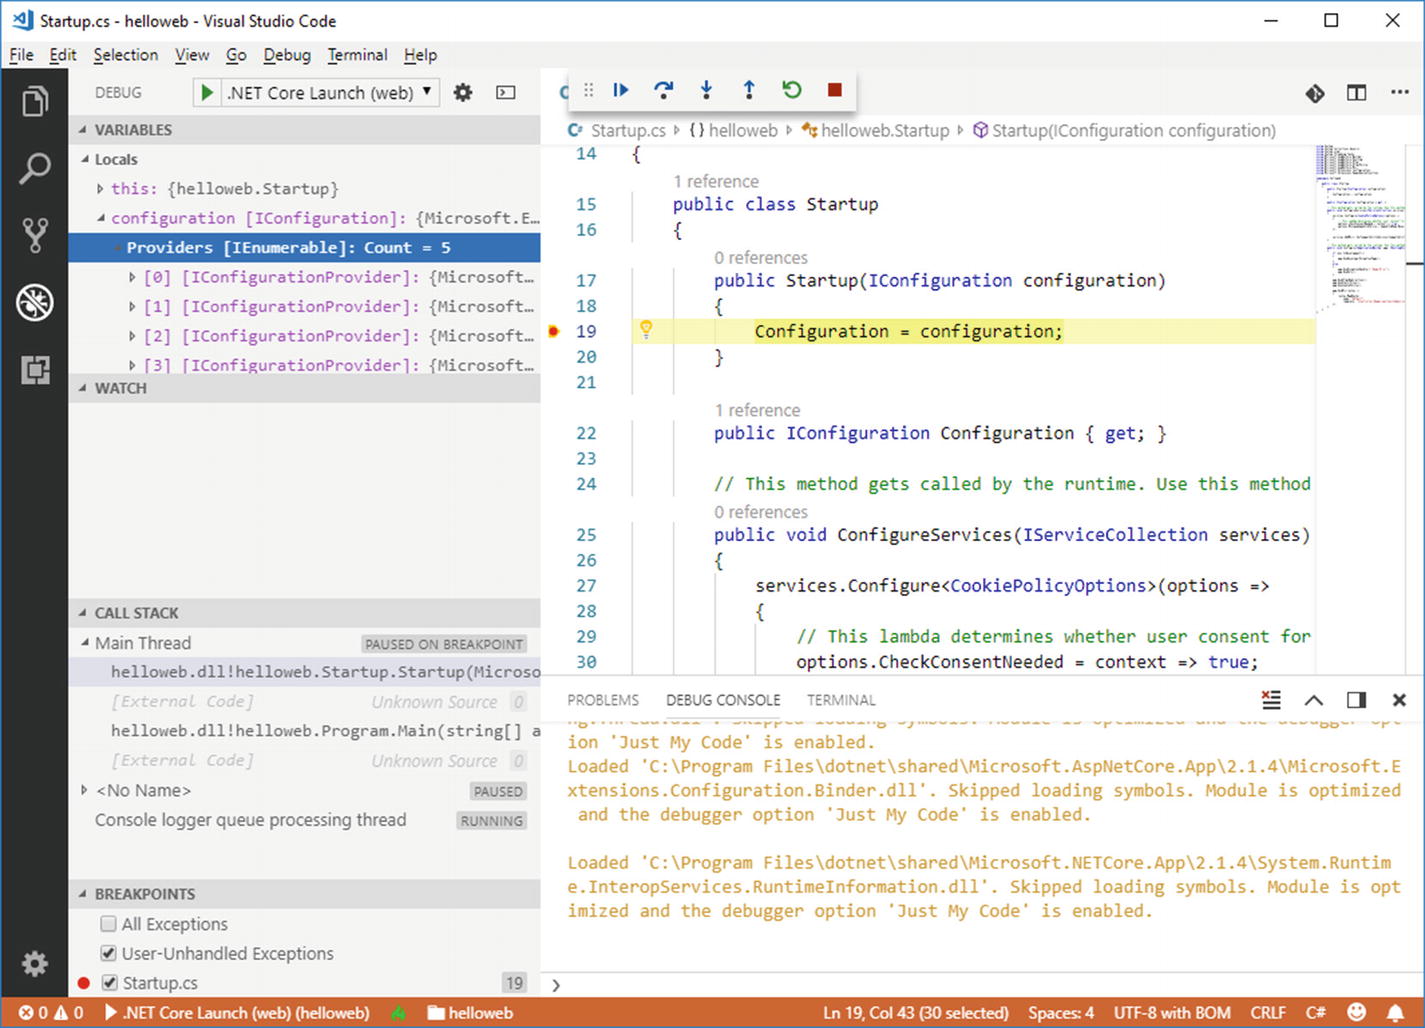
The debugging tools while a breakpoint is being hit
VARIABLES, which shows the list of variables that are currently under the debugger control and that you can investigate by expanding each variable.
WATCH, a place where you can evaluate expressions.
CALL STACK, where you can see the stack of method calls. If you click a method call, the code editor will bring you to the code that is making that call.
BREAKPOINTS, where you can manage breakpoints.
Continue, which allows continuing the application execution after breaking on a breakpoint or an exception
Step Over, which executes one statement at a time except for method calls, which are invoked without stepping into
Step Into, which executes one statement at a time, including statements within method bodies
Step Out, which executes the remaining lines of a function starting from the current breakpoint
Restart, which you select to restart the application execution
Stop, which you invoke to stop debugging
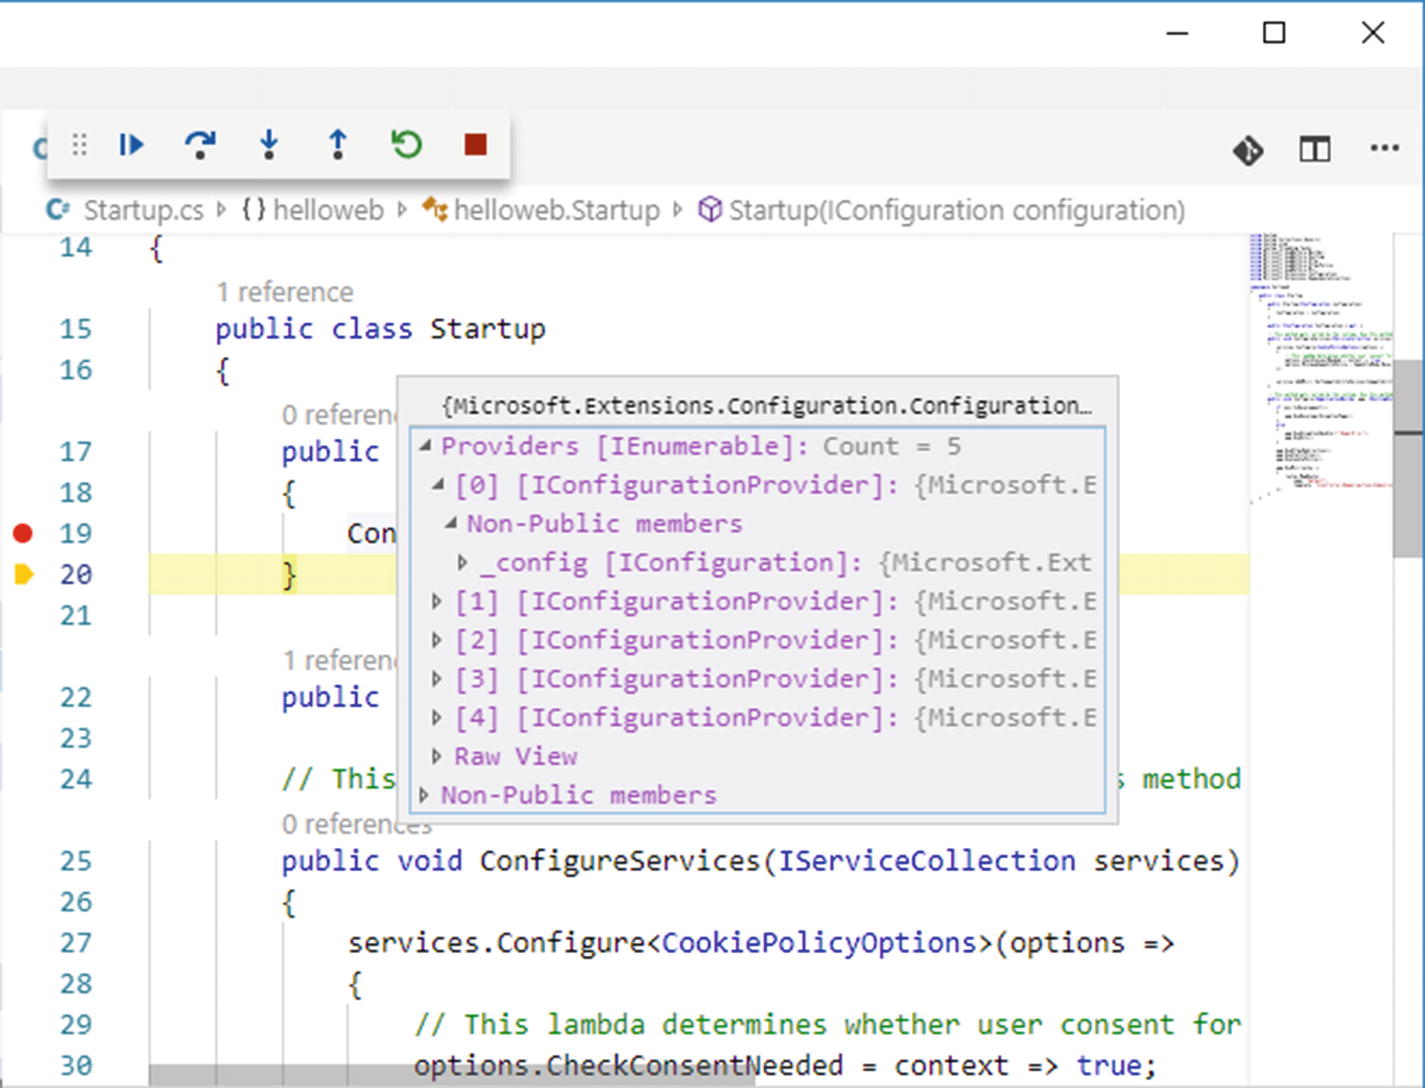
Investigating property values at debugging time
Evaluating Expressions

Evaluating expressions
The Call Stack

Walking through method calls
The code editor can highlight method calls only if it is part of the source code, but this feature is very useful especially when you encounter errors and you need to step back through the code.
The Debug Console Panel
The Debug Console is certainly the place where VS Code shows the debugger output but, as the name implies, it is also an interactive panel where you can evaluate expressions. You can type the expression near the > symbol and then press Enter.
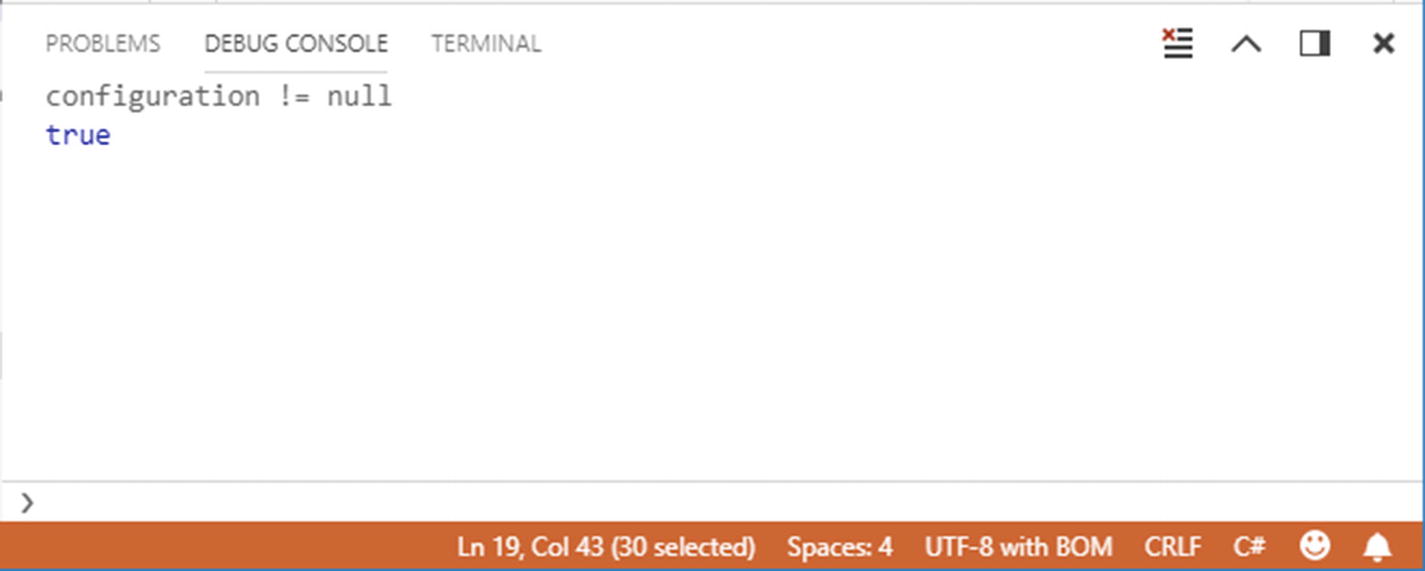
Evaluating expressions in the Debug Console panel
Supporting Azure, Docker, and Artificial Intelligence
Microsoft has made many investments in the last couple of years to add to Visual Studio Code support for the most modern technologies and development scenarios. In fact, Microsoft has developed several extensions that allow for integrating with Microsoft Azure, Docker, and artificial intelligence services.
Azure Functions, which allows for developing Azure functions in VS Code and publishing to Azure directly from the environment
Azure App Service, which allows for deploying and scale web and mobile apps to Azure directly from VS Code
Azure CLI Tools, which provides interaction with the Azure command line interface from Visual Studio Code
Deploying Applications to Azure ( https://code.visualstudio.com/docs/azure/deployment )
Working with Docker ( https://code.visualstudio.com/docs/azure/docker )
Visual Studio Code Tools for AI ( https://github.com/Microsoft/vscode-tools-for-ai )
Visual Studio Code, with its extensibility model and being independent from proprietary systems, can target an incredible number of development scenarios, from web to mobile to cloud.
Summary
The power of Visual Studio Code as a development environment comes out when you work with real applications. With the help of specific generators, you can easily generate .NET Core projects using C# or Node.js projects. This chapter described how you can leverage a powerful, built-in debugger that offers all the necessary tools you need to write great apps, such as breakpoints, variable investigation, call stack, and expression evaluators.
You finally saw how VS Code can target advanced scenarios such as deploying applications and functions to Azure, packaging Docker images, and consuming artificial intelligence services.
By completing this chapter, you have walked through all the most important and powerful features you need to know to write great cross-platform applications using Visual Studio Code.