
Before you use Visual Studio Code as the editor of your choice, it is convenient for you to know how the workspace is organized and what commands and tools are available, in order to get the most out of the development environment.
The VS Code’s user interface and layout are optimized to maximize the space for code editing, and it also provides easy shortcuts to quickly access all the additional tools you need in a given context. More specifically, the user interface is divided into five areas: the code editor, the status bar, the activity bar, panels area, and the side bar. This chapter explains how the user interface is composed and how you can be productive getting the most of it.
Note
All the features discussed in this chapter apply to any file in any language, and they will be available regardless of the language you see in the figures (normally C#). You can open one or more code files via File ➤ Open File to get some editor windows active and understand the features discussed in this chapter. Then in Chapter 4, “Working with Files and Folders,” I will discuss more thoroughly how you can work with individual files and multiple files, in one or more languages concurrently.
The Welcome Page
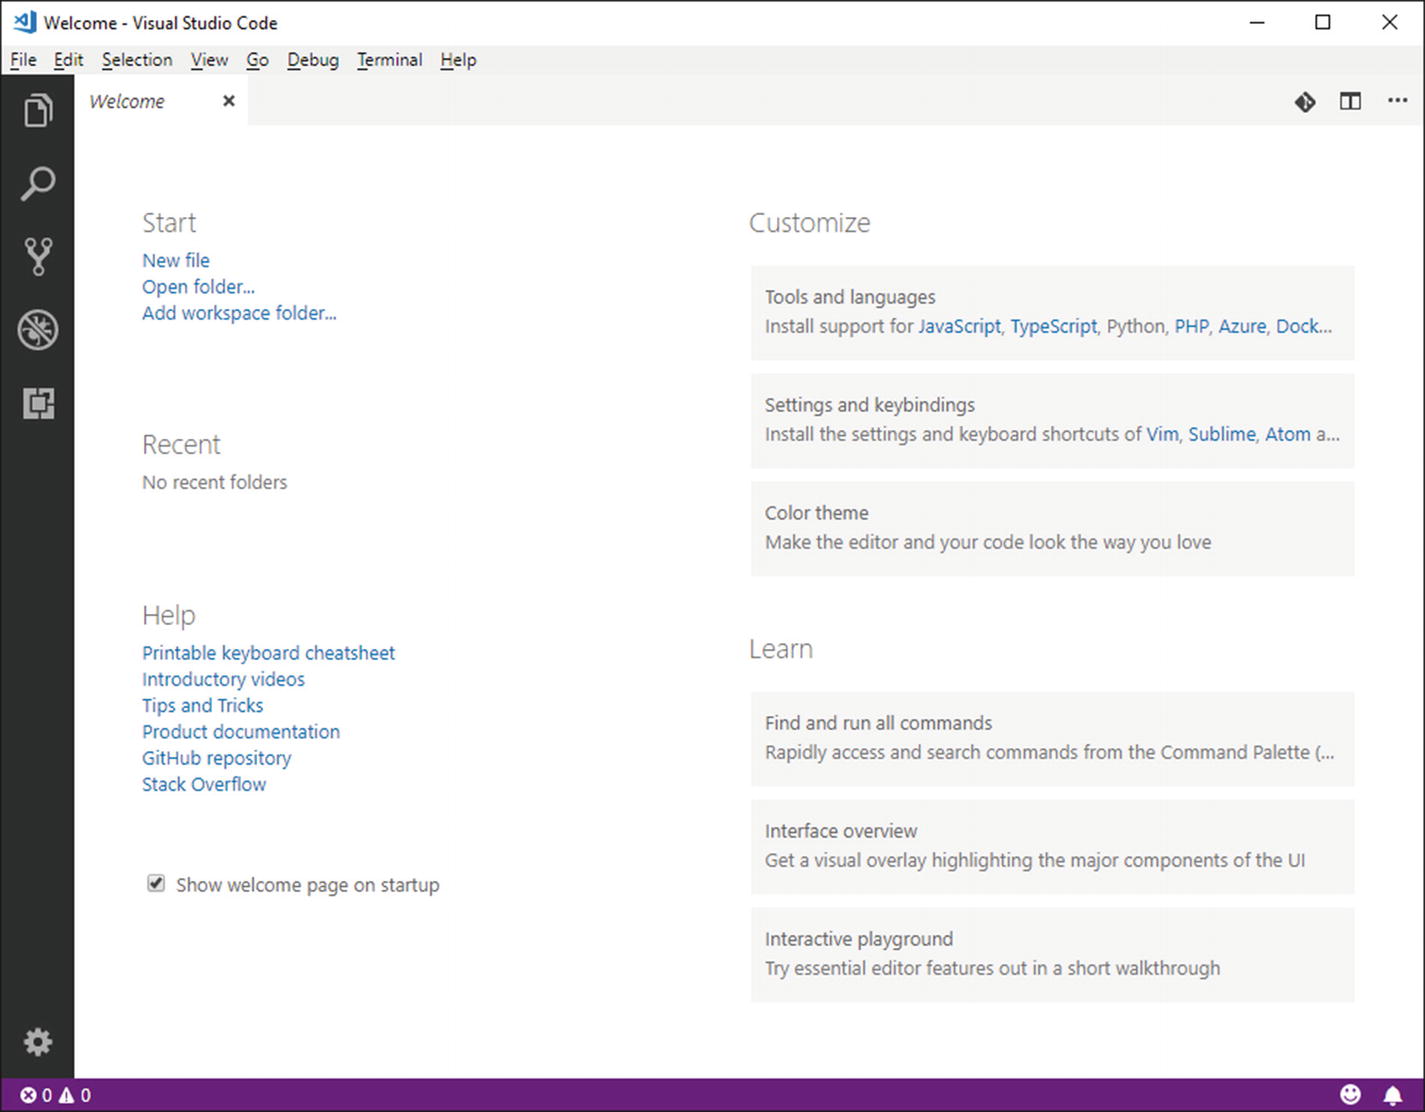
The Welcome page
On the left side of the page, under the Start group, you will find shortcuts for creating and opening files and folders. Under the Recent group, you will find a list of recently opened files and folders that you will be able to click for fast opening. Under the Help group, there are useful links to cheat sheets, introductory videos, product documentation, and other learning resources about Visual Studio Code. On the right side, under the Customize group, you can find shortcuts to customize Visual Studio Code by installing extensions, changing keyboard shortcuts and color themes. Under the Learn group, you will find additional shortcuts to learning resources about commands and the user interface. Most of the features highlighted in the Welcome page will be discussed across this book. By default, the Welcome page is set to show up every time you launch Code. You can remove the flag from the Show welcome page on startup checkbox to change this behavior.
The Code Editor

The code editor and multiple file views
Right-click a file name in the Explorer bar and then select Open to Side.
Ctrl-click a file name in the Explorer bar.
Ctrl+ (or ⌘+ on macOS) to split the editor in two.
Notice that if you already have three files open and you want to open another file, the editor that is active will display that file. You can quickly switch between editors by pressing Ctrl + 1, 2, and 3. The code editor is the heart of Visual Studio Code and provides tons of powerful productivity features that will be deeply discussed in the next chapter. For now, it is enough to know how to open and arrange editor windows.
Reordering, Resizing, and Zooming Editor Windows
Editor windows can be reordered and resized based on your preferences. Reordering editors can be done by clicking the editor’s header (which is where you see the file name) and moving it to a different position. Resizing an editor can instead be accomplished by clicking the mouse left button over the editor’s border, when the pointer appears as a left/right arrow pair.
You can also zoom in and out the active editor by clicking Ctrl++ and Ctrl+-, respectively. As an alternative, you can select View ➤ Zoom in and View ➤ Zoom out.
Note
In Visual Studio Code, the zoom is actually an accessibility feature. As an implication, when you zoom the code editor, the activity bar and side bar will also be zoomed.
The Status Bar

The status bar
Git version control information and options, such as the current branch.
Errors and warnings detected in the source code.
The cursor position expressed in line and column.
Indentation information, in this case Spaces: 4. You can click this to change the indentation size and to convert indentation to tabs or spaces.
The encoding of the current file.
The current line terminator.
The language for the open file. By clicking the current language name, you will be able to change the language from a dropdown list that will pop up.
The project name, if you open a folder that contains a supported project system. It is worth noting that, in case the folder contains multiple project files, clicking this item will allow switching between projects.
The feedback button, which allows sharing your feedback about Visual Studio Code on Twitter.
The notification icon, which shows the number of new notifications (if any). Notification messages typically come from extensions or they are about product updates.
It is worth mentioning that the status bar color changes depending on the situation. For example, it is violet when you open a single file, blue when you open a folder, and orange when Visual Studio Code is in debugging mode.
The Activity Bar

The Activity bar
The Activity bar provides shortcuts for the Explorer, Search, Git, Debug, Extensions, and Settings tools, each described in the next section. When you click a shortcut, the side bar related to the selected tool becomes visible. You can click again the same shortcut to collapse again the side bar.
The Side Bar
The Side bar is one of the most important tools in Visual Studio Code, certainly the tool you will interact more with together with the code editor. It is made of five tools, each enabled by the corresponding icon, described in the next subsections.
The Explorer Bar

The Explorer bar
Note
You must hover over the folder name (APP1 in Figure 2-5) in order to get the four buttons visible.
The subview that shows a folder structure provides four buttons (from left to right): New File, New Folder, Refresh, and Collapse All, each self-explanatory. The OPEN EDITORS subview has instead three buttons (which you get when hovering over with the mouse): Toggle Vertical/Horizontal Editor Layout, Save All, and Close All Files. Right-clicking a folder or file name in Explorer provides a context menu that offers common commands (such as Open to Side you saw at the beginning of this chapter). A very interesting command is Reveal to Explorer (or Reveal to Finder on Mac and Open Containing Folder on Linux), which opens the containing folder for the selected item. Notice that the Explorer icon in the Activity bar also reports the number of modified files.
The Outline View
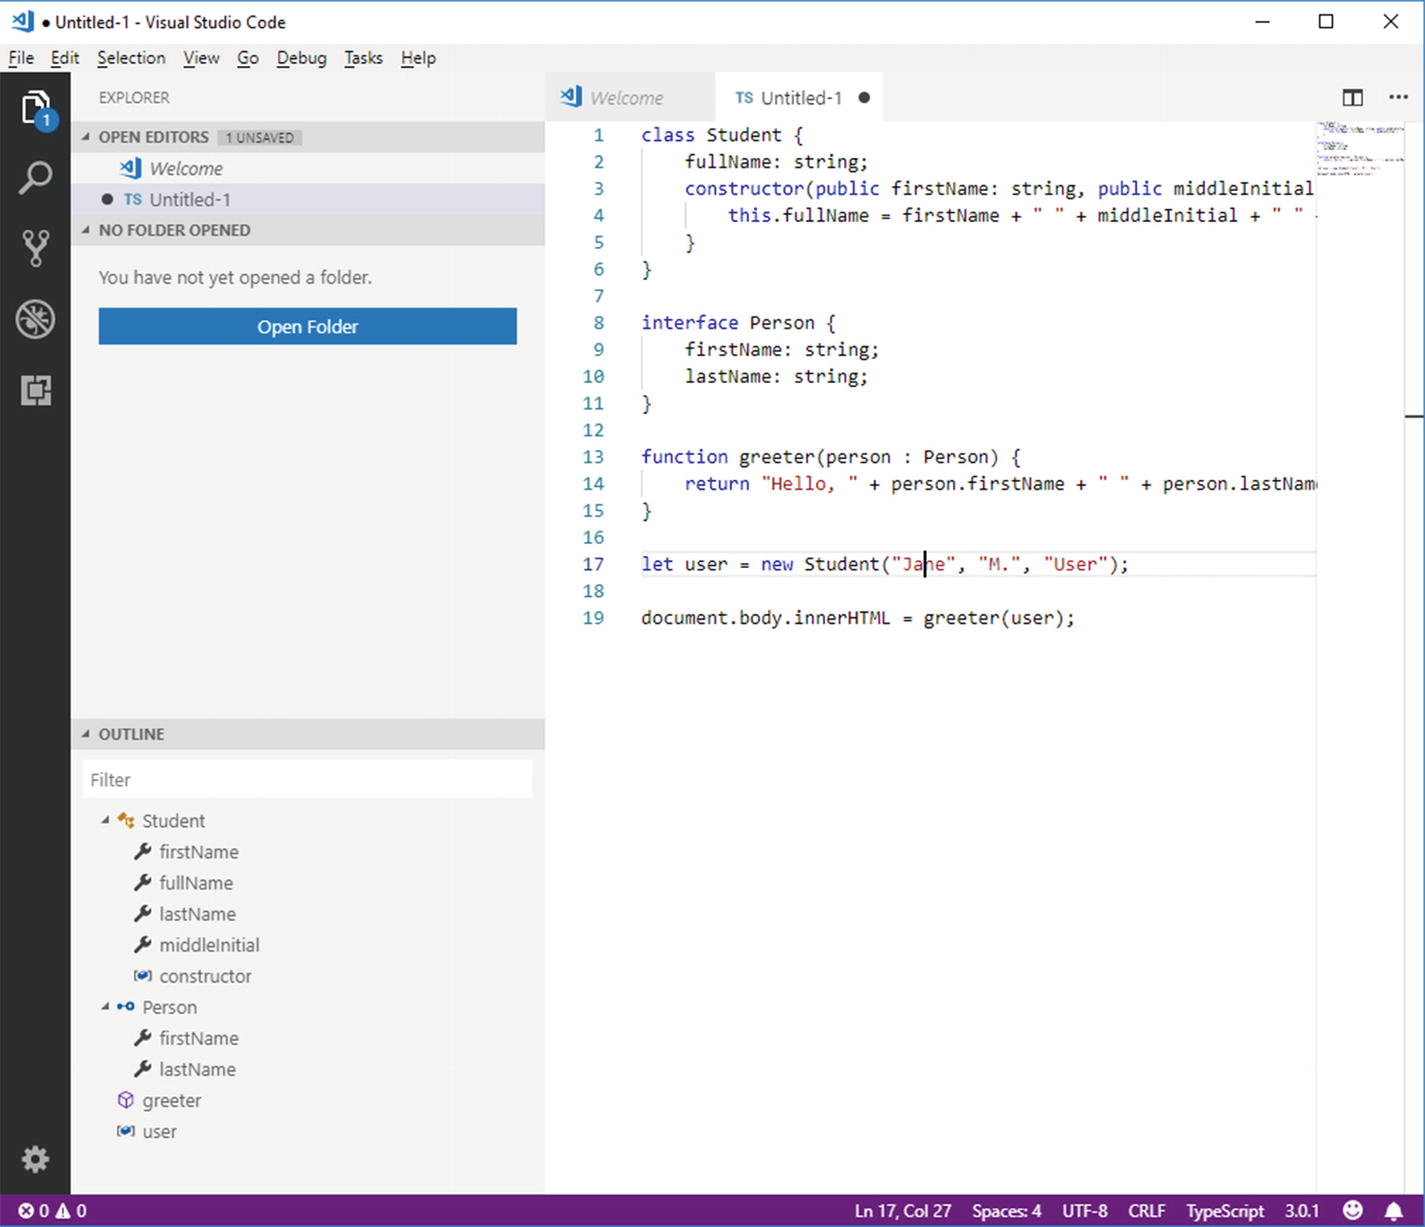
The Outline view on a TypeScript file
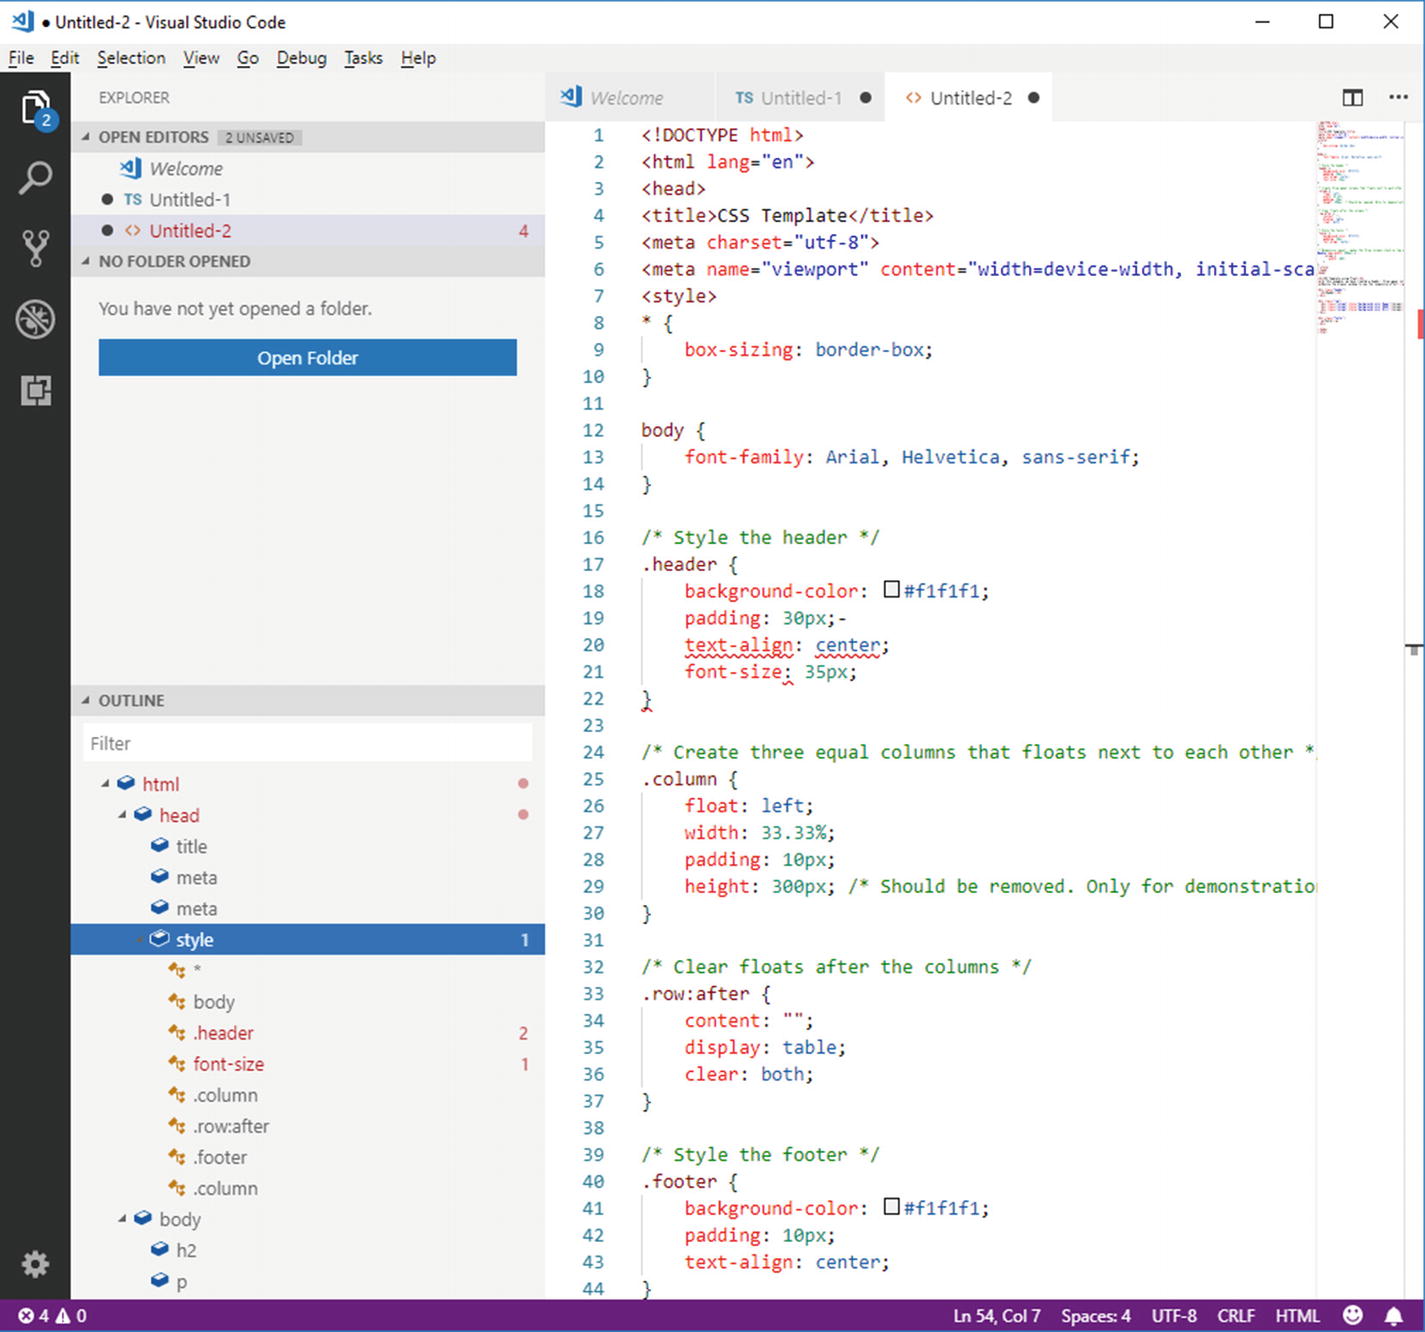
The Outline view on a HTML file
You can expand types and members to see what other objects they define, and you can click each item and get the cursor over the selected item definition in the source code. Also, you can type in the Filter text box to restrict the list of items based on a search criterion. It is worth mentioning that Visual Studio Code highlights with a different color (red in the case of the Visual Studio Light Theme) items that have potential problems and that are highlighted with squiggles in the code editor.
The Search Tool
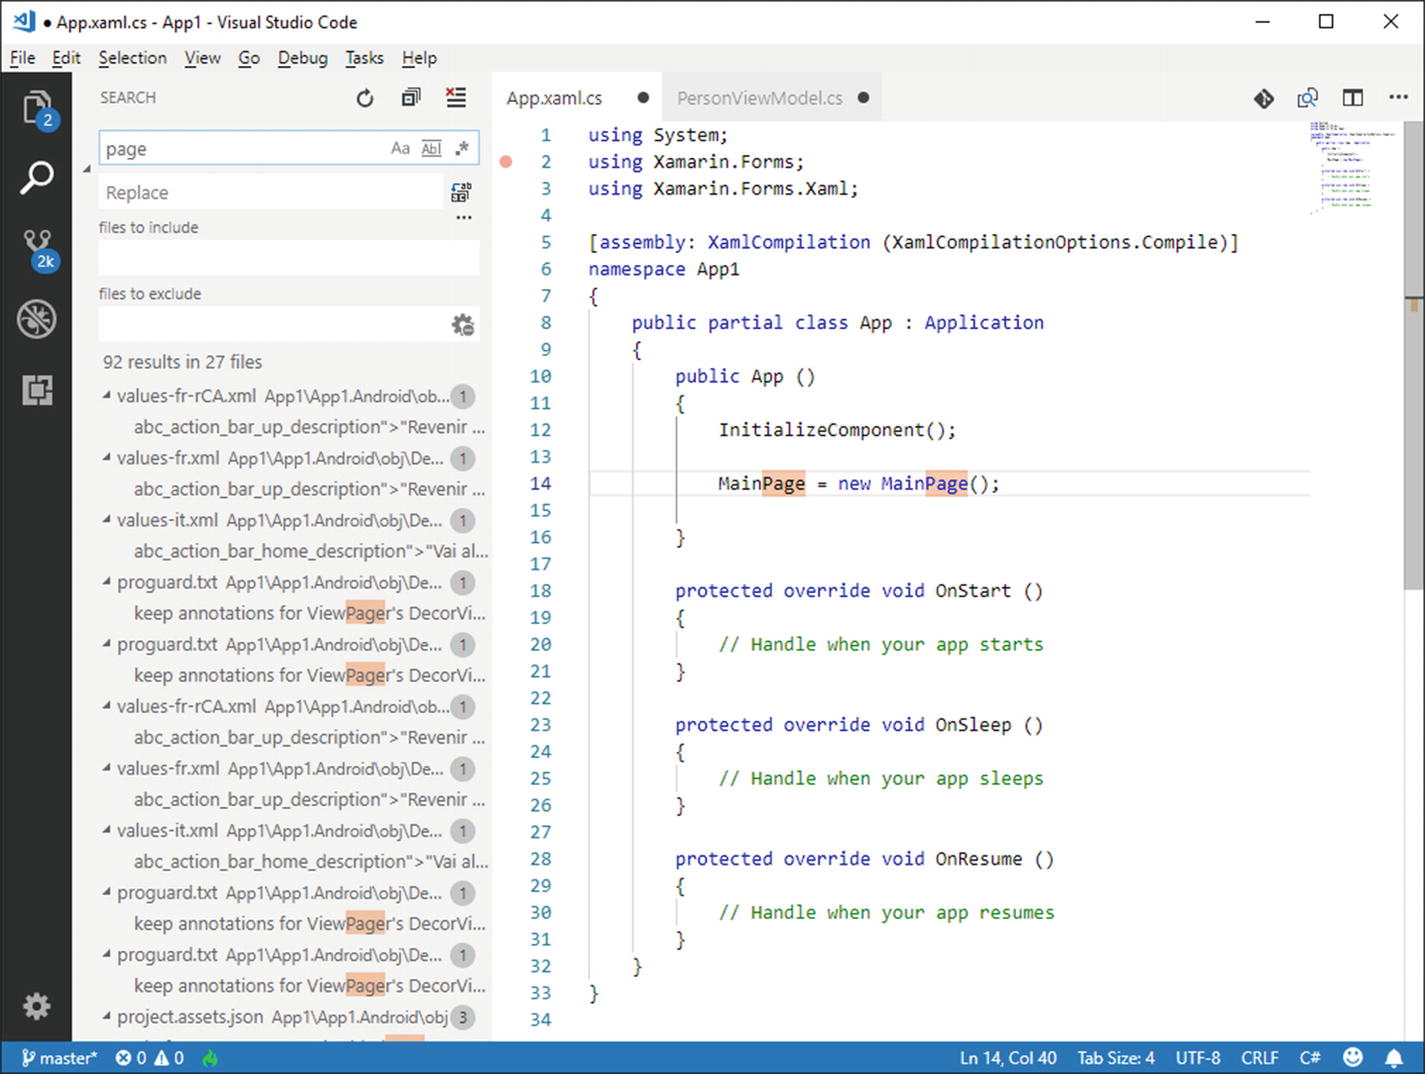
The Search tool
Search results are presented in a hierarchical view that groups all the files that contain the specified search key, showing an excerpt of the line of code that contains it. Occurrences are also highlighted in both the list of files and in the code editor. You can finally clean up search results by clicking the Clear Search Results button . If you instead wish to replace some text with a new text, you can do this by entering the new text into the Replace text box and then by clicking the Replace All button .
The Git Bar
The Side bar provides access to Git integration for version control. Git integration is a core topic and will be thoroughly discussed in Chapter 7, “Source Control with Git,” but a quick look is provided here for the sake of completeness about the Side bar.
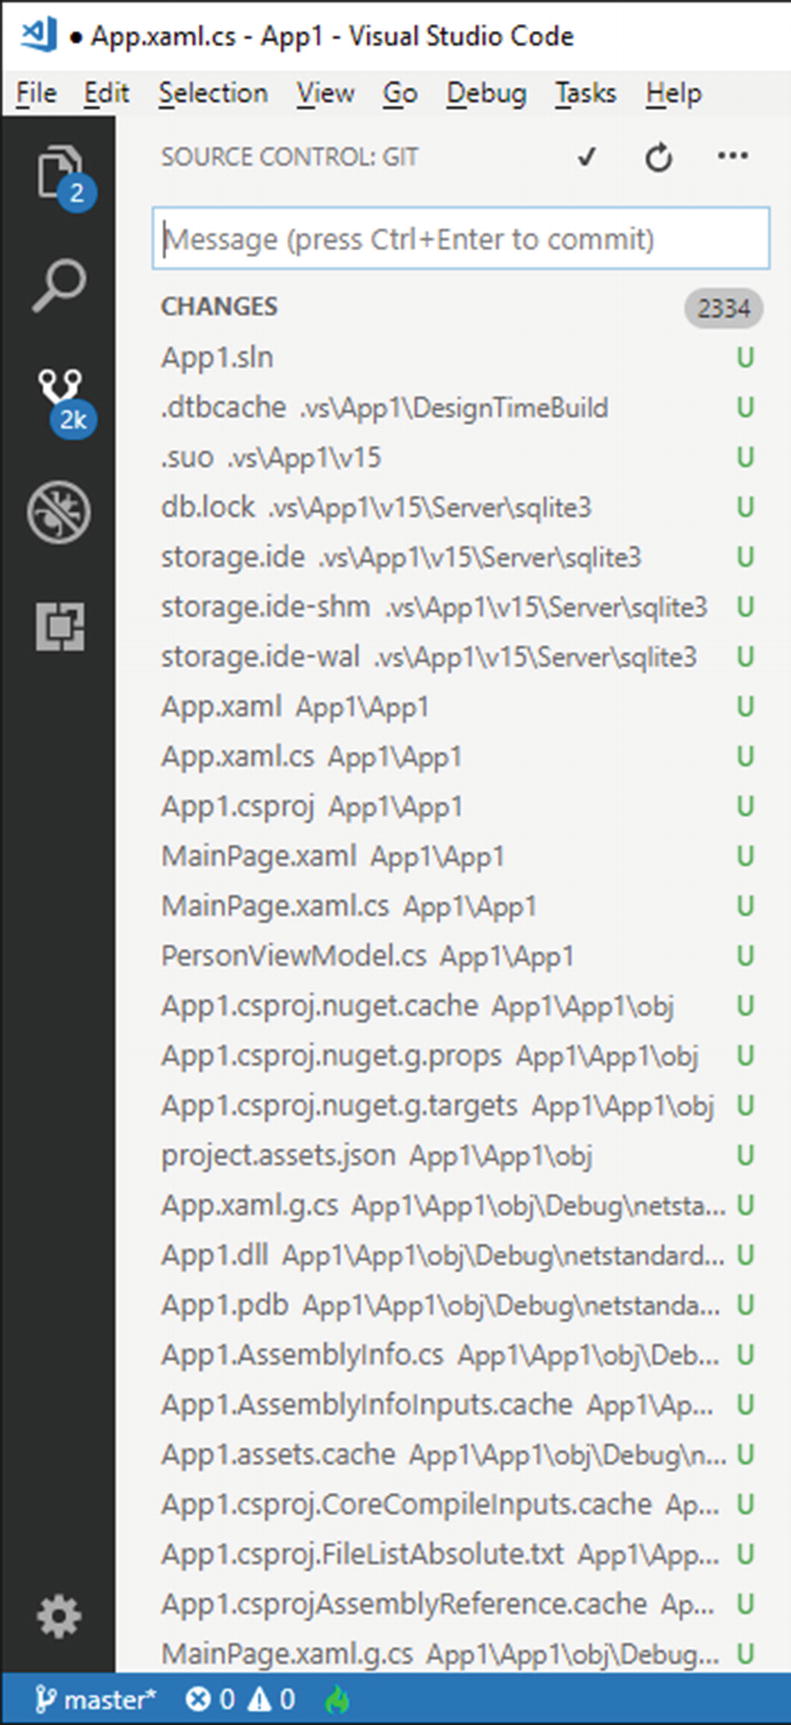
The Git bar
The Git bar also provides a popup menu that you can see by clicking the … button at the top-right corner of the bar and that contains the list of supported Git commands in Visual Studio Code. As I said before, Git integration will be described later in the book.
The Debug Bar
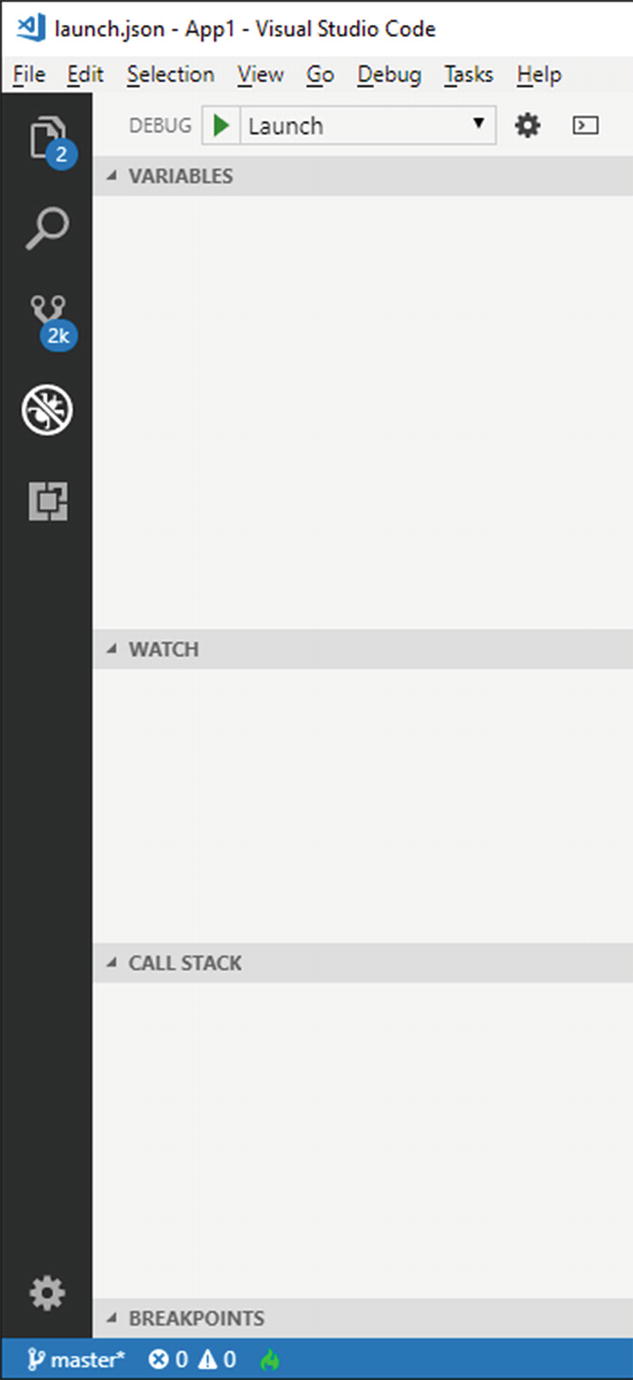
The Debug bar
In Chapter 9 you will see how powerful the debugging tools are in Visual Studio Code and how easy is installing additional debuggers .
The Extensions Bar
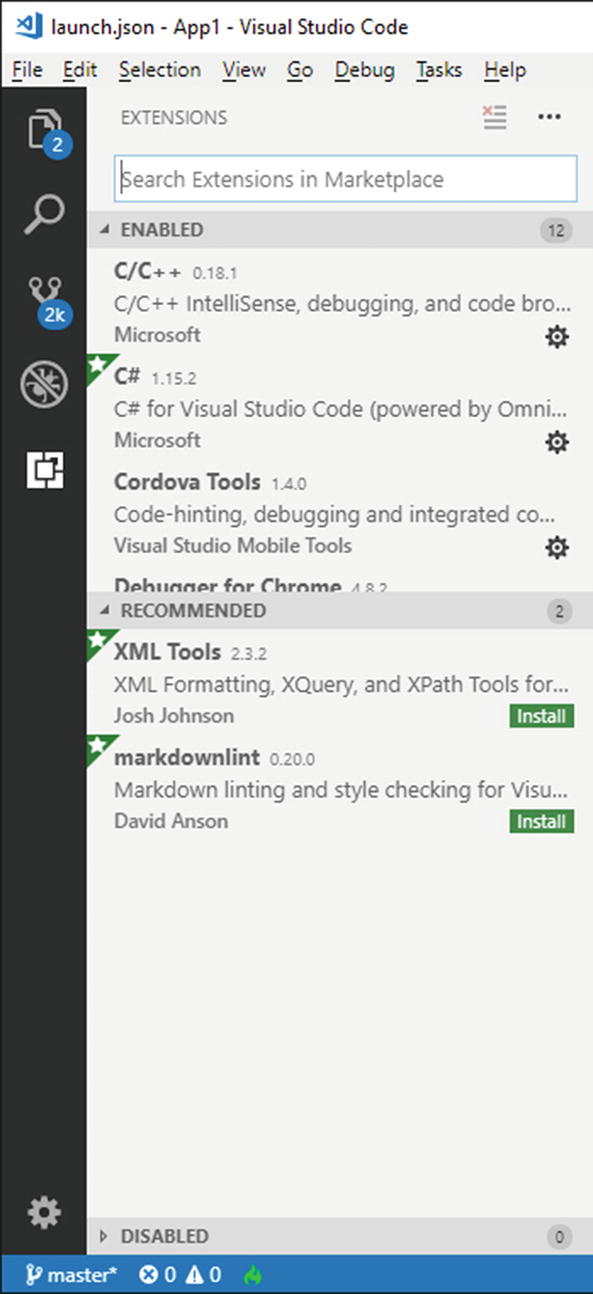
The Extensions bar
Not only you can search online for extensions, but you can see the list of installed extensions as well as disabled and recommended extensions.
The Settings Button
The Settings button is represented with the gear icon, at the bottom of the Activity bar. If you click it, you will see a popup menu with a list of commands that represent shortcuts for customizing Visual Studio Code and that will be discussed more thoroughly in Chapter 5, "Customizing Visual Studio Code." Among the others, a command in the menu allows for manually searching for product updates.
Navigating Between Files
Visual Studio Code provides two ways of navigating between files. The quickest way is pressing Alt+Left or Alt+Right to switch between active files.
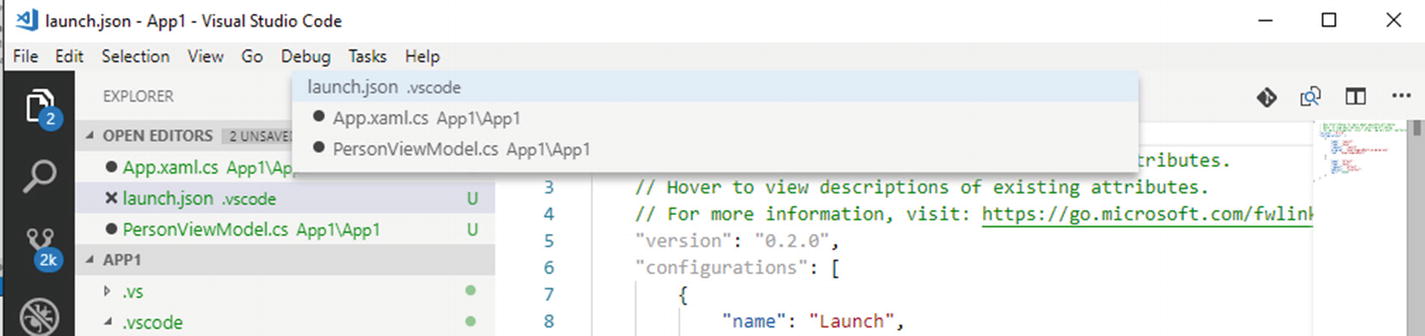
Navigating between active files
The Command Palette

The Command Palette
The Command Palette is not just about menu commands or to user interface instrumentation but also to other actions that are not accessible elsewhere. For instance, the Command Palette allows installing extensions as well as restoring NuGet packages over the current project or folder. You can simply move up and down to see the full list of available commands, and you can type in some characters to filter the list. You will notice how many of them map actions available within menus and that, for many of them, there is a keyboard shortcut available. Other commands, such as extension, debug, and Git commands, will be discussed in the next chapters, so it is important that you get started with the Command Palette at this point.
The Panels Area
Visual Studio Code will very often need to display information about source code but also information coming from the Git engine, external tools, or debuggers. To accomplish this in an organized way, the environment provides the so-called Panels area, which appears by default at the bottom of the user interface.
The Panels area is made of four built-in panels: Problems, Output, Debug Console, and Terminal, each discussed in this section. The Panels area is not visible by default, and it usually pops up when the information they represent becomes available (such as the debugger sending information about symbols in the source code). Additionally, by default it appears at the bottom of the VS Code’s user interface, but you can move it to the side of the workspace with a button called Move to Right that each panel provides, and then you can restore the original layout with another button called Move to Bottom . Let’s now discuss each panel in more detail.
The Problems Panel
With languages that have built-in enhanced editing support, such as TypeScript ( www.typescriptlang.org ), or for which an extension has been added to provide advanced editing features, such as C#, Visual Studio Code can detect code issues as you type. In the code editor, these are usually highlighted with red squiggles (for blocking errors) and in green (for warnings). The list of errors, warnings, and informational messages is also displayed in the Problems panel. This can be enabled by clicking the number of errors at the bottom-left corner of the status bar (see Figure 2-11).

The Problems panel
In case you have multiple files opened, the Problems panel will group problems by file name. Also, for each problem, you will be able to see the folder name and the position within the source code file. Just double-click a problem, and VS Code will move the cursor to the selected item in the code editor.
Note
The code editor also provides a way to quickly fix code issues while typing, but this is not related to the Problems panel and will instead be discussed in the next chapter.
The Output Panel

The Output panel
Because multiple tools might run concurrently during an operation against source code files (e.g., package restore and then compilation) or during the Visual Studio Code lifetime (such as extensions), you can use the dropdown box in the panel to change the view and see the output of each tool. This tool is particularly useful if the execution of external tools fails and you want to get more information about what happened.
The Debug Console Panel

The Debug Console panel
Not only the Debug Console shows information about code execution, debug symbols, and any other information a debugger needs to display, but it also acts as an interactive console where you can evaluate expressions. If you take a look at Figure 2-16, you can see how a mathematical expression has been manually evaluated using variables defined in the code. Debugging is a very important topic in Visual Studio Code and is thoroughly discussed in Chapter 9, "Running and Debugging Code," where you will find additional information about the Debug Console.
Working with the Terminal

The Terminal panel
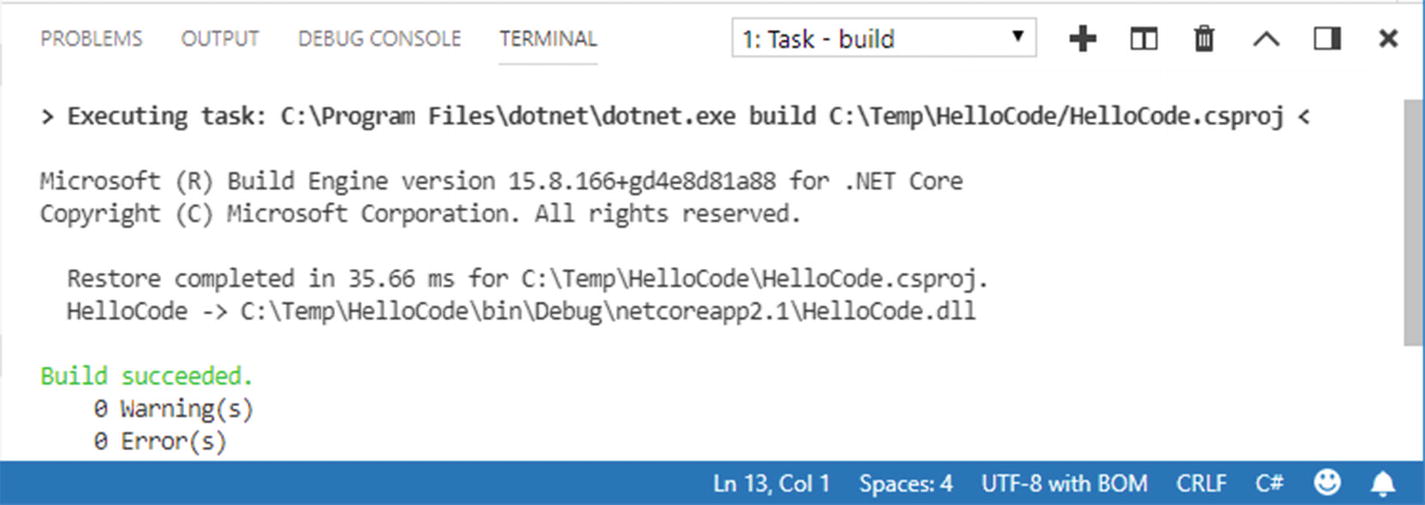
The Terminal panel used for automatic scripting
Summary
In this chapter, you got an overview of the workspace in Visual Studio Code and of the tools you will interact more with. You saw how to take advantage of quick shortcuts in the Welcome page and how you can arrange editor windows.
You saw how the status bar provides information about the active file and how the Activity bar is a collapsed container of shortcuts for the tools contained in the Side bar: the Explorer bar, the Search tool, the Git bar, the Debug bar, the Extensions bar, and the Settings button. You saw how to quickly navigate between files and how the Command Palette provides a way for accessing commands via the keyboard, both Visual Studio Code commands and extensions’ commands. You have also walked through another important area in the environment, the Panels area, where you can get information about code issues, messages from internal and external tools and debuggers, and where you can execute commands and scripts via the Terminal. Now that you have seen how the environment is organized, it is time to get fun walking through all the powerful productivity features in the code editor. This is the topic of the next chapter.