
CHAPTER 5
Debugging
When the terminal outputs an error while running a program, you can refer to the Problems panel in the editor to resolve the issue you're experiencing. However, not all bugs result in errors. It may be the case that your program executes successfully, but the output is not what you expected. When such a scenario occurs, the next step is to identify and remove errors in the program. This process is referred to as debugging.
You could attempt to locate and resolve the issue through trial and error by commenting lines of code (thus disabling the code blocks from running), adding more print statements to output when code blocks have executed, or modifying lines within the program. While each approach may help you get to a point where you can identify the bug and a potential fix, this process is inefficient. Fortunately, that's where using a debugger comes in handy.
Visual Studio Code has a built-in debugger in which its features are further extended with the Python extension. While the debugger is useful to help you identify and fix the bug, it is still your responsibility to identify where the bug may be located in your code. Once you identify where the bug potentially exists, use the debugger to help you keep track of the state of your program as it executes.
Before you begin the exercises in this chapter, open the debugger folder in Visual Studio Code and create and activate a virtual environment. The exercises in this chapter instruct you to open each file as needed in the editor.
Starting a Debug Session
As the codes stands, if you were to run the debugger, the debugging session would start and stop relatively quickly as all code in the program would have been executed, given that there are no errors in the code. To get the debugger to pause during execution, a breakpoint must be set on a line of the code. Breakpoints are set wherever you want to examine the runtime state of the program and then possibly step line by line through the code. In Visual Studio Code, breakpoints appear as a red dot in the editor margin (see Figure 5.1). When a debug session starts, the debugger executes all lines of code up to the breakpoint and highlights the next line to be executed. (The exception to this is if you're stepping, which is later explained in the “Debug Commands” section.)
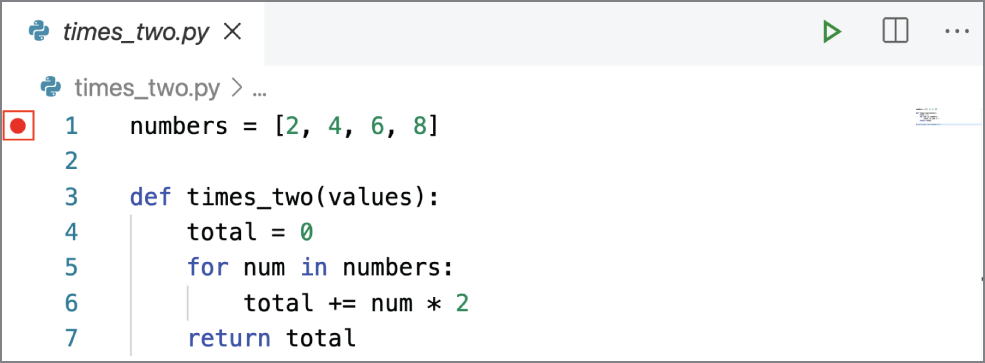
Figure 5.1: A breakpoint is set on line 1 of the code.
To add a breakpoint, hover over the editor margin for the current line of code and click to add a breakpoint. Alternatively, use the keyboard shortcut F9 for the current line of code. To remove a breakpoint, select the breakpoint in the editor margin or press F9 again. You could also remove all breakpoints by selecting Run in the top menu followed by Remove All Breakpoints.
Try It Out: Refer to the following comments and add a breakpoint for each respective line in times_two.py
:
# This program takes a value in a list, multiples the value by 2, and adds the product to a variable total.numbers = [2, 4, 6, 8] # add a breakpoint to this linedef times_two(values): # add a breakpoint to this linetotal = 0for num in numbers:total += (num * 2)return totalprint(times_two(numbers))
You could force a breakpoint by calling debugypy.breakpoint() at any point where you want to pause the debugger during a session. If forcing a breakpoint, import debuypy must be within the code. When called, the debugger stops on the next line of code. This approach hard-codes the breakpoint in the program. A scenario in which this might be useful is if you have some callback functions that happen asynchronously and you don't want to set, clear, enable, or disable them with other breakpoints. By hard-coding a few of the breakpoints, you can catch if and when the callback functions happen.
You can start a debug session in these ways:
- Menu: Select Run ➪ Start Debugging.
- Keyboard shortcut: Press F5.
- Run view: Click Run And Debug (appears if no debug session is active, as shown in Figure 5.2).
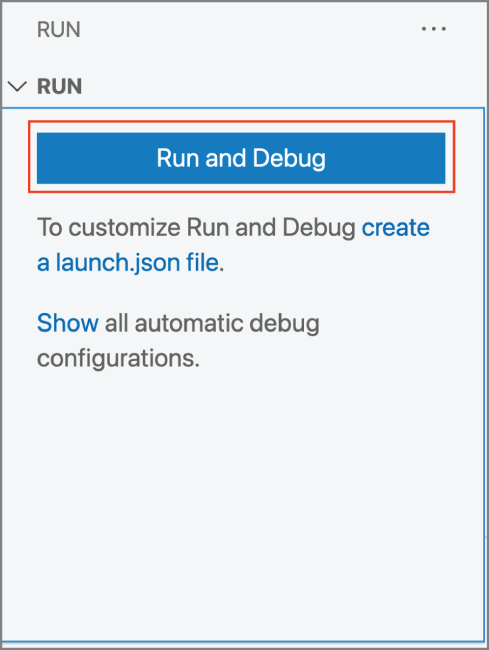
Figure 5.2: The Run And Debug button appears in the Run view if there is no debug session active.
- Run view: Click Start Debugging (appears after a debug session is initiated, as shown in Figure 5.3).
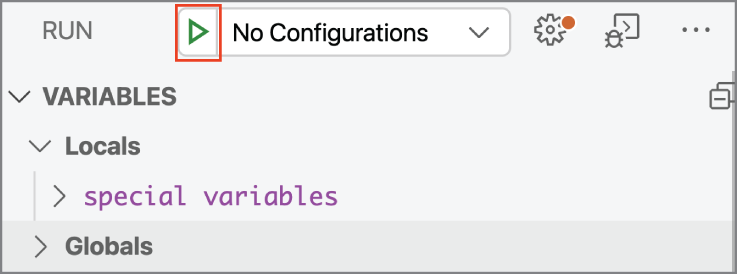
Figure 5.3: If there is an active debug session, click Start Debugging in the Run view to start the debugger.
The editor's behavior during the debug session is controlled by the Debug Configuration. Consider the debug configuration as a list of settings for how the debugger functions (see Figure 5.4). The Python extension provides several configurations that are later explored in “Launch Configurations.” When prompted during the exercises in this chapter, click the Python File configuration, which debugs the currently active Python file.
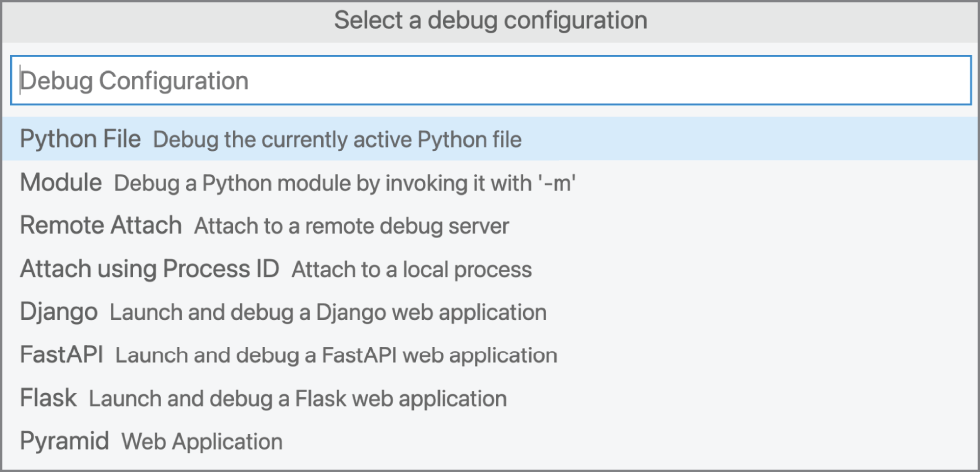
Figure 5.4: A list of configurations that are available appears before a debug session starts. Select a configuration to start the debugger.
Try It Out: Run the debugger.
After starting a debug session, the Run view opens. The Run view is used to manage a debug session (see Figure 5.5). While a debug session is active, the panels in the Run view dynamically change, depending on what is being executed.
As breakpoints are added to the code, the Breakpoints panel adds the module name (e.g., times_two.py) and its respective breakpoint line(s) to the list. Currently, there are two breakpoints in times_two.py—one on line 4 and the other on line 6. Selecting one of the breakpoints in the Breakpoints panel highlights the breakpoint in the editor (see Figure 5.6).
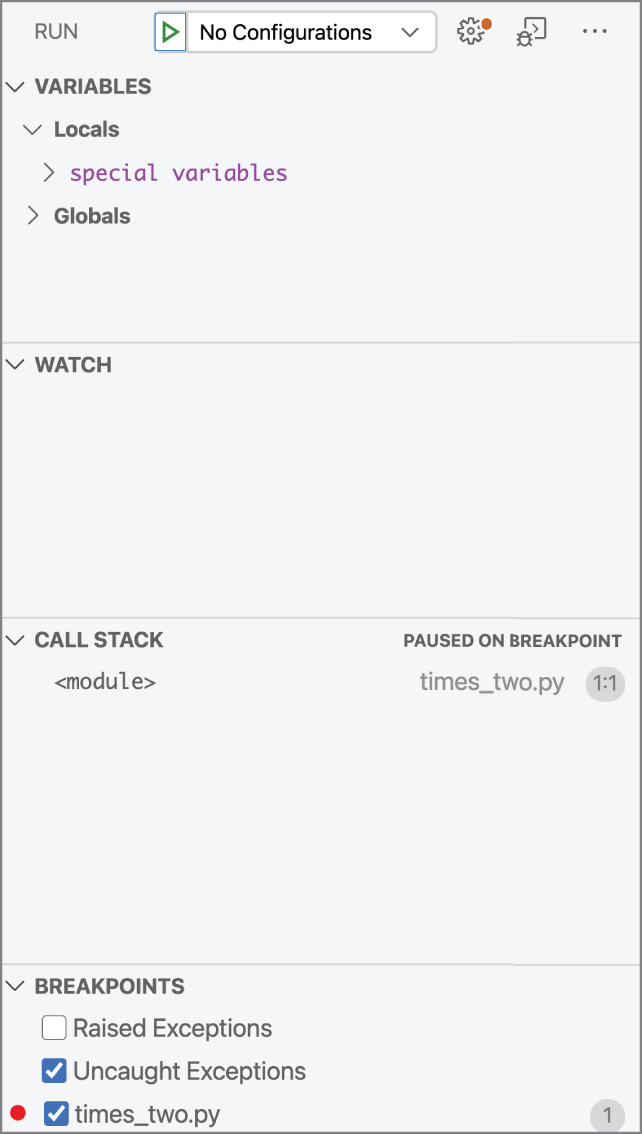
Figure 5.5: The Run view is where you can manage a debug session.
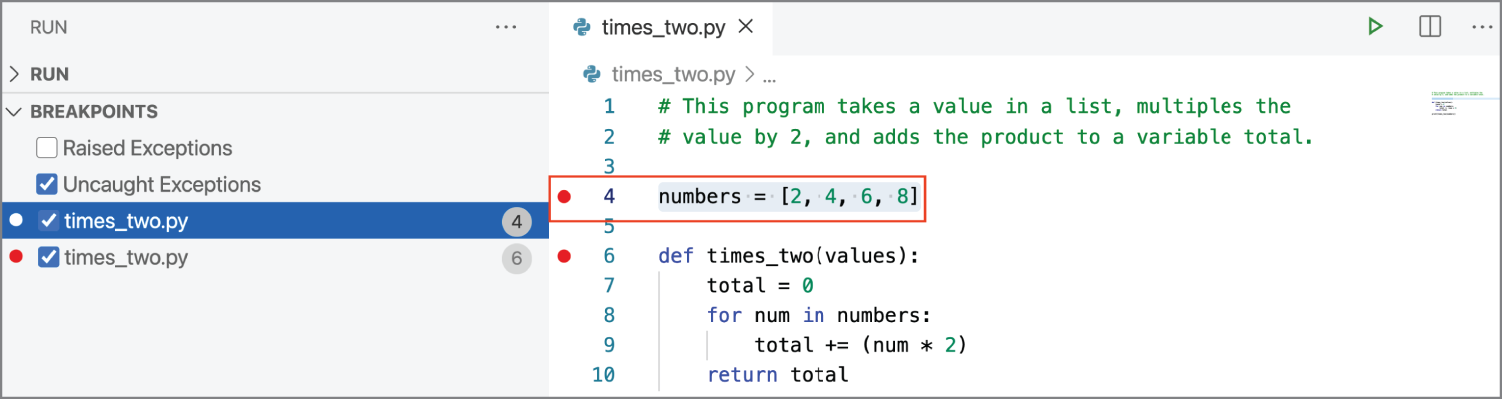
Figure 5.6: In the Breakpoints panel, the first breakpoint is selected, which highlights the breakpoint on line 3 of the program.
Suppose you have a program in which you've set up several breakpoints. While debugging, you decide that there's only select breakpoints you want to include during the session, thus avoiding the need to have the debugger pause at every breakpoint. Removing the unneeded breakpoints would delete the breakpoints, which may not be your intention if you intend to maintain the breakpoints for a subsequent debug session. Instead, you could disable the breakpoints. Breakpoints can be disabled in the Breakpoints panel by unchecking the box next to the breakpoint. Alternately, you could right-click the breakpoint and click Disable Breakpoint. If you'd rather disable all the breakpoints at once, you could do so by clicking the Deactivate Breakpoints (see Figure 5.7, A) button. However, if it is your intention to remove all breakpoints, click the Remove Breakpoints (see Figure 5.7, B) button. Removing all breakpoints is helpful if you want to ensure you've cleaned up all breakpoints you've set in a program.
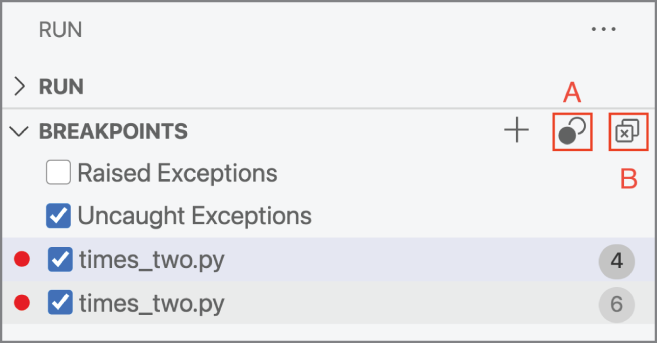
Figure 5.7: The button to deactivate all and remove all breakpoints are at the top right of the Breakpoint panel.
As the debugger runs, the current state of the variables is reflected in the Variables panel (see Figure 5.8). The Variables panel organizes variables into local and global scopes.
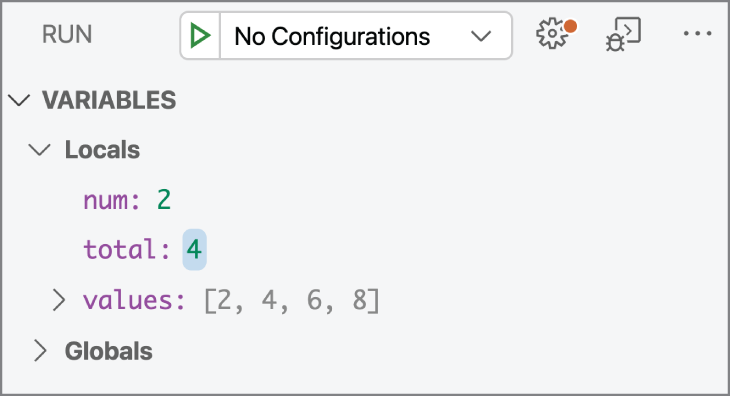
Figure 5.8: The Variables panel shows the current state of the variables as the program executes.
As you continue to debug, take note of how the variables within the panel change. Although the variables populate as the program executes, it's possible that the variable value produces an error, thus stopping the execution of your code. If you've identified that a different value would continue the execution of the program, you can change the value in the Variable panel. To change the value, highlight the variable and press Enter. After you enter a new variable, press Enter once more to save that modified value in the program state.
Debug Commands
In addition to the Run view, the Debug toolbar appears in the editor (see Figure 5.9). The Debug toolbar provides quick access to these debug commands:
- A—Continue (F5)
- B—Step Over (F10)
- C—Step Into (F11)
- D—Step Out (Shift+F11)
- E—Restart (Shift+Cmd/Ctrl+F5)
- F—Stop (Shift+F5)
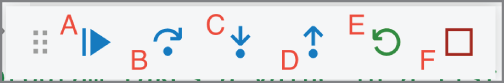
Figure 5.9: The Debug toolbar
The debug commands work together rather than independently; that is, you typically use a combination of commands to debug various lines of code.
In addition to the Debug toolbar commands, additional commands are available in the right-click context menu in the editor. These features include the following:
- Add Inline Breakpoint—Adds a breakpoint in line with the code, specifically at the code under the cursor. This is useful for a compound expression in a single statement in which you want to break on that specific part of the expression. Alternately, you could navigate to Run ➪ New Breakpoint ➪ Inline Breakpoint or use the keyboard shortcut Shift+F9.
- Run to Cursor—Runs a section of code without setting another breakpoint.
- Jump to Cursor—Skips lines or goes back and repeat lines of code.
Continue
When the debugger is stopped at a breakpoint, clicking Continue runs all the code after that breakpoint up to the next breakpoint or to the end of the program (see Figure 5.9, A). Given that there are two breakpoints within times_two.py, clicking Continue runs the debugger until the debugger pauses at the breakpoint for the times_two() function. Clicking Continue once more completes the execution and ends the debug session.
Try It Out: Click Continue to continue and complete the debug session. Once complete, remove the breakpoint set at the times_two() function.
Step Over
So far, you've used the Continue command to continue the debugger after it pauses at a breakpoint. To step line by line over the code, you can use the Step Over command. The Step Over command runs the line of code at which the debugger is presently paused and then pauses automatically at the next line without the need for another breakpoint (see Figure 5.9, B). If the current line is a function call, the debugger runs the function in its entirety and then pauses at the next line after the function call. Essentially, the Step Over command steps line by line at the current scope.
Try it Out: Run the debugger and step over each line of code. Notice that when the debugger reaches the times_two() function definition, the debugger's next step is the print() statement.
Step Into
Because the logic within the times_two() function is in a nested scope, the debugger would need a way to access those lines of code to step over each line within the function body. The Step Into command provides such functionality. When the debugger is paused at a function, the Step Into command steps into the function scope (see Figure 5.9, C). From there you can step over each line within the function scope and perhaps step into additional function calls. In short, stepping into any function enables you to see how the function works line by line.
Try It Out: Start the debugger and step into the times_two() function.
When the debugger steps into a function, the Locals subsection in the Variables panel updates each time a variable gets modified. Thus, for each iteration of the function, the variables within Locals are assigned new values.
Try It Out: Step over each line of the times_two() function and view the variable assignments in the Variables panel.
Before Iteration 1:
Before the first iteration occurs, the local variables reflect values: [
2,
4,
6,
8]. So far, values is the only variable that has been set given that it is passed into the function call.
Iteration 1:
When the debugger steps over the for loop for the first iteration, the num and total variables appear in the Variables panel. You can confirm the current iteration from the value assigned to the num variable (see Figure 5.10). In this case, the value is 2, which indicates that the first item in the numbers list is currently being evaluated in the for loop. As the debugger steps over each line to execute the first iteration, the value for total updates from 0 to 4.
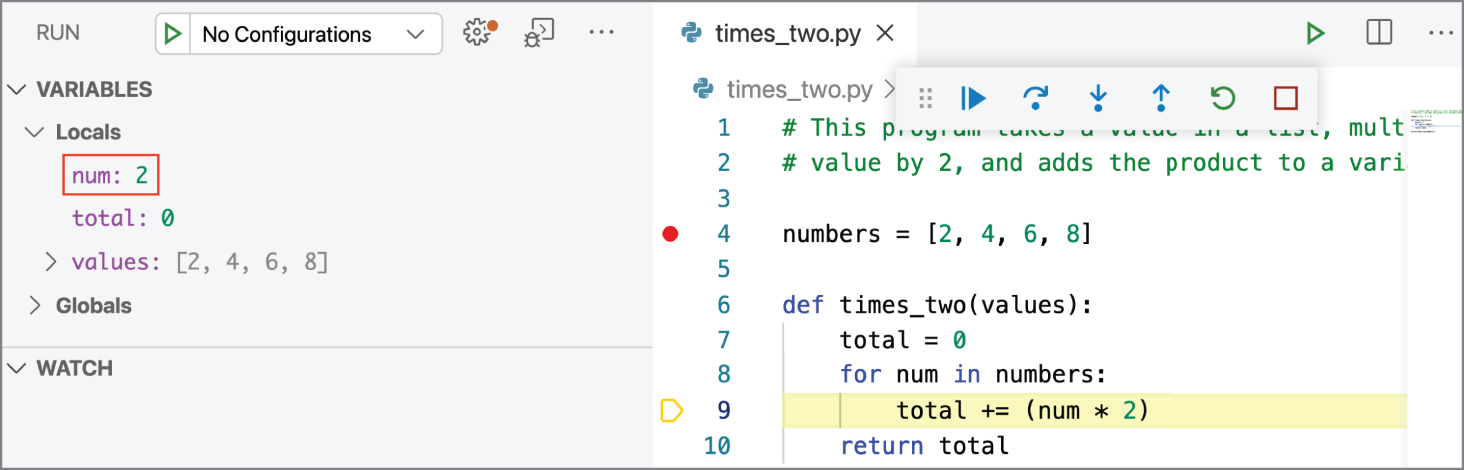
Figure 5.10: The num variable reflects which number in the numbers list is currently used in the iteration. Because 2 is the first item in the list, it's clear that the for loop is currently going through the first iteration.
When the debugger enters the function, values is set as it's a function parameter. Stepping over total = 0 initializes the variable. At this point, total appears in Locals within the Variables panel. For the first iteration, the first item within numbers (e.g., 2
) is evaluated in the for loop. Stepping over for num in numbers: initializes num to 2. Stepping over total + = (
num * 2) updates total to 4.
Iteration 2:
For the second iteration, the value for num is 4. The initial value for total is also 4 until the total +
= (num * 2) statement executes, at which point the value updates to 12.
Iteration 3:
For the third iteration, the value for num is 6. The initial value for total is 12 until the total += (num * 2) statement executes, at which point the value updates to 24.
Iteration 4:
For the fourth iteration, the value for num is 8. The initial value for total is 24 until the total += (num * 2) statement executes, at which point the value updates to 40.
Step Out
If you find yourself at a point where you want to exit from within a function to the scope that called it, you could do so with the Step Out command (see Figure 5.9, D). For example, selecting Step Out during the iterations for times_two() would return the debugger to the module, thus executing the remainder of the program.
Stop
During a debug session, you can stop all execution with the Stop command (see Figure 5.9, F). Stopping a session stops the debugger without finishing the program. Suppose during a debug session you find the error(s) within the program and come to the conclusion that if you were to continue, there may be side effects that impact the program, such as overwriting the wrong file. In such a scenario, select the Stop command to quit the debugger.
Restart
As you debug and correct errors in your program, you often don't want to continue running a program in its present (and often erroneous) state. You instead want to stop execution and restart the debugging session. The Restart command (see Figure 5.9, E), which conveniently stops the debugger, saves the current file and then restarts the debugger with your recent changes. Example scenarios include passing new arguments into a function call or wanting to set a breakpoint at a point in which the code has already ran past. In either scenario, make the change and then click the Restart command.
Call Stack
The module and its function calls are referred to as frames. Frames stack on top of one another, and as the function returns, its respective frame is cleared from the stack. In reference to the times_two.py program, the module frame is at the bottom of the stack, whereas the times_two() function frame is at the top of the stack. If the times_two() function made a function call, the function that is called would be at the top of the stack. The stack of calls itself is referred to as a call stack.
The Call Stack panel within the Debug view shows the whole chain of function calls leading up to the current point of execution (see Figure 5.11). The Call Stack panel lists the file that is being debugged and the line within the file that is being run. The call stack is especially useful if calls go through other files in your project because the call stack keeps track of where you are in the chain.
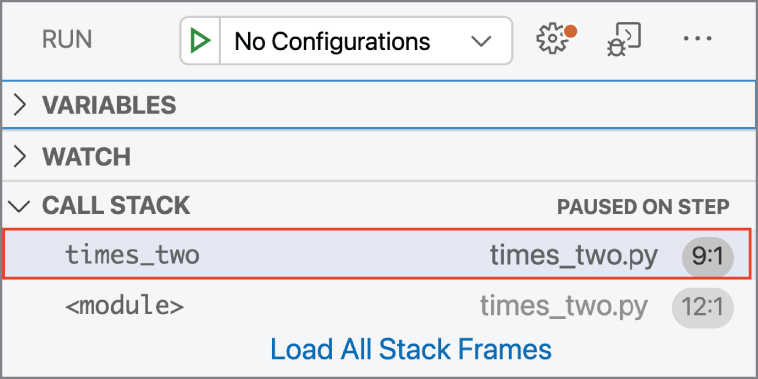
Figure 5.11: The Call Stack panel lists two frames, times_two and module. The current frame being evaluated is the times_two frame.
Furthermore, if you are at a breakpoint, you can select a frame in the call stack, and the Variables panel shows the state of the program at that breakpoint in the stack. This is useful for locating the origin of an incorrect value by tracing it back up through the stack and all the code that went into generating the value.
Try It Out: Run the debugger. When the debugger pauses at the breakpoint, take note of the Call Stack panel. Given the debugger's current position, the module frame is the only frame in the list (see Figure 5.12).
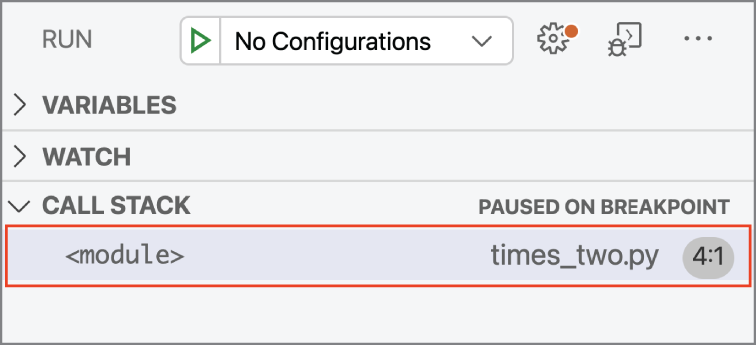
Figure 5.12: Only the module frame appears in the Call Stack panel.
Step over each line of code until you reach the times_two() function call. Step into the function and take note of the call stack. The times_two() frame is now added to the call stack (see Figure 5.13).
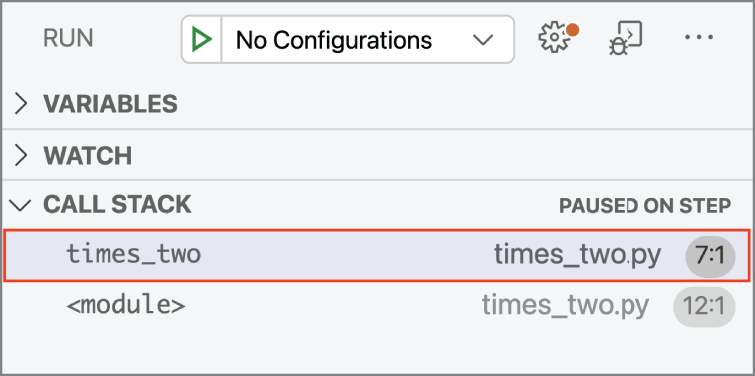
Figure 5.13: The times_two() frame has been added to the Call Stack panel.
After the debugger completes the function call and returns total, the times_two() frame is cleared from the Call Stack panel.
Triggering a Breakpoint
A typical breakpoint stops program execution every time the debugger encounters that breakpoint. This behavior, however, can be inconvenient for code that's inside a loop or code that's called frequently in some other way. For this reason, you can configure a breakpoint to trigger when a specific condition is true (a conditional breakpoint) or when it's been hit a certain number of times.
Conditional breakpoints break when the expression you assign to the breakpoint evaluates to true. For example, if you were to debug data within a database, you could break when a particular record comes up.
A hit count enables the debugger to execute up until a specified number of occurrences. The Python extension supports hit counts that are integers preceded by the ==, >, >=, <, <=, and % operators. Referring to the database example, suppose you're aware of an error that occurs on the 1500th time through a process. Rather than step through each iteration until you reach the 1500th, set a hit count that breaks when == 1500.
Both conditional breakpoints and hit counts display as a red circle with two white lines in the middle (see Figure 5.14).
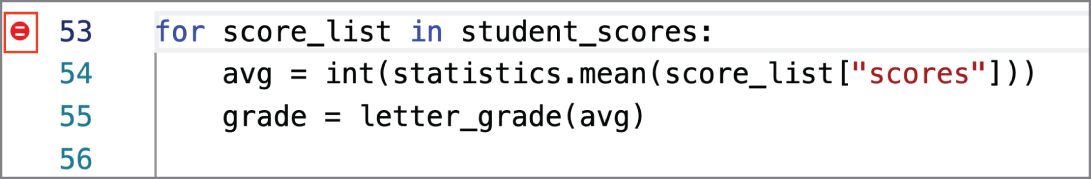
Figure 5.14: A conditional breakpoint displays in the editor margin as a red circle with two white lines in the middle.
To add a conditional breakpoint, right-click the editor margin for the respective line and click Add Conditional Breakpoint. In the drop-down menu that appears, click Expression (see Figure 5.15) . You could also use the same drop-down menu to add a hit count.
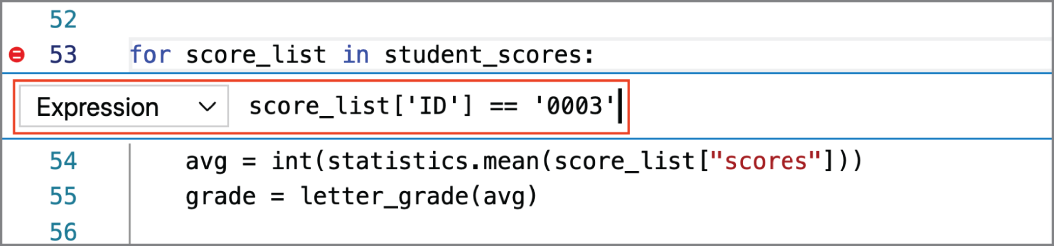
Figure 5.15: You can select a trigger from the list available. The current selection is Expression.
Try It Out: In the editor, open the students_grades.py file. The student_grades.py program contains sample code for processing data that's coming from a database of student grades. The program takes a list of grades for the student, calculates the average, and returns the average score and letter grade. Add a conditional breakpoint in the for loop that breaks if the student ID is 0003 (see Figure 5.16).
- Right-click the editor margin for the first line of the
forloop and click Add Conditional Breakpoint. - Click Expression in the drop-down.
- Enter the following expression and press Enter:
score_list['ID'] == '0003' - Run the debugger.
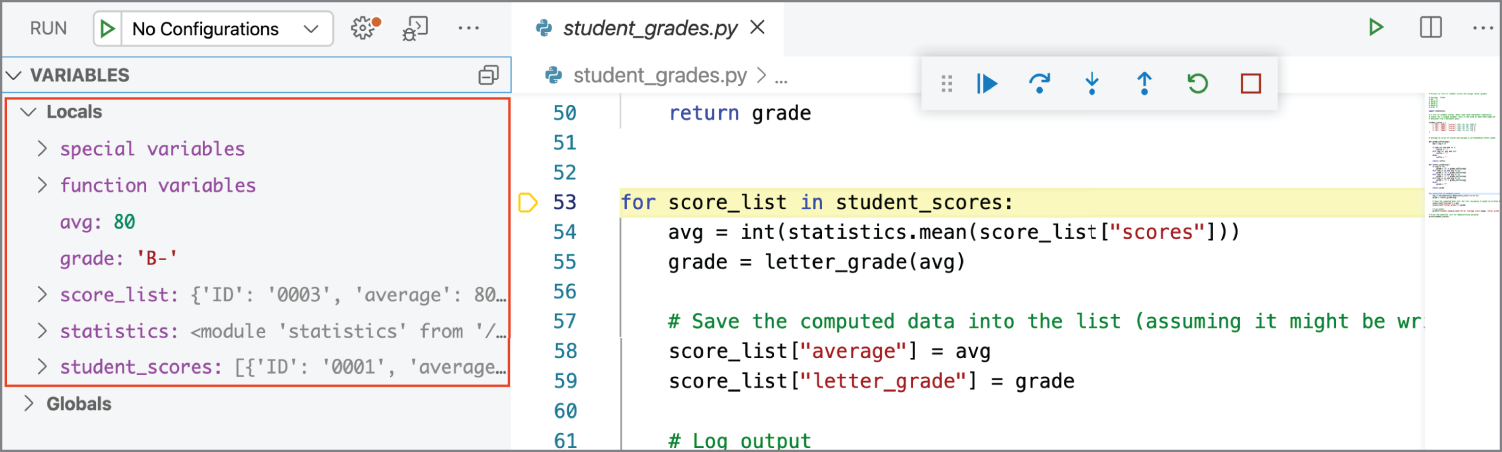
Figure 5.16: The debugger breaks when the student ID is 0003. The Variables panel reflects the local variables for student ID 0003.
Notice that the debugger breaks when the student ID is 0003. Within the Variables panel, the local variables reflect the iteration for student ID 0003.
Logpoints
While debugging, adding print statements to your code to output the current state results in unnecessary code. Furthermore, you have to remember to remove them all once you're done debugging. Rather than litter your code with extra print statements, use a logpoint instead. A logpoint outputs a message to the Debug Console without breaking the debugger. Logpoints appear as a diamond in the editor margin (see Figure 5.17).
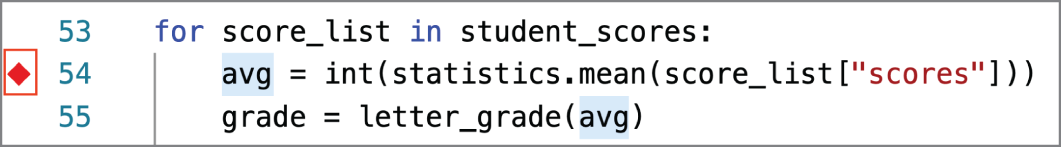
Figure 5.17: A logpoint displays as a diamond in the editor margin.
To add a logpoint, right-click the editor margin for the respective line and click Add Logpoint. Although log messages are plain text, you can include expressions to be evaluated within curly braces. Press Enter when you've finished writing the message.
Try It Out: In student_grades.py, log the student ID, list of Scores, and the mod intermediate variable in grade_suffix() for each iteration of the loop.
- To log the student
IDandScoresvalues, set the following logpoint on the line that defines theavgvariable:D: {score_list['ID']} Scores: {score_list['scores']} - To log the
modintermediate variable ingrade_suffix(), set the following logpoint on thereturnstatement of the function:Mod: {mod} - Run the debugger and open the Debug Console to view the logpoint messages (see Figure 5.18).
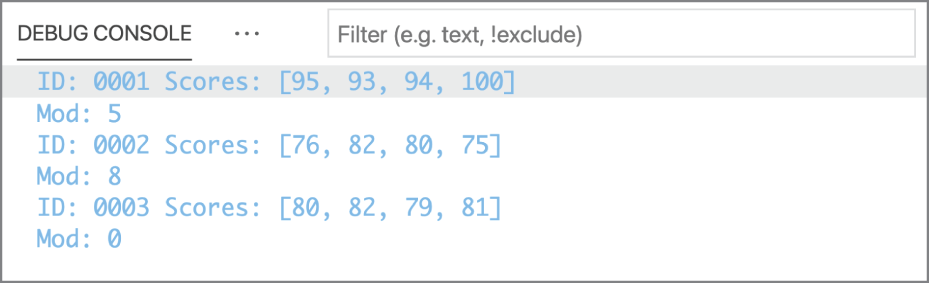
Figure 5.18: The logpoint messages display in the Debug Console with the student ID, scores, and the modulo for their score average.
Watch
When a program has a few variables, the Variables panel may be sufficient for keeping track of variable states. However, what happens when your program has dozens or even hundreds of variables? Keeping focus on how a single variable is impacted by everything that is executing becomes troublesome.
If there's a variable (or variables) you'd like to focus on without referring to the Variables panel, add the variable to the Watch panel (see Figure 5.19). The Watch panel tracks the state of selected variables while the debugger runs. The panel takes an expression as an input and updates the variable as each line of the code executes. To add a variable to the Watch panel, click Add Expression and enter the name of the variable. Alternately, you could highlight the variable in the editor, right-click, and click Add To Watch.
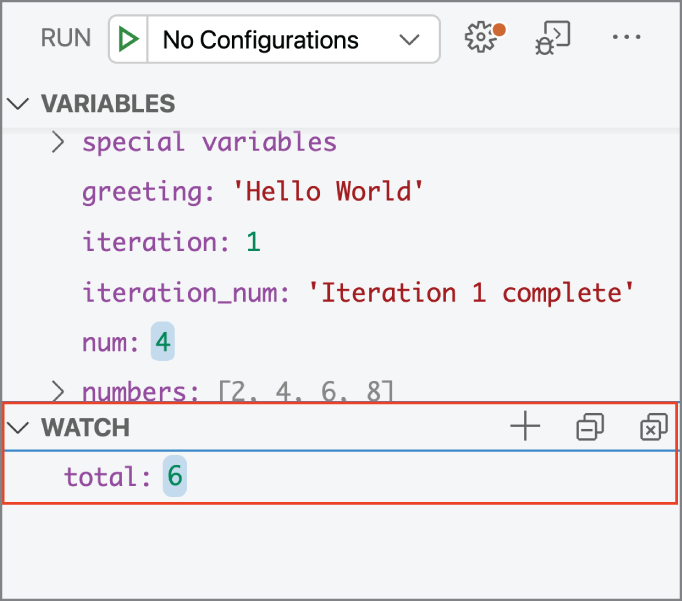
Figure 5.19: As the program executes, the total value is isolated in the Watch panel.
Try It Out: Open watch.py in the editor, set a breakpoint at greeting = '
Hello World', and start the debugger. After the debugger pauses at the breakpoint, add the variable total to the Watch panel.
Step over each line of the code and take note of how the variable assignment changes as the code executes (see Figure 5.20).
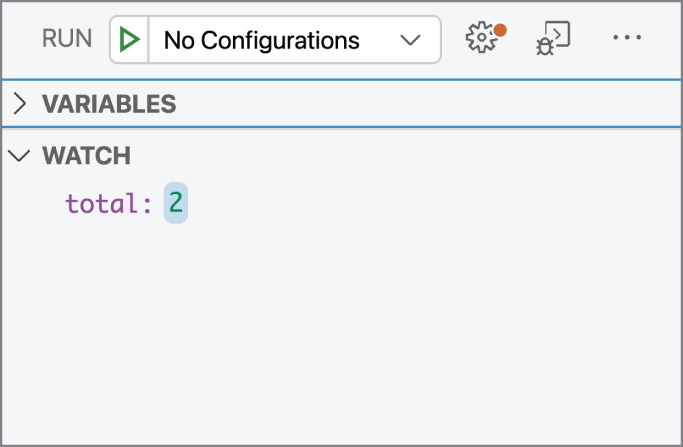
Figure 5.20: The Watch panel displays the variable total with value of 2.
There are six variables in watch.py: greeting, total, iteration, numbers, num, and iteration_num. As the debugger steps over each line of the program, the list grows to include each variable that executes. As the debugger steps over each line of code, you can better focus on the state of total by referring to the Watch panel.
The Debug Console
As you debug a program, you can try potential fixes for bugs within the Debug Console (see Figure 5.21) rather than modifying your code and restarting. The Debug Console enables you to try code in the context of the program's current state without stopping the debugger. You can try different scenarios within the Debug Console and copy your fix into the program while the debugger is paused.
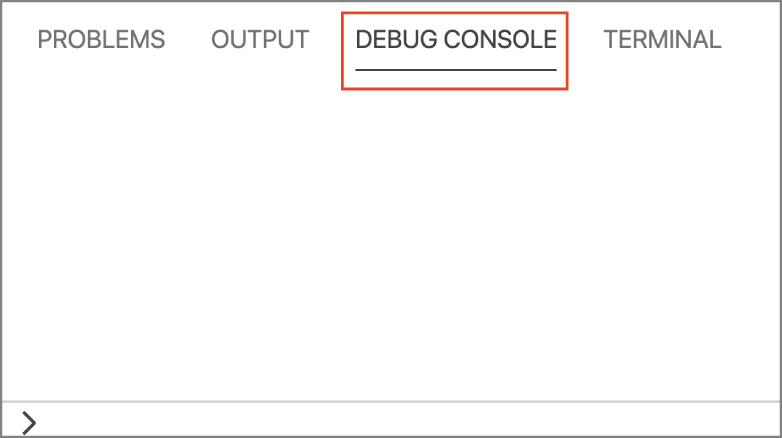
Figure 5.21: The Debug Console.
The Debug Console provides the Python Read-Eval-Print-Loop (REPL) in the editor. The Debug Console lets you access and modify all the program's variables, call functions, evaluate expressions, and otherwise run whatever code you like using the program's current state. Anything done in the console affects the program's current state. Furthermore, the Debug Console input supports syntax coloring, indentation, auto closing of quotes, and other language features of the mode for the active editor.
You can access the Debug Console in these three ways:
- Run view: Click the Debug Console icon (see Figure 5.22).
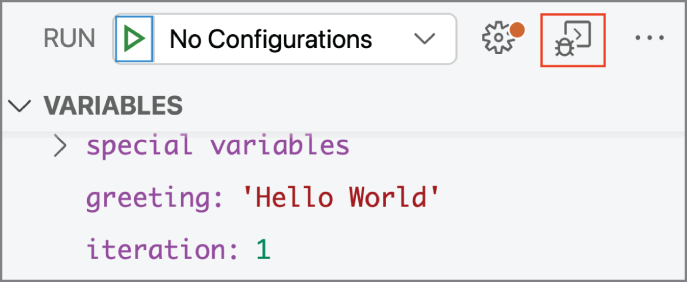
Figure 5.22: The Debug Console icon displays at the top of the Run view.
- Keyboard shortcut: Press Cmd/Ctrl+Shift+Y.
- Command Palette: Click View: Debug Console.
The Debug Console shows suggestions as you type. Once you press Enter, the expression is evaluated. To enter multiple lines, press Shift+Enter between the lines.
Within the Debug Console, you can call functions directly and evaluate the results. If you call a function that has breakpoints, you can step through the function code. Once you exit the function, you're still in the same program state as before. You can also alter variables and run code that's not in the program as well using the Debug Console.
Try It Out: In the editor, open the Fibonacci_generator.py file. The Fibonacci_generator.py file contains a program that generates a list of Fibonacci numbers. Fibonacci numbers form a sequence in which the next number in the sequence is the sum of the previous two numbers in the sequence (e.g., 1, 1, 2, 3, 5, 8, 13, 21). When the program starts, the user is prompted to input the total amount of numbers in which the program should generate. For the purpose of demonstrating the Debug Console, an intentional bug is added to the program. Follow these instructions to use the Debug Console to fix the bug:
- Run the program in the terminal, and when prompted, enter 1 as the number of Fibonacci numbers to generate. The program runs successfully and returns [1].
- Run the program again in the terminal, and when prompted, enter 2 as the number of Fibonacci numbers to generate. The program runs successfully and returns [1, 2].
- Run the program once more in the terminal, and when prompted, enter 3 as the number of Fibonacci numbers to generate. This time when the program runs, it stalls. On your keyboard, press Ctrl+C to quit the program. After the quitting the program, an error appears in the terminal:
^CTraceback (most recent call last):File "/Users/aspeight/Desktop/debugging/car.py", line 18, in <module>print(gen_fib())File "/Users/aspeight/Desktop/debugging/car.py", line 14, in gen_fibi == 1KeyboardInterruptIt would appear that there's a problem with
i== 1in theelifstatement for whencount > 2. You can assume that this is where the bug is in the program. - Set a breakpoint at
i== 1 and start the debugger. When prompted, enter 3. - After the debugger pauses at the breakpoint, look at the Variables panel to confirm whether the variables reflect the appropriate values (see Figure 5.23).
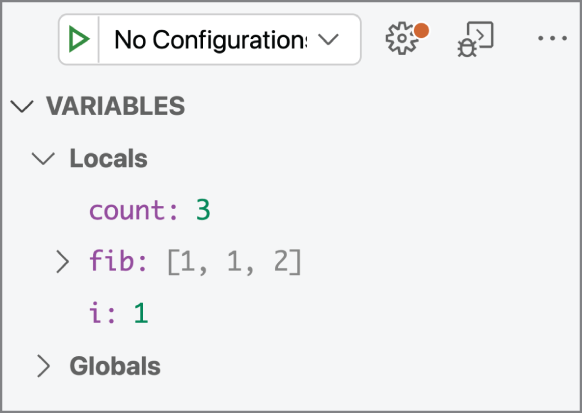
Figure 5.23: The Variables panel reflects the current variables for the first three numbers in the Fibonacci sequence. The current value for
countandiare displayed as well. All variable values are correct. - Step over the final line in the
whileloop and notice that the loop starts another iteration despite that the requested number of Fibonacci numbers has already been generated. As you continue to step over thewhileloop, the program generates the same Fibonacci number, and thewhileloop never breaks (see Figure 5.24). The program has an infinite loop.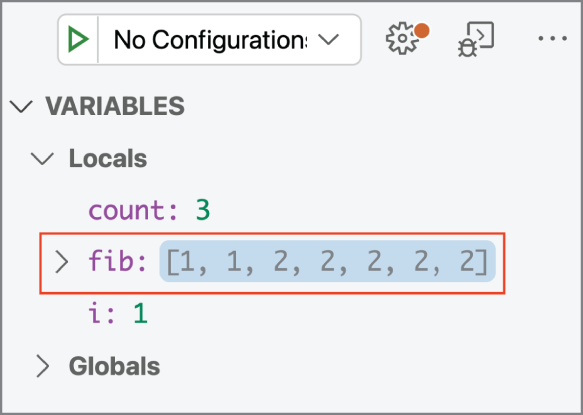
Figure 5.24: The
fibvariable has a repeating2in the Fibonacci sequence.The
whileloop should break once the value assigned toiis less thancount – 1. As the code is written, the value foriis never less thancount – 1sinceinever increments. You can try a fix in the Debug Console. - Start the debugger and open the Debug Console.
- After the debugger stops at the breakpoint, enter
i += 1to increment the value fori. - In the Variables panel, the value for
ichanges from1to2. Now, when you continue the debugger, the remainder of the code executes and only three Fibonacci numbers are generated. - In the program, change
i == 1toi+= 1and verify that the program works as expected.
Launch Configurations
When it comes to debugging, there's no one-size-fits-all method with regard to debugging modes. It may be necessary to sometimes debug a program with different initial conditions, in a different folder, with different command-line arguments, and so on. The launch configurations let you configure how different debug sessions will run and saves those configurations persistently in the launch.json file. The launch.json file is stored in a .vscode folder in the project root folder and can also be accessed in the user or workspace settings. To debug, at least one configuration is required in launch.json.
To create a launch.json file, in the Run view click Create A launch.json File. Alternatively, you could create a launch.json file from the Run menu by selecting Run ➪ Open Configurations.
Visual Studio Code opens the configuration menu from the Command Palette, which prompts you to choose a default configuration as the starter template for the new configuration (see Figure 5.25).
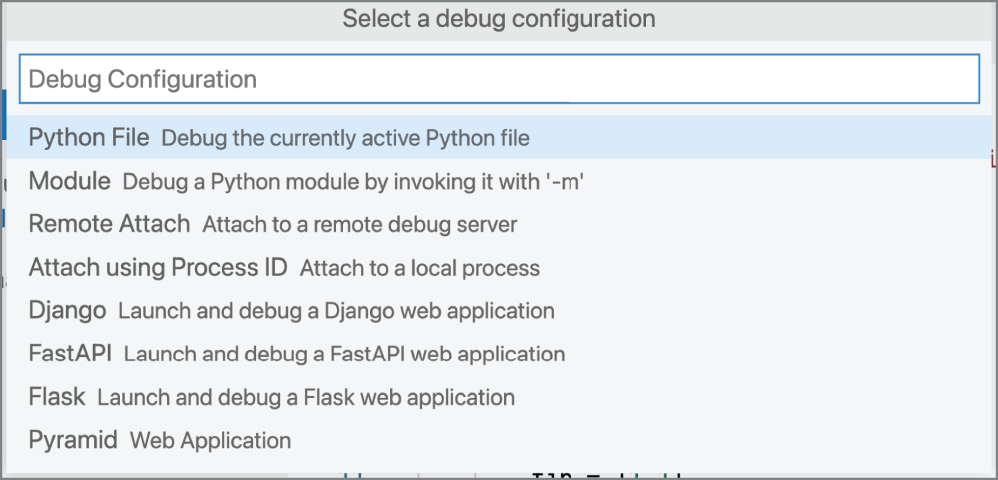
Figure 5.25: A list of debug configurations appears when you create a new launch.json file.
The Python extension provides the following default configurations:
- Python file—Debug the currently active Python file.
- Module—Debug a Python module by invoking it with
-m. - Remote Attach—Provide a host name and port number for the debug server to listen on.
- Attach using Process ID—Attach the debugger to a Python process while running a Python script launched outside Visual Studio Code that's not in debug mode. The process ID is needed to attach to the process.
The extension also provides three default configurations for web apps:
- Django
- Flask
- Pyramid
For more information on the debugging a Django application, refer to the Django tutorial at code.visualstudio.com/docs/python/tutorial-django#_explore-the-debugger. To learn more about debugging a Flask application, refer to the Flask tutorial at code.visualstudio.com/docs/python/tutorial-flask#_run-the-app-in-the-debugger.
After the starter template is selected, the launch.json file is added to the .vscode folder and is opened in the editor (see Figure 5.26).
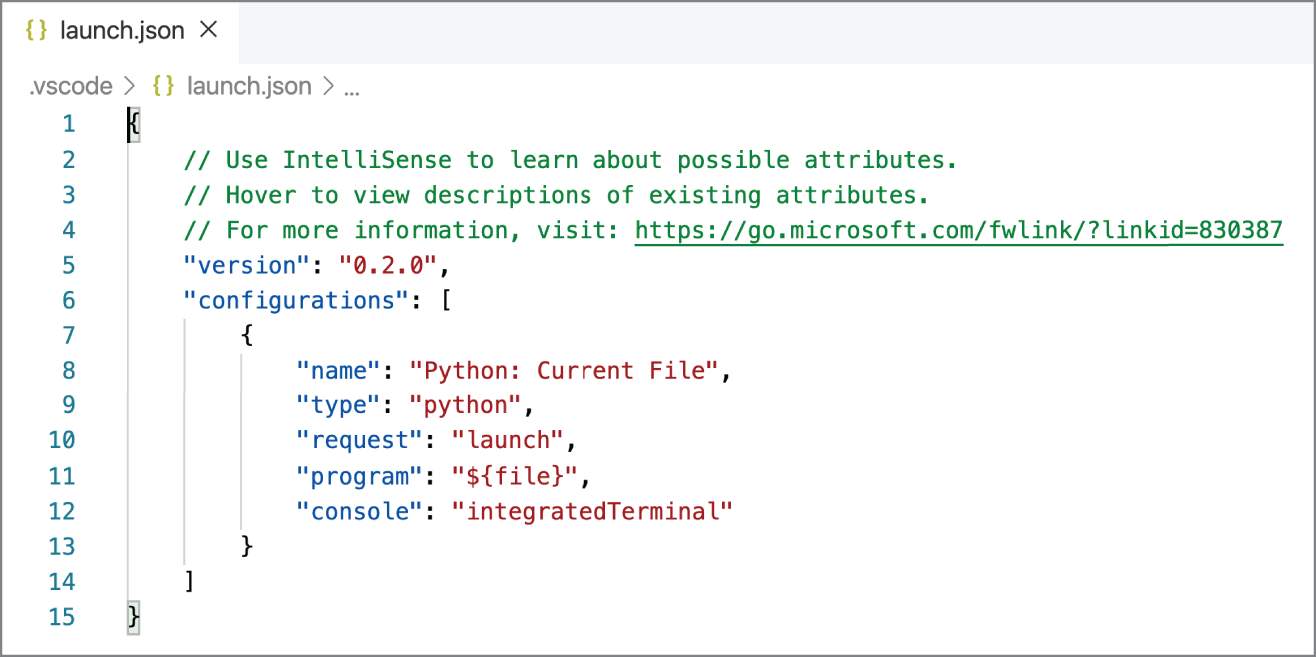
Figure 5.26: The launch.json file uses the Python configuration for the new launch.json file. The launch.json file is also saved to the .vscode folder of the project.
When editing the launch.json file, IntelliSense suggests (Ctrl+spacebar) a list of available attributes. You could also use hover help for all attributes within the file. Because attributes may differ across languages, use hover help to learn more about the attribute.
The launch.json file can contain any number of configurations. To add a configuration, click Add Configuration from either the Run menu or within the launch.json editor (see Figure 5.27).
Figure 5.27: The Add Configuration button displays at the bottom of the launch.json editor. Click the button to add a configuration.
The core settings available for the launch.json file are provided here:
name—Provides the name for the debug configuration that appears in the Visual Studio Code drop-down list.type—Identifies the type of debugger to use; leave this set topythonfor Python code.request—Specifies the mode in which to start debugging:launch: Starts the debugger on the file specified in the program.attach: Attaches the debugger to an already running process on a remote server that you cannot restart at will. You need the same source code file locally that is specified in the program.
program—Provides the fully qualified path to the Python program's entry module (startup file). The value${file}, often used in default configurations, uses the currently active file in the editor. By specifying the startup file, you can always be sure of launching your program with the same entry point regardless of which files are open.python—Full path that points to the Python interpreter to be used for debugging. If not specified, this setting defaults to the interpreter identified in thepython.pythonPathsetting, which is equivalent to using the value${config:python.pythonPath}. To use a different interpreter, specify its path instead in thepythonproperty of a debug configuration.args—Specifies arguments to pass to the program. Each element of the argument string that's separated by a space should be contained within quotes.cwd—Specifies the current working directory for the debugger, which is the base folder for any relative paths used in code. If omitted, the current working directory defaults to${workspaceFolder}, which is the folder open in the editor.
Alternatively, you can use a custom environment variable that's defined on each platform to contain the full path to the Python interpreter to use so that no additional folder paths are needed.
Additional configurations are available at code.visualstudio.com/docs/python/debugging#_set-configuration-options. There are also additional attributes available that are not specific to Python, which can be set in
launch.json. To learn more, refer to code.visualstudio.com/docs/editor/debugging#_launchjson-attributes.
Summary
In this chapter, you've learned how to do the following:
- To access the Run view, either click the Run icon in the Activity Bar or use the keyboard shortcut Cmd+Shift+D/Ctrl+Shift+D.
- A debug configuration must be selected to start a debug session.
- The Run menu provides the most common debugging commands. Additional commands are accessible in the Run view or Command Palette.
- The Debug toolbar provides quick access to the following commands for debugging: Continue, Step Over, Step Into, Step Out, Restart, and Stop.
- The Variables panel updates as variables are defined, and its values are assigned when the program runs.
- Variables can be watched in the Watch panel to provide better focus on a variable while the program runs.
- Setting a breakpoint causes the debugger to pause and highlights the next line of code to be executed.
- The Call Stack panel shows the whole chain of function calls, referred to as frames, leading up to the current point of execution. Selecting a frame goes to another point in the stack and enables you to examine the variables at that scope.
- The Debug Console enables you to try code in the context of the program's current state without stopping the debugger.
- Expressions can be entered and evaluated in the Debug Console during a debug session.
- Breakpoints can be set to trigger based on a condition. The editor supports expression conditions, hit counts, and logpoints.
- Custom debug configurations are created in a
launch.jsonfile. Once a debug configuration is created and saved, you can reuse it in future debug sessions.
At this stage, you are able to debug Python programs with the Visual Studio Code debugger.