CHAPTER 4
If You Don’t Know Where You’re Going, Any Investment Will Get You There
Overheard during an investor education seminar for high‐net‐worth investors:
“I have no idea where to begin and I find all this financial stuff pretty much drudgery. To be honest. I want my money safe and secure. Why isn’t that enough to tell my advisor?”
The previous chapter gave you insights into the purpose of your wealth and who you are as an investor. Now that you have your sneakers on, it’s time to begin the hike. But you need to be on the right path for you. Happily, it’s not all uphill. In fact, this first exercise is pretty simple.
Inflation, returns, and fees
Returns: Wouldn’t it be nice if . . .
 What would be a realistic return on your portfolio each year? 10 percent? 8 percent? If you don’t know the answer or don’t want to guess, try looking at different five‐ or ten‐year periods1 or even the ten‐year period ending 2016 for the stock market. That’s between 7 percent and 8 percent.
Minus inflation
 What do you think inflation will be, on average, over the next three to five years? 2 percent? 5 percent? Glance at the history of inflation to make your best guess. For example, your $1 purchase in 1913 would cost you $24.61 in 2016. Or think about the opposite (deflation), when that same $1 purchase in 1929 would cost just 81 cents in 1939. The worst decade for inflation was the 1970s, when it averaged over 10 percent each year. More recently, inflation hovered around 2 percent in the 2000s—just as it did in the 1950s.2
Now subtract fees
 What will the total fees be on your portfolio? One percent? Or just half of 1 percent, which is 50 basis points? To figure out that answer, decide first what you are willing to pay for advice. Note the average registered investment advisor charges vary widely based on your assets,3 and fees may or may not include outside funds’ management fees.
And more fees
What are you willing to pay for investments/mutual funds? Note that the average equity mutual fund costs 78 basis points,4 but those fees can be as low as 3 basis points for an index fund.5
Returns − inflation − fees = less than you’d like
 Now add your number for inflation in #2 above and your number for fees in #3. Most of the time you will have a number like 4 percent to 5 percent. You must then subtract that number from the desired return you had for #1. And then there are taxes.
Example: Inflation guess = 3%, fees total 1%, both then subtracted from 7% = 3%; 3% is your total return after inflation and after fees. That 3% is often called net return or the real return (as opposed to the nominal or gross return). Guess which returns are in the advertisements meant to sell you on an investment? Gross, not surprisingly.
Does the number you come out with depress you? Well, it might, especially if you pay 20 percent or more in taxes on the entire 7 percent return—taking another +1 percent off the top.
Do the math—not you, your advisor!
Advisors should do this simple exercise with you before you become a client. Then you can try on for size their assumptions versus yours. For example, is the advisor forecasting 5 percent inflation? What is the advisor’s expected real return for your portfolio? Looking at the returns for your portfolio without measuring the risk is like buying a house without knowing what neighborhood it’s in. Imagine if the first year or two includes a market crash. If your portfolio falls by 20 percent, for instance, you need a +25 percent return just to get back to even. The first few years matter a great deal, and losses early on can hurt.
Make sure when your advisor does this math with you, that you both are subtracting inflation, spending, taxes, and all fees.6 Doing the math will prepare you for what is subtracted from those heady returns you read about in the ads. If an advisor is not eager to do the math, find one who is.
On the hiking trail again
Back on the trail of figuring out your investment outcome, you need to assess risk. You would not knowingly go on a hike that included scaling a cliff if it was well beyond your ability, would you? Nor should you be part of an investment that can send you careening off a cliff. Taking into consideration how much risk you feel you can handle according to the “investor personality” you worked out in Chapter 3, talk to your advisor about exactly what hiking level you can handle in your sneakers—not someone else’s!
To quote Peter Bernstein again on the topic of risk: “The beginning of wisdom in life is in accepting the inevitability of being wrong on occasion.”7 It is the advisor’s job to help you understand risk. Too many investors embrace a far too narrow definition of risk. Some even see risk narrowly as volatility (also known as standard deviation), or just the failure to have your money when you need it. Both of these definitions of risk are too simplistic for the smart CEO of My Wealth, Inc.
Playing chess on four boards at once
Not to depress you as the newly appointed CEO, but you also face other complications that you wouldn’t with a pension or an endowment fund. As a private investor, you face a multidimensional challenge. For you, a move on one chess board has an impact on the other three. The moves (i.e., the decisions you make) on each board are connected to and impact the subsequent moves on another. This is an interdependent relationship you may not relish, but still need to accept.

The four risks that can send you off a cliff
You need to first address the four components of risk.8
- Risk tolerance is a personality characteristic; it is neither good nor bad, it just is. Your personality is not going to change dramatically, and neither is your risk tolerance. Many advisors give you a quick quiz to determine your risk tolerance. If they don’t, they should spend time discussing your past investments and your behavior during market crashes (and boom times, too) until they gain a true understanding of your risk tolerance. Did you sell everything in March 2009 at the bottom of the market? Did you load up on Internet stocks in 1999 just in time to see them crater? Did you swear never to buy stocks again?
- Risk capacity is a financial consideration your advisor helps you to assess. In other words, what risk—given future earning power, age, family circumstances, and health—can you afford to take? Your future earnings, potential inheritance, age, family circumstances, and health will all factor into that analysis.
- Perceived risk is how you view various situations. How anxious will you be in different scenarios? Will you panic or become frightened in market turmoil? If your stress level is too high (think 2008 and early 2009), both of you will be unhappy during the inevitable market downturns.
- Required risk is the financial projection using standard deviation and all those fancy terms you may not wish to learn about. And you don’t really have to learn them anymore. Think about getting into your car. You don’t open up the hood; you simply look at the dashboard. Then you can make the right decision about driving based on your fuel level, engine temperature, and so on—all of which are displayed on your dashboard.
Test drive first
Similarly, your advisor can show the results of more complicated projections without your having to look under the hood. Called a Monte Carlo simulation, this simple visual reveals many different scenarios that could happen. Using this exercise, the advisor shows you how to reach the investment outcome you seek and then gauges your reaction.
A Monte Carlo simulation allows an advisor to input complex data into a software model that relies on financial math in order to show you a variety of outcomes. You see what could happen in either good times or bad times. This financial modeling permits you and the advisor to consider the possibility of either scenario happening, and even assigns a probability to each possible outcome. Imagine investing at the lowest point in the market, March 2009, and seeing over 100 percent returns through 2013. Or imagine the opposite. You start investing in 1999, just in time to see your portfolio cut in half during the Internet bust of 2000. By the way, losing 50 percent means that just to get back to even, your portfolio needs to go up 100 percent.
Now let’s say you and your advisor agree, after considering many different outcomes, that a 7 percent expected return with a certain asset allocation is what you would like to examine. The model performs a million (or more!) different possible market returns for each asset you selected and combines them all into a visual. Your 7 percent return even shows a projected probability of success. Here is one such chart showing the worst outcome as well as the best. Note that your 7 percent is the mean because it was your expected target return. The target level of risk was 10 percent standard deviation. Look at the range of possibilities. Quite a spread, isn’t it? But remember: This chart is just one of four ways to measure future risk. You are now armed with a target return and a target risk level. You might wish to change one of those targets as you become more comfortable. Many advisors use this modeling to help in better defining your optimum investment outcome.

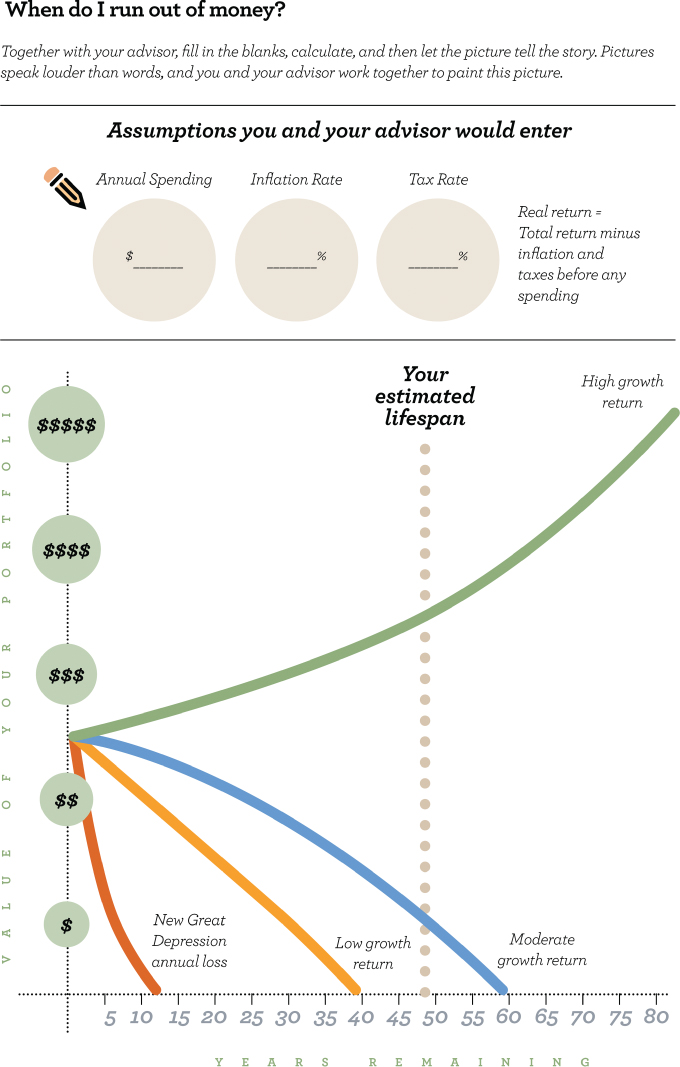
When do I run out of money?
Another tool you might wish to employ is a chart that shows when you will exhaust your wealth. Like the Monte Carlo simulation, you can try on different assumptions of how much you might spend, how high inflation might climb, and so on. Your reward for experimenting with different possible outcomes is imagining how you might feel or what you might need to adjust—like your spending rate. One investor told me this chart9 illustrated better than any other how time, risk, returns, spending, and taxes each had a huge influence on the overall outcome.