Chapter 12. Monitor Performance and Troubleshoot
IN THIS CHAPTER
• Monitor Performance in Windows Server 2008
• Troubleshoot Windows Server 2008
• Use the Problem Reports and Solutions
• Monitor Performance and Troubleshoot in Windows Server 2008 R2
Monitor Performance in Windows Server 2008
Solution: Windows Server 2008 comes with several tools for monitoring performance and reliability. In fact, the main tool for accomplishing this task is the Reliability and Performance tool. This tool provides an overview of the server’s performance, using performance counters, configuration information, and event trace data. This information can be turned into data collector sets to monitor specific aspects of performance. Finally, reliability reports create a visual representation of what is happening on the server.
We will look at each segment of the Reliability and Performance tool, beginning with the Resource Overview section, which provides information on server resources in real time. To start using the Reliability and Performance tool, perform the following steps:
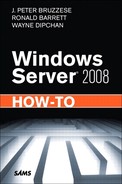
1. In Server Manager, select Diagnostics, expand the console tree, and highlight Reliability and Performance Monitor. Immediately you get four graphs and four monitoring sections (see Figure 12.1). The four sections you can monitor in this view are CPU, Disk, Network, and Memory. Under the graphs are four sections that provide more information on how these four resources are being used on this server.
Figure 12.1 The Resource Overview section in the Reliability and Performance tool.
2. Expand each resource to get details on how the active processes are using these server resources:
• CPU: Shows the percentage of CPU usage. Expanding this resource shows Image (process), PID, Description, Threads, CPU Percentage, and Average CPU Percentage.
• Disk: Shows the disk activity, in kilobytes per second. Expanding this resource shows Image (process), PID, File Location, Read (B/min), Write (B/min), I/O Priority, and Response Time.
• Network: Measures network throughput and percentage of utilization. Expanding this resource shows Image (process), PID, IP address (or DNS Name), Send (B/min), Receive (B/min), and Total (B/min).
• Memory: Monitors memory faults and the percentage of physical memory in use. Expanding this resource shows Image (process), PID, Hard Faults, Commit (KB), Working Set (KB), Sharable (KB), and Private (KB) memory.
The Resource Overview section is a great place to get an immediate picture of what is going on with the server resources. You can easily see a sharp spike in any of the resources and then deal with it immediately. Sometimes the performance issues are not caused by a complete drain on resources. In such a case, you need to use more in-depth tools, as described in the following sections.
Use the Performance Monitor and the Reliability Monitor
Under the Reliability and Performance tool is a console tree called Monitoring Tools. When you expand this tree, you see two separate monitors: one for reliability and one for performance. Let’s look at how to utilize each one to monitor a server’s performance data.
Performance Monitor
Performance Monitor is a simple yet powerful tool for monitoring a server. It provides a visual method for checking performance in real time or from log files. Here’s how you use it:
1. In the Monitoring Tools, highlight Performance Monitor. You see a few icons in the Monitoring window.
2. To add counters before so you can get the information you need, click the plus sign (or press Ctrl+I), and the Add Counters window appears.
Note
The counters that are available for Performance Monitor vary, depending on which roles and features were added to this server. Standard counters (for example, processor, paging file) exist for all servers.
3. To add counters to this server, first choose the local machine or server name.
4. Choose what you want to monitor. In this case, add counters for the processor, so scroll to the processor and click the plus sign to the right to expand the available counters.
5. Highlight the counter(s) you want to monitor and click Add.
Note
By holding down the Ctrl key and selecting counters, you can add more than one counter at a time. You can check the Show Description to provide a pane on the bottom of the Add Counters box that includes descriptions of what the counter will monitor.
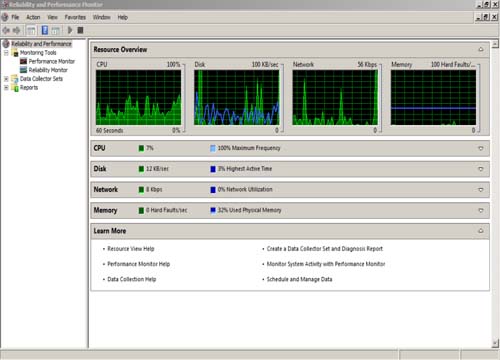
6. When you have added all the counters you want to monitor, click OK. Figure 12.2 shows the Performance Monitor with added counters.
Figure 12.2 A view of the Performance Monitor with active counters.
Above the graph are some options (represented by icons) that you can set to customize the Performance Monitor:
• View Current Activity: This is the active graph. There is nothing to set here.
• View Log Data: Allows you to view the source of the data being monitored—from the current activity, log files, or a database.
• Change Graph Type: Allows you to change the graph type. The choices are Line, Histogram, and Report.
• Add: Allows you to add counters to the Performance Monitor.
• Delete: Allows you to remove counters from the Performance Monitor.
• Highlight: Allows you to highlight a selected counter.
• Copy: Shows all selected counters in the Performance Monitor.
• Paste: Shows all selected counters in the Performance Monitor.
• Properties: Contains five tabs:
• General: In this tab, you can set the display elements, report and histogram data, and graph elements.
• Source: In this tab, you can set the data source for the Performance Monitor. The choices are Current Activity, Log Files, and Database. This is the same setting as View Log Data.
• Data: Here you can add counters and change the color, scale width, and style of the graph data.
• Graph: You can change the graph type here. This tab also lets you set the scroll style, title, vertical axis, items to show (vertical and horizontal grid), and vertical scale.
• Appearance: This tab allows you to set the color, font, and border for the Performance Monitor.
• Zoom: Allows you to zoom into a section of the Performance Monitor.
• Freeze/Unfreeze Display: Stops the current counters and freezes the display with the currently collected data.
• Update Data: Allows you to update performance data after unfreezing a display.
Note
We will talk later about creating data collector sets. For now, know that if you highlight the Performance Monitor and right-click, you see the option to create a new data collector from the performance counter you have chosen.
Reliability Monitor
Reliability Monitor provides information about system stability and contains detailed information about events that affect server reliability. Reliability Monitor has a system stability chart and calculates a system stability index over the life of the system. To view the events in the Reliability Monitor, perform the following steps:
1. In Server Manager, expand the Diagnostics console tree and then expand Reliability and Performance and Monitoring Tools. Highlight Reliability Monitor.
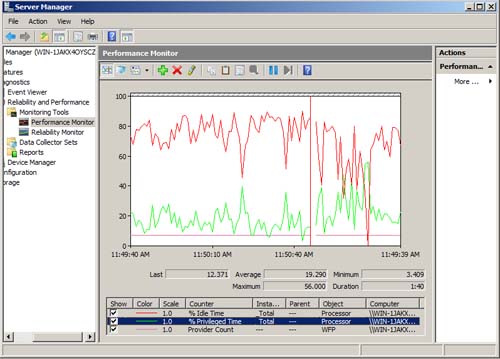
2. In the top half of the Reliability Monitor, you see the system stability chart (see Figure 12.3). If you highlight a particular date on the chart, you get a stability index. You can view all dates or select a date from the drop-down box in the top-right corner.
Figure 12.3 System stability chart with the system index within the Reliability Monitor.
Directly below the chart are informational and error alerts, which signal that an event took place within one of the five corresponding events. The system stability reports provide detailed information.
3. In the bottom half of the Reliability Monitor, notice the System Stability Report section. The reports shown here are created based on five particular events:
Note
System Clock Changes is not part of the five events, but this alert shows up whenever there is a change to the server time.
• Software (Un)Installs: When software is installed, uninstalled, or updated, the event is logged here and includes details for the event, such as software, version, activity, activity status, and date.
• Application Failures: When there is an application failure, the event is logged here. It includes details for the event, such as application, version, failure type, and date.
• Hardware Failures: When there is a hardware failure, the event is logged here. It includes details for the event, such as component type, device, failure type, and date.
• Windows Failures: When there is a Windows failure, the event is logged here. It includes details for the event, such as failure type, version, failure detail, and date.
• Miscellaneous Failures: When there is a miscellaneous failure, the event is logged here. It includes details for the event, such as failure type, version, failure detail, and date.
The information provided here is alert-type information, and there is nothing to configure. This information allows you to see how stabile your server is, based on how many events take place and the stability index. For instance, a server that is newly built and has all updates performed has a stability index rating of 10. As failures occur, that rating drops. An acute drop in this index indicates that there are serious failures that need to be addressed. The stability reports provide a means of finding the items that need to be addressed.
Create a Data Collector Set
Data collector sets are used as a foundation for the Reliability and Performance tool. They organize multiple data collections into a single element that is used for reviewing and logging the performance of a system. There are four types of data collector sets: User-Defined, System, Event Trace Sessions, and Startup Event Trace Sessions.
To create new data collector sets, perform the following steps:
1. Highlight the type of data collector set and right-click or choose New, Data Collection Set. The Create New Data Collector Set Wizard appears.
2. Name the data collector set and choose whether to create it from a template (recommended) or to create it manually (for advanced users). Click Next.
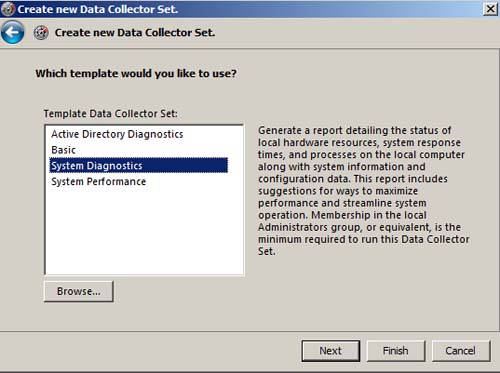
3. Choose the template to use, from the following options (see Figure 12.4):
• Active Directory Diagnostics: Used for Active Directory–related data on the local system.
• Basic: Used for creating basic data collector sets. To use this, you must be a member for the Local Administrators group.
• System Diagnostics: Generates a report detailing the status of hardware resources, system response times, and processes on the local system. The report includes suggestions for streamlining operations and maximizing performance using 35 different data collectors.
• System Performance: Similar to Systems Diagnostics set, this set also generates a report detailing the status of hardware resources, system response times, and processes on the local system. The report can be used to identify possible performance issues. This set uses only 2 data collectors.
Click Next.
Figure 12.4 Choosing a template for a data collector set.
4. Choose the directory where you want to save this report and click Next.
5. In this last screen, choose the account under which to run this data collector set, open Properties, start the data collector set or save and close the data collector set, and click Finish.
After a data collector set is created, you have to add data collectors. To add new data collectors, perform the following steps:
1. Highlight the data collector set you created and select Action, New Data Collector.
2. When the Create New Data Collector Set Wizard starts, choose the type of data collector from the following:
• Performance counter data collector
• Event trace data collector
• Configuration data collector
• Performance counter alert
Click Next.
3. Click Add and choose the performance counter(s) you want to monitor in this collector. Click OK and click Next.
4. Finalize the creation of the data collector. Checking the box opens the properties page, where you can add additional counters and set the log type, time interval, log file name, and format. Click Finish.
Configure Data Collector Sets
When you have finished creating a data collector set, you can perform a number of tasks on it. Let’s look at some of the tasks involved in configuring data collector sets. From the Action menu you can select the following:
• Start: Causes the data collector set to begin gathering event information for this server.
• Stop: Causes the data collector set to stop gathering event information for this server.
• Save Template: Saves this data collector set as a template. This is useful for copying data collector sets to other servers.
• Data Manager: Sets the data properties for a data collector set. There are three tabs for configuration:
• Data Manager: Sets the following: Minimum Free Disk, Maximum Folders, Resource Policy (Delete Oldest, Delete Largest), Maximum Root Path Size, Report File Name, and Event File Name.
• Actions: Sets the following: View, Add, Edit, or Remove folder actions. In this tab, you can choose a condition (either age, folder size, or both). And you can choose an action for that folder (copy CAB file to directory, create CAB file, delete data files, delete CAB files, delete report).
• Rules: In this tab, you can import or export rule template files for the data collector set.
• Latest Report: Allows you to view the latest report for this data collector set. We discuss reports later in this chapter.
• Properties: Contains six tabs.
• General: In this tab, you can see the name, edit the description, add or remove keywords, and change the Run As account.
• Directory: In this tab, you can view or change the root directory, set a subdirectory, choose from 26 different subdirectory name formats, prefix the subdirectory with the computer name, and choose the serial number.
• Security: This tab provides an overview of groups and users, with permissions to this data collector set, and allows you to add/remove/adjust those permissions.
• Schedule: In this tab, you can create a schedule for running the data collector set. You can set the active range (beginning and expiration dates) and choose the times and days to launch the report.
• Stop Condition: In this tab, you can specify the behavior of the data collector set. You can choose to stop after an overall duration (seconds, minutes, hours, days, or weeks), choose limits such as duration or size, and choose to restart the data set when the limit is reached. Alternatively, you can choose to stop the report when all data collectors have reached their stop conditions.
• Task: In this tab, you can set a specific task to run when a data collector set stops. You can use task arguments (logs, state, user text) and set task arguments for the user text.
Use Reliability Reports
After you create data collector sets and run the diagnostics, you need a way to view and analyze this information. The reliability reports in the Reliability and Performance tool present this collection of data in a visual report for easier management. Reliability reports are broken down into two sections: User-Defined and System. The User-Defined section is self-explanatory, based on data collector sets you create. The System section reports are based on preconfigured system data collector sets.
To view reliability reports, perform the following steps:
1. In Server Manager, select Diagnostics, expand the console tree, and highlight Reliability and Performance Monitor. Expand Reports and then expand the User-Defined console tree.
2. Click the report you created earlier, and you see a name based on the subdirectory format and serial number you chose.
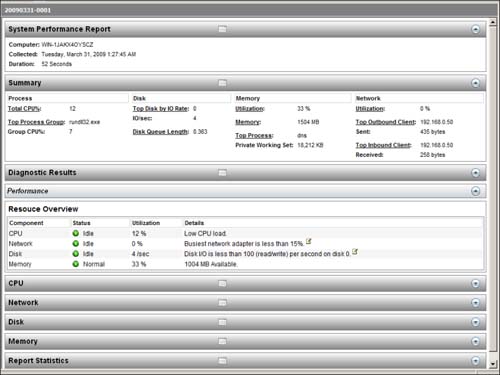
3. Highlight this report, and in the main window you see the reliability report (see Figure 12.5).
Figure 12.5 Overview of a user-defined report.
Note
For the predefined system reports, you may need to return to the data collector set and choose Action, Start to begin this set. When the diagnostic test is completed, you see a report with subdirectory format and serial number in the Reliability Reports section.
The report is broken down into eight segments:
• System Performance Report: Contains the computer name, the date and time the data collector was run, and the duration of collection, in minutes.
• Summary: Contains information about the physical state of the system, including process, disk, memory, and network utilization.
• Diagnostic Results: Provides a resource overview. Unlike the resource overview in real time, this snapshot view is taken during data collection.
• CPU: Provides detailed CPU usage information for processes, services, and systems.
• Network: Provides information on the network connections for this server, including TCP, interface, IP, and UDP statistics.
• Disk: Provides information on disk usage, such as hot files, disk breakdown, and physical disk statistics, including reads and writes to disks.
• Memory: Provides information on the memory of the system. This report is broken into two parts: Process (which shows memory usage on a per process basis) and Counters (where statistics are based on overall memory usage on this server).
• Report Statistics: Provides information on the computer, collection, files, and processed events.
These reports are useful in providing a detail look at a particular area of your server that may specifically need to be monitored. They also simplify the process of locating and diagnosing issues in your environment.
Troubleshoot Windows Server 2008
Solution: Once you have monitored your server and located a problem area, you need to troubleshoot that problem. Windows Server 2008 provides some built-in tools to help you troubleshoot events that take place in your environment. We will look at two specific methods that can be used to assist in troubleshooting Windows Server 2008: the Event Viewer, which many administrators are familiar with already, and several command-line tools that can perform specific troubleshooting tasks.
Troubleshoot Using the Event Viewer
Event Viewer is a familiar administrative tool that has been around since Windows NT. As Windows Server has improved, so has the Event Viewer, and Windows Server 2008 has made the Event Viewer better than ever by providing better filtering, better search capabilities, and an overall more manageable solution.
To use the Event Viewer to troubleshoot, do the following:
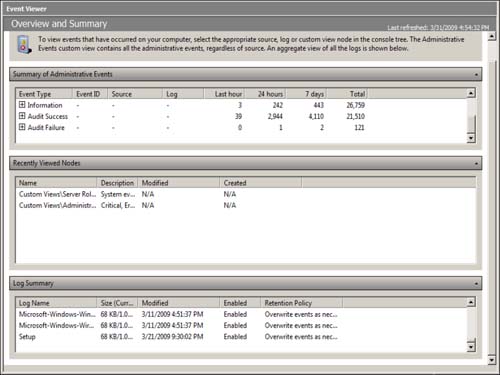
1. In Server Manager, expand the Diagnostics console tree and highlight Event Viewer. You see an Overview and Summary page of events for this server (see Figure 12.6). This is an aggregate view of all events, regardless of the source or type of event.
This page is broken into four parts
• Overview: Contains information on the type of events that are logged in the Event Viewer and where they can be found.
• Summary of Administrative Events: Provides an overview of all administrative events on this server.
• Recently Viewed Nodes: Provides information about where events have recently taken place on this system.
• Log Summary: Provides information about the event logs, including size (current/max.), modified date, and status.
Figure 12.6 Overview and Summary page in Event Viewer.
2. Expand the Event Viewer and notice these four folders:
• Custom Views: In older versions of Event Viewer, you could filter information to create a specific view of events in the logs. With Custom Views, you can now save those filters so that they do not need to be re-created each time. Each server role that is installed in Windows Server 2008 automatically creates this custom view.
• Windows Logs: This folder holds the familiar event log files you are used to seeing in Event Viewer. The Windows logs include Application, Security, Setup, System, and Forwarded Events.
• Applications and Services Log: These logs hold events that are specific to an application or a component rather than events that have systemwide effects. There are four categories for these events: Admin, Operational, Analytic, and Debug.
• Subscriptions: Troubleshooting an event sometimes calls for gathering information from more than one computer. With event subscriptions, you can collect copies of events from multiple remote computers. These events can then be filtered and viewed by the local server to use in troubleshooting.
Manage Event Viewer
In earlier versions of Event Viewer, the log files provided troubleshooting information that helped you locate the source of performance issues. In Windows Server 2008, some additional options have been added to make management easier.
The top portion of the Event Viewer shows the event level, date and time, source, event ID, and task category. The bottom portion of the screen shows a detailed description of the event. It also includes a link to Microsoft’s online event help, which provides more information (see Figure 12.7). From the Actions pane you can perform the following tasks for the event log:
• Open Saved Log
• Create Custom View
• Import Custom View
• Clear Log
• Filter Current Log
• Properties
• Find
• Save Events As
• Attach a Task to This Log
Figure 12.7 Detailed view of a system event in Event Viewer.
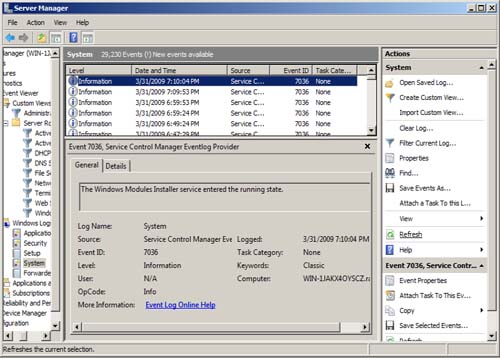
When you highlight an event, you see the following Action menu items:
• Event Properties
• Attach Task to This Event
• Save Selected Events
• Refresh
One of the newest Event Viewer features is the ability to attach a task to a log or an event. To see how this works, perform the following steps:
1. Select Action, Attach Task to This Log/Event to launch the Create a Basic Task Wizard.
2. Choose a name and description for this task and click Next.
3. On the next screen, which provides information about the log, source, and event ID, click Next.
4. Choose an action for the task to perform:
• Start a Program
• Send an E-mail
• Display a Message
Click Next.
5. In the next screen, choose the program or script to launch, create an e-mail and choose the SMTP server, or create a title and message. Click Next.
6. On the last page, where you see the name, description, trigger, and action, click Finish.
Create a New Subscription
To create new subscriptions, perform the following tasks:
Note
Creating a subscription requires that both the forwarding and collecting computers be configured. The Windows Remote Management (WinRM) service and the Windows Event Collector (Wecsvc) service must be running on both the forwarding and collecting computers before you create a new subscription.
1. Click Subscriptions in the console tree.
2. Select Action, Create Subscription.
3. On the subscription properties page, set the following:
• Subscription name
• Description
• Destination log
• Subscription type and source computer
• Events to collect
• User account and advanced settings
Click OK. (After the subscription is created, you can modify these selections by going to the properties page.)
4. Repeat the process on the forwarding computers to complete this subscription.
Note
You can access the subscriptions properties page from the properties of the Windows logs in the console tree.
Troubleshoot Using Command-Line Tools
Server 2008 provides a number of command-line tools for troubleshooting:
• Auditpol: Displays information and manipulates audit policies.
• Chkdsk: Checks the file system of a volume for errors (physical and logical).
• Dcdiag: Analyzes a domain controller’s state at the forest or enterprise level and reports any problems.
• Gpresult: Displays the resultant set of policy information that can be used to identify issues with Group Policy.
• Logman: Creates and manages event trace session and performance logs. Provides many of the functions of the Performance Monitor, but from the command line.
• Nltest: Troubleshoots configurations on the OS.
• Nslookup: Displays information you can use to diagnose DNS infrastructure.
• Recover: Recovers readable information from a defective disk.
• Repadmin: Diagnoses Active Directory replication problems between domain controllers.
• Sc: Allows you to test and debug service programs.
• Wevtutil: Retrieves information about event logs and publishers, installs event manifests, and runs queries. You can also use it to export, archive, and clear logs.
Note
For more information on troubleshooting Windows Server 2008, see http://technet.microsoft.com/en-us/library/cc753935.aspx.
Use the Problem Reports and Solutions
Solution: Problem Reports and Solutions, which is available in the Control Panel, is a tool that utilizes Windows Error Reporting (WER) technology to allow you to see any errors that are being reported in an easy-to-use interface. Not only can you see the errors Microsoft has made, it is much easier to get help with those annoying issues that you just cannot get to the bottom of (that is, if a resolution to the issue is available at the time). Solutions come in a variety of forms, such as the following:
• Workaround procedures
• Links to the Windows Update site
• Links to other websites for updated drivers or patches
• Knowledge Base articles
This tool allows you to set the level of consent when sending information to Microsoft. These are the options:
• Allow Each User to Choose Reporting Settings: This setting allows each user to decide if they will report errors to Microsoft. This can be set to report all errors or completely turned off to not report any errors.
• Ask Each Time a Problem Occurs: You are always be prompted before sending a report
• Automatically Check for Solutions: The minimum amount of data is automatically sent so Microsoft can see if there is an available solution. You are prompted before sending any additional data.
• Automatically Check for Solutions and Send Additional Information if Needed: The minimum amount of data is automatically sent, and any additional data that the developer needs to resolve the issue. This is unlikely to contain any personal identity information.
• Send All Data: All data concerning the error will be sent to Microsoft. This setting can be selected only with Group Policy (not from the applet in the Control Panel).
Note
You can control the level of consent pertaining to user application errors. For user programs, you can either turn it on, turn it off, or allow each user to choose his or her settings.
In addition to setting your consent levels, you have the ability to block all data from a particular program from being sent. All you need to do is add that application’s executable to the block list. Follow these steps to add Notepad to your block list:
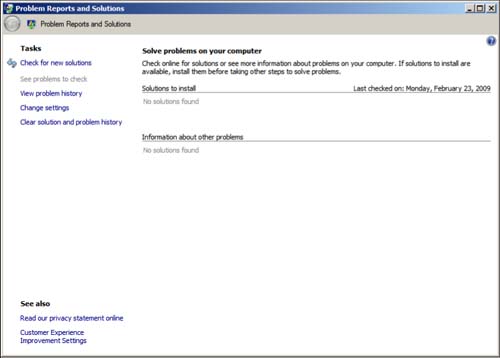
1. From the Control Panel, open the Problems Reports and Solutions applet.
2. On the top left of the screen, click Change Settings. Note that you also have the following options (see Figure 12.8):
• Check for New Solutions
• See Problems to Check (disabled if there are none)
• Clear Solution and Problem History
Figure 12.8 A look at the Problems Reports and Solutions tool.
3. Choose either Check for Solutions Automatically or Ask Me to Check if a Problem Occurs.
4. To get to the block list page, click Advanced Settings.
5. In the top portion of this page, set the consent levels for your programs and/or your Windows OS (see Figure 12.9).
Figure 12.9 Set your consent levels and configure the block list.
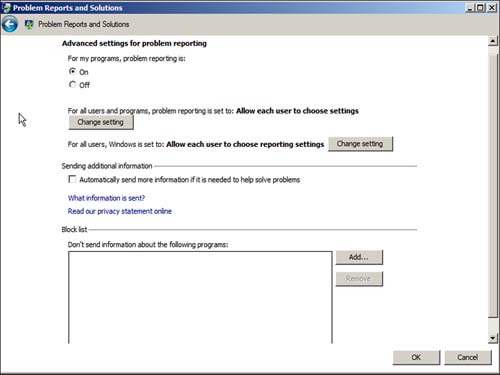
6. In the lower portion of the page, add a program executable to the block list by clicking the Add button.
7. Navigate to the file you need to block—in this case, notepad.exe. You can either look through all the directories to find it, or you can utilize the search feature on the top right.
8. Highlight the file and click Open (or just double-click the file). You see the file added to the block list in the Problem Reports and Solutions tool. Click OK twice to get back to the first screen. You have successfully blocked any error information generated via Notepad from being sent to Microsoft.
Note
The Problem Reports and Solutions tool can be very useful when you’re managing your Windows Server 2008 infrastructure.
Monitor Performance and Troubleshoot in Windows Server 2008 R2
Solution: Windows Server 2008 R2 will include some new performance monitoring and troubleshooting tools. Enhancements will be made to events and error reporting. These improvements include the following:
• Informational alerts about Windows Vista events that pertain to this server.
• Information about Windows Server 2008 events.
• Suggested procedures for diagnosing and resolving server errors.
• Information about how to verify that a server has been returned to a normal operating state.
New to Windows Server 2008 R2 will be the inclusion of the Best Practice Analyzer (BPA). This tool will allow you to take a baseline measurement of the server configuration and compare that baseline to industry standards for best practices for performance.
For more information on performance monitoring and specifically about new enhancements to Event Viewer troubleshooting, see http://technet.microsoft.com/en-us/library/dd299435.aspx.