
Chapter 1
Introducing Wireshark
Welcome to Wireshark for Security Professionals. This introductory chapter covers three broad topics. In the first part, we discuss what Wireshark is used for and when to use it.
The second part of this chapter introduces the popular graphic user interface (GUI). The GUI for Wireshark can appear quite busy at first, so we immediately want to get familiar with its layout. We break down the different areas of the interface, how they relate to one another, and the reasoning for needing each one. We also discuss how and when each part of the interface helps you maximize your use of Wireshark.
In the third part of this chapter, we discuss the way Wireshark filters data presented on the interface. Being familiar with Wireshark's interface helps you appreciate all the data presented, but the amount of data can still be overpowering. Wireshark offers ways to filter or separate what you need from all that is presented. The last part is about different types of filters and how you can customize these filters.
Wireshark can appear to be a complicated tool, but by the end of this first chapter, the hope is you have a much higher comfort level with the tool's purpose, interface, and ability to present you with what you want to see.
What Is Wireshark?
Wireshark, in its most basic sense, is a tool to understand data you capture from a network. The captured data is interpreted and presented in individual packet form for analysis, all within Wireshark. As you probably already know, packets are the chunks of data streaming on a network. (Technically, depending on the context level of where in the system the data is interpreted, chunks are called frames, datagrams, packets, or segments, but we'll just use “packets” for now.) Wireshark is a network and protocol analyzer tool, free for download and use on a variety of platforms, spanning many flavors of Unix and Windows.
Wireshark first captures the data from a network interface and then breaks the capture into the frames, segments, and packets, understanding where they begin and end. Wireshark then interprets and presents this data in the context of addressing, protocols and data. You can analyze the captures immediately or save them to load later and share with others. In order for Wireshark to view and capture all packets, not just those involving the capturing system, the network interface is placed in promiscuous mode (also called monitor mode) in the context of capturing on a wireless network. Finally, what grants you the ability to analyze packets in Wireshark are the dissectors. All these basic elements are discussed in more detail in Chapter 4, in the context of “sniffing” or capturing data, and how that captured data is interpreted.
A Best Time to Use Wireshark?
Wireshark is an immensely powerful tool with quite a bit of deep and complex functionality. It is capable of handling a wide range of known (and unknown) protocols. But although the functionality range is broad, most of it aligns to one end: to capture packets and analyze them. Being able to take the bits and bytes and present them in an organized, familiar, and human-readable format is what brings people to think of using Wireshark.
Before launching Wireshark, it's important to understand when to use it and when not to use it. Sure, it's a great tool, but like any tool, it's best used when it's the right tool for the job.
Here are scenarios when it's ideal to use Wireshark:
- To look for the root cause of a known problem
- To search for a certain protocol or stream between devices
- To analyze specific timing, protocol flags, or bits on the wire
And while not ideal, Wireshark can also be used:
- To discover which devices or protocols are the top talkers
- To see a rough picture of network traffic
- To follow a conversation between two devices
You get the idea. Wireshark is ideal for determining a root cause of an understood problem. While not ideal for browsing network traffic or making high-level judgments about the network, Wireshark does have some features to show those statistics. But Wireshark can't and shouldn't be the first tool thought of early on in discovering a problem. Someone who opens Wireshark to skim through the list of packets to assess network health would soon be overwhelmed. Instead, Wireshark is for problem solvers, for the detectives who already know their suspects well.
Avoiding Being Overwhelmed
The majority of people who walk away from Wireshark do so because they find it overwhelming after only a few early experiences. To label Wireshark as overwhelming is misleading, however. What really paralyzes new users is the traffic, the list of packets flying by, not the application's functionality. And, fair enough, once you start a capture and the packets scroll by in real time, it's definitely intimidating. (But that's what filters are for!)
To avoid being overwhelmed, consider two aspects of Wireshark before diving into it:
- The interface—how it's laid out and why
- Filters—how they work to reveal what you want
Once you get a quick appreciation of the tool's interface and how to write a filter, Wireshark suddenly appears intuitive and shows its power, without the scare factor. And that's what we focus on for the rest of this chapter.
The following sections are on the most important aspects that you need immediately to be comfortable using Wireshark. If you are already familiar with Wireshark, as well as filters, feel free to skim this chapter as a refresher so that you can be sure you are on the same page for the rest of the book.
The Wireshark User Interface
We start with the busy Wireshark GUI, which is packed with features. We provide a high-level overview of where you need to look to start seeing some packet data. With packet capturing covered, we then discuss the more powerful features of Wireshark, starting with dissectors. In Wireshark, dissectors are what parse a protocol and decode it for presenting on the interface. They enable Wireshark to give the raw bits and bytes streaming across the wire some context by displaying them into something more meaningful to the human analyst. We then round off the chapter by covering the various filters available to help limit and zero in on just the network data you are interested in.
The home screen appears when you open Wireshark. On this screen are shortcuts you can use to start a new capture or open a previous capture file. For most newcomers to Wireshark, the brightly colored Capture button is the most attractive option. Starting a capture leads to a flurry of scrolling packets, which for the newcomer then leads to overwhelm. But let's go back to the home screen. There are also links to online documentation that you can use to figure out how to accomplish a certain task.
On the top of the screen, as shown in Figure 1-1, is the menu bar in the classic format you are probably familiar with. These menus have settings and other features like statistics that can be accessed when needed. (Don't worry—we aren't really worried about statistics.) Below these menus is the Main toolbar, which has quick access icons for the functionality you will use most while analyzing network traffic. These icons include things like starting or stopping a capture, and the various navigation buttons for finding your way around captured packets. Icon buttons are typically grayed if not applicable or usable—for example, without a capture yet.
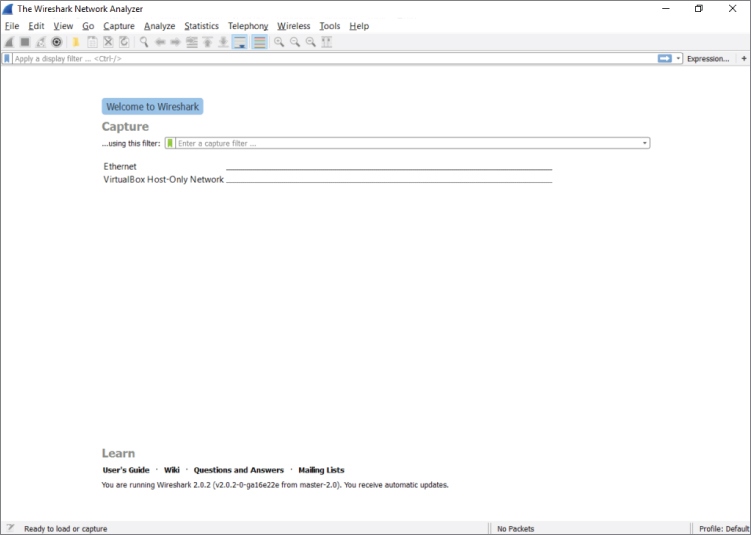
Figure 1-1: The Wireshark home screen
Icons change over time from version to version. At the time this book was written, the blue shark fin starts a capture and the red square stops a capture. The shark fin is gray until the network interface is chosen, and we cover that soon. Also note that this toolbar area gives you a visual indication of the capture process. Again, many options are grayed out in Figure 1-1 because we are not yet capturing or don't have a capture completed. As you go through this chapter, pay attention to this area to understand how it changes and how it reflects the various capture states. In many respects, Wireshark has an intuitive user experience.
The Filter toolbar, which is below the Main toolbar, is a vital part of the Wireshark UI. You will soon fall in love with this little box, as you often find yourself drowning in a torrent of traffic. The Filter toolbar lets you remove whatever is uninteresting to the task at hand and presents just what you're looking for (or takes out what you're not looking for). You can enter display filters in the Filter text box that help you drill down what packets you see in the Packet List pane. We discuss filters in detail later in this chapter, but for now just trust me: They will be your new best friends.
Packet List Pane
The largest portion in the middle of the interface is reserved for the packet list. This list shows all the packets captured along with useful information, such as source and destination IP, and the time difference between when the packets were received. Wireshark supports color coding various packets to make sorting of traffic and troubleshooting easier. You can add custom colors for packets of interest, and the columns within the Packet List pane display useful information such as the protocol, packet length, and other protocol-specific information (see Figure 1-2).

Figure 1-2: The Packet List pane
This window is the bird's-eye view into the network you are sniffing or the packet capture you have loaded into Wireshark. The last column, by default labeled “Info,” offers a quick summary of what that packet contains. Of course, it depends on the packet, but it might be the URL for an HTTP request or the contents of a DNS query, which is really useful for getting a quick handle on important traffic in your capture.
Packet Details Pane
Below the Packet List pane is the Packet Details pane. The Packet Details pane shows information for the selected packet in the Packet List pane. This pane contains a ton of information, down to what the various bytes are within the packet. Information such as the source and destination MAC address is included here. The next row contains IP information. The next row reveals the packet is sending to UDP port 58351. The next row reveals what information is contained in that UDP packet.
These rows are ordered by the headers as they are ordered when sending data on the network. That means they are subject to change if you are capturing on a different type of network, such as a wireless network, that has different headers. The DNS column, which is the application data encapsulated within UDP, is expanded in Figure 1-3. Notice how Wireshark allows you to easily pull out information, such as the actual DNS query that was made within this DNS packet. This is what makes Wireshark the powerful network analysis tool that it is. You don't have to memorize the DNS protocol to know which bits and bytes at what offset translate into a DNS query.

Figure 1-3: The Packet Details pane
Subtrees
Because the details would be overwhelming if shown all at once, the information is organized and collapsed into sections. The sections, called subtrees, can be collapsed and expanded to display only what you need. (In Figure 1-2, the subtrees are collapsed; in Figure 1-3, they are expanded.)
If you're already familiar with how a data frame is structured, you recognize how the packet details subtrees are divided. Details are structured into subtrees along the lines of the data frame's headers. You can collapse/expand a subtree by clicking the arrow sign next to the relevant section. The arrow is pointing to the right if the subtree is collapsed. Once you click on the arrow to expand that subtree, you'll see the arrow points down (refer to Figure 1-3). And, of course, you'll always have the option to expand or collapse all subtrees by right-clicking anywhere in the Packet Details pane to launch its pop-up menu.
In Figures 1-2 and 1-3, packet number 7 is selected. Whatever packet is selected in the Packet List pane is the packet presented in the panes below it. In this case, it's packet number 7 showing within the Packet Details pane.
If you double-click this packet, a separate window appears, to open the packet details. This is useful when you want to visually compare two different packets quickly. The Packet Details area in Figure 1-3 shows various rows of information that can be expanded or collapsed.
Capturing Enough Detail
The first row contains metadata regarding the packet, such as the number of the packet, when it was captured, on what interface it was captured, and the number of bytes captured versus the number of bytes that were on the wire. That last part might sound a little strange. Wouldn't you always capture all the bytes that go across the wire? Not necessarily. Some network capture tools allow you to capture only a subset of the bytes that are actually transmitted across the wire. This is useful if you only want to get an idea of the type of packets that are going across the wire but not what actual data those packets have, which can greatly reduce the size of the packet capture. The downside, of course, is that you get only a limited amount of information. If disk space is not an issue, feel free to capture it all. Just be mindful that you are capturing and storing all traffic traversing that network cable, which can quickly become a significant amount.
There are ways to limit the size of the capture. For example, instead of truncated packet data, capture only specific packet types and not all traffic. If someone wants to send you a capture, or if you want to see specific traffic, you can have Wireshark capture only the traffic you want, saving space. Everything is done using the right filters—and that section is coming soon enough!
Packet Bytes Pane
What follows the Packet Details pane is the Packet Bytes pane. This pane is at the bottom of the screen and wins the award for least intuitive. At first glance, it simply looks like gibberish. Bear with me for a couple of paragraphs; it will all make sense soon.
Offsets, Hex, and ASCII
You can see the Packet Bytes pane is divided into three columns. The first, left-most column simply counts incrementally: 0000, 0010, 0020, and so on. That's the offset (in hexadecimal) of the selected packet. Here, offset simply means the number of bits off from the beginning—again, counting in hexadecimal (where 0x0010 = 16 in decimal). The middle column shows information, in hexadecimal, at that offset. The right-hand column shows the same information, but in ASCII. For example, the total amount of information from the very beginning (offset 0000) to offset 0010 is 16 bytes. The middle column shows each of the 16 bytes in hex. The right-hand column shows each of the 16 bytes in ASCII characters. When a hexadecimal value doesn't translate to a printable ASCII character, only a “.” (period), is shown. So the Packet Bytes pane is actually the raw packet data as seen by Wireshark. By default, it is displayed in hex bytes.
Right-clicking the pane gives you the option to convert the hex bytes into bits, which is the purest representation of the data, though often this might not be as intuitive as the hex representation. Another neat feature is that any row you highlight within the Packet Details pane causes the corresponding data within the Packet Bytes pane to be highlighted. This can be helpful when troubleshooting Wireshark's dissection, as it allows you to see exactly which packet bytes the dissector is looking at.
Filters
When you start your first packet capture, a lot will probably be going on in the Packet List pane. The packets move across the screen too fast to make sense of anything meaningful. Fortunately, this is where filters can help. Filters are the best way to quickly drill down to the information that matters most during your analysis sessions. The filtering engine in Wireshark allows you to narrow down the packets in the packet list so that communication flows or certain activity by network devices becomes immediately apparent.
Wireshark supports two kinds of filters: display filters and capture filters. Display filter are concerned only with what you see in the packet list; capture filters operate on the capture and drop packets that do not match the rules supplied. Note that the syntax of the two types of filters is not the same.
Capture filters use a low-level syntax called the Berkeley Packet Filter (BPF), whereas display filters use a logic syntax you will recognize from most popular programming languages. Three other packet-capturing tools—TShark, Dumpcap, and tcpdump—also use BPF for capture filtering, as it's quick and efficient. TShark and Dumpcap are both command-line packet-capturing tools and provide analysis capabilities, the former being the command-line counterpart to Wireshark. TShark, covered more deeply with example output, is introduced in Chapter 4. The third, tcpdump, is strictly a packet-capturing tool.
Generally, you use capture filters when you want to limit the amount of network data that goes into processing and is getting saved; you use display filters to drill down into only the packets you want to analyze once the data has been processed.
Capture Filters
There are times when capturing network traffic that you can limit the traffic you want beforehand; at other times you will have to because the capture files will grow too large too fast if you don't start filtering. Wireshark allows you to filter traffic in the capture phase. This is somewhat similar to the display filters, which you will read about later in this chapter, but there are fewer fields that can be used to filter on, and the syntax is different. It's most important to understand that a capture filter screens packets before they are captured. A display filter, however, screens what saved packets are displayed. Therefore, a restrictive capture filter means your capture file will be small (and thus a smaller number of displayed packets, too). But using no capture filter means capturing every packet, and thus a large capture file, on which display filters can be used to narrow the list of packets shown.
While it makes sense for Wireshark to capture everything by default, it does actually use default capture filters in some scenarios. If you are using Wireshark on a remote session, such as through Remote Desktop or through SSH, then capturing every packet would include many packets relaying the session traffic. Upon startup, Wireshark checks to see whether a remote session is in use. If so, a capture filter to filter out remote session traffic is in use by default.
The building blocks of a capture filter are the protocol, direction, and type. For example, tcp dst port 22 captures only TCP packets with a destination port of 22. The possible types are:
hostportnetportrange
Direction can be set using src or dst. As you suspect, src is for capturing from a specified source address, while dst can specify the destination address. If it is not specified, both will be matched. In addition to specifying one direction, the following combined direction modifiers can be used: src or dst and src and dst.
In a similar way, if a type is not specified, a host type will be assumed. Note that you need to specify at least one object to compare to; the host modifier will not be assumed if you would only specify an IP address as filter and will result in a syntax error.
The direction and protocol can be omitted to match a type in both source and destination across all protocols. For example, dst host 192.168.1.1 would only show traffic going to the specified IP. If dst is omitted, it would show traffic to and from that IP address.
The following are the most commonly used BPF protocols:
ether(filtering Ethernet protocols)tcp(filtering TCP traffic)ip(filtering IP traffic)ip6(filtering IPv6 traffic)arp(filtering ARP traffic)
In addition to the standard components, there is a set of primitives that do not fit in one of the categories:
gateway(matches if a packet used the specified host as gateway)broadcast(for broadcast, not unicast, traffic)less(less than, followed by a length)greater(greater than, followed by a length)
These primitives can be combined with the other components. For example, ether broadcast will match all Ethernet broadcast traffic.
Capture filter expressions can be strung together using logical operators. Again, with both the English and the logical notation:
and(&&)or(||)not(!)
For example, here are some filters for systems named alpha and beta:
host beta(captures all packets to and from the alpha system)ip6 host alpha and not beta(captures all IP packets between alpha and any host except beta)tcp port 80(captures all TCP traffic across port 80)
Debugging Capture Filters
Capture filters operate on a low level of the captured network data. They are compiled to processor opcodes (processor language) in order to ensure high performance. The compiled BPF can be shown by using the -d operator on tcpdump, Dumpcap, or TShark, and in the Capture Options menu in the GUI.
This is useful when debugging a problem where your filter is not doing exactly what you were expecting. The following is an example output of a BPF filter:
localhost:~$ dumpcap -f "ether host 00:01:02:03:04:05" -d
Capturing on 'eth0'
(000) ld	[8]
(001) jeq	#0x2030405	jt 2	jf 4
(002) ldh	[6]
(003) jeq	#0x1		jt 8	jf 4
(004) ld	[2]
(005) jeq	#0x2030405	jt 6	jf 9
(006) ldh	[0]
(007) jeq	#0x1		jt 8	jf 9
(008) ret	#65535
(009) ret	#0
As previously mentioned, using the -d operator will show the BPF code for the capture filter. And, used in the example above, the -f operator will show the libpcap filter syntax.
Following is a line-by-line explanation of the BPF:
- Line 0 loads the offset for the second part of the source address.
- Line 1 compares the packet at the offset to 2030405 and jumps to line 2 if it matches, or line 4 if it doesn't match.
- Lines 2 and 3 load the offset for the first part of the source address and compare it to 0001. If this also matches, it can return 65535 to capture this packet.
- Lines 4 through 7 do the same as lines 0 through 3 but for the destination address.
- Lines 8 and 9 are instructions to return.
You can use this method of analyzing the filter step by step to verify where the filter is going wrong.
Capture Filters for Pentesting
We suspect you already know this, but we'll add this, just in case: “Pentesting” is short for penetration testing, the art of testing a computer, network, or application to search for vulnerabilities. Any pentesters reading this book are familiar with the concept that you end up getting blamed for every problem that happens on the network even if you aren't connected to it at the time. As such capturing data on a pentest is helpful when you need to prove to upset clients that you genuinely had nothing to do with the switch dying or a business-critical SCADA system exploding. It is also helpful when you need to review your packet captures for general information gathering or post-test analysis and reporting.
The following snippet would capture all your outgoing traffic to serve as a logbook for your actions on the network. It captures only traffic coming from your network card identified by the MAC address and saves it split up in multiple time-stamped files prefixed by pentest. Notice that Dumpcap was used here instead of the GUI or TShark.
dumpcap -f "ether src host 00:0c:29:57:b3:ff" -w pentest -b
  filesize:10000
You can run this snippet in the background, as running an entire instance of Wireshark would tie up too much of the system resources.
Saving only the outgoing traffic is not much use for pentest analysis. To capture all traffic going to and from your testing machine combined with broadcast traffic, use the following snippet:
dumpcap -f "ether host 00:0c:29:57:b3:ff or broadcast" -w pentest -b
  filesize:10000
As you can see, only the src directive was dropped, and a broadcast expression was combined with the Ethernet expression using the or statement.
The following pentesting snippet can also be used to capture traffic to and from a list of IP addresses, such as all the IPs that are in scope for your pentest. This applies to cases where you are using multiple virtual machines and thus MAC addresses, but you want to be able to log all relevant traffic.
dumpcap -f "ip host 192.168.0.1 or ip host 192.168.0.5"
The list of hosts could get a little large to type by hand, so it is more practical to store your in-scope targets in a hosts.txt file and use it instead. To generate the filter itself, use the following one-liner and strip the last or:
cat hosts.txt | xargs -I% echo -n "ip host % or "
Display Filters
To get started with display filters, we begin with a brief explanation of the syntax and available operators, followed by a walkthrough of a typical use that should get you up to speed in no time.
The display filter syntax is based on expressions returning true or false by using operators for comparison. This can be combined with Boolean logic operators to combine several expressions so that you can really drill down your results. See Table 1-1 for the most common comparison operators.
Table 1-1: Comparison Operators
| ENGLISH | C-LIKE | DESCRIPTION |
| eq | == |
Equal |
| ne | != |
Not equal |
| gt | > |
Greater than |
| lt | < |
Less than |
| ge | >= |
Greater than or equal to |
| le | <= |
Less than or equal to |
| Contains | Tests if the filter field contains a given value | |
| Matches | Tests a field against a Perl style regular expression |
Source: http://www.wireshark.org/docs/wsug_html_chunked/ChWorkBuildDisplayFilterSection.html
If you have used any modern programming language, the syntax should look familiar. To make a useful expression, you have to match these operators against variables in the packet. This is possible in Wireshark by accessing variables grouped by protocol. For example, ip.addr would contain the destination and the source address. The following statement filters all the traffic coming from or going to the supplied IP address: ip.addr == 1.2.3.4. This works by matching against both the destination and the source address header in the IP packet so that it will return true for packets in both directions.
In the previous example on comparison operators, an IP address was compared to the variable ip.addrgoogle.comhttp://www.wireshark.org/docs/dfref/. In practice, you can also see the values Wireshark expects for each element in the packet by inspecting the packet using the Packet Details pane. The variable names can be found on the bottom left of the screen in the status bar or looked up in the reference. The status bar lists the filter field for the selected line in the Packet Details pane.
For an example of this, see Figure 1-4. A packet is captured, and 1 byte is highlighted in the Packet Details pane. The 1-byte portion denotes the IP version. See the lower left of the application, on the status bar: “Version (ip.version), 1 byte.”
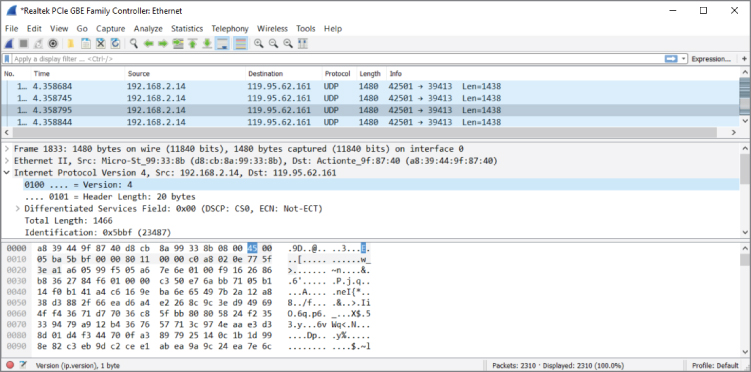
Figure 1-4: Field information in the status bar
A good way to filter the available packets is to decide on an expression by inspecting a packet that interests you. It is easier to see the differentiating markers between packets you do want to see by comparing fields in the Packet Details pane. As shown in Figure 1-5, each field in the ARP packet is listed with a readable value (hex in the Packet Details pane) followed by the raw value (on the right side of the Packet Details pane). Both of these values can generally be used in an expression, as Wireshark transforms the readable format to the corresponding raw format for your convenience. For example, if you want to see only ARP requests in the Packet List pane, the filter would be arp.opcode == 1. In this case, typing would not work, because it is not a named representation of the same data. (The number 1 could mean many things.) With MAC addresses, protocol names, and so on, the named version can be used.request
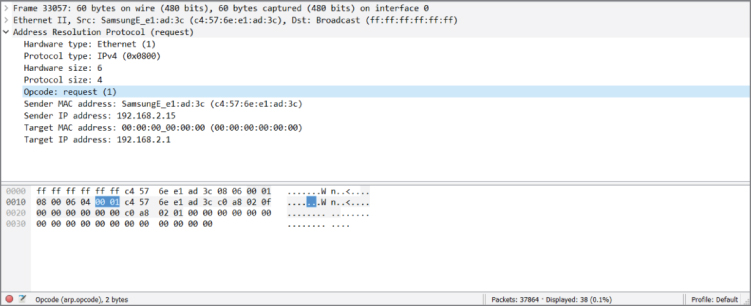
Figure 1-5: ARP packet Opcode
Usually a single expression is not specific enough to narrow down the stream of packets you are looking for when dealing with larger packet captures, as is the case with Figure 1-5. To locate the exact set of packets you want to see, you can combine expressions by logical operators. Table 1-2 shows the available operators. The symbol and English-word operator can be used interchangeably according to personal preference.
Table 1-2: Logical Operators
| ENGLISH | C-LIKE | DESCRIPTION |
| and | && |
Logical AND. Returns true if both expressions are true. |
| or | || |
Logical OR. Returns true if one or both expressions are true. |
| xor | ^^ |
Logical Exclusive OR. Returns true if only one of both expressions is true. |
| not | ! |
Logical NOT. Negates the following expression. |
[ ] |
Slice operator. With this operator a slice (substring) of the string can be accessed. dns.resp.name[1..4] accesses the first four characters of the DNS response name. |
|
( ) |
Groups expressions together. |
Source: http://www.wireshark.org/docs/wsug_html_chunked/ChWorkBuildDisplayFilterSection.html
Building Display Filters Interactively
To quickly gain experience at building filters, you can use the graphical interface of Wireshark and the various context menus to build filters interactively. Start by right-clicking on a section of a packet that interests you, and then select Apply as Filter ![]() Selected to filter the packet list by the selected variable. For example, selecting the source IP address field and applying a filter to it is a good way to start quickly narrowing down the packets you are interested in.
Selected to filter the packet list by the selected variable. For example, selecting the source IP address field and applying a filter to it is a good way to start quickly narrowing down the packets you are interested in.
After filtering for this particular IP address, you might want to add a destination port to the filter to only see traffic from this host to port 80. This can also be done in the GUI without throwing away the current filter by right-clicking the source port in the Packet Details pane and selecting Apply as Filter ![]() Selected to combine the new filter with the old one using
Selected to combine the new filter with the old one using and. The GUI also lists other combinations, such as or, not, and so on. Additionally, you can use the Prepare as Filter context menu to create the filter without actually applying it to your Packet List pane.
Figure 1-6 shows an example of the display filter code after selecting two items: ARP protocol packets and the source MAC address.

Figure 1-6: Filter results of ARP from a source address
After selecting ARP to apply as a filter, only ARP protocol packets from various systems were displayed in the Packet List pane. Subsequently selecting a source MAC (SamsungE_e1:ad:3c) as a filter expression, the display filter was amended to become arp.src.hw_mac == c4:57:6e:e1:ad:3c.
Figure 1-7 shows how complex filter statements can be built using this technique. As you can see in the status bar, Wireshark might suggest adding parentheses or suggest the User Guide. In upcoming chapters we will build and use many filters; this is just to show that filters can certainly grow past one or two functions.
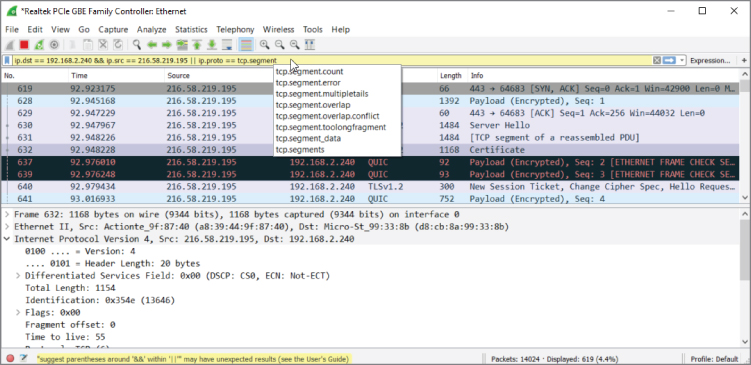
Figure 1-7: Complex display filter example
You can always use the context menus to edit the filter in the Filter bar after you start it. If building them interactively, make sure you are aware of the filters Wireshark applies for you by noting what syntax was inserted in the Filter bar.
Building filters interactively provides a great way to understand the most commonly used filter fields and protocols. This will pay off when dealing with advanced Wireshark use cases in the future.
Summary
Congratulations on finishing the first chapter. It's a fairly light chapter, as we haven't begun actually working with the application yet. Given the belief that new Wireshark users are commonly surprised by the fast-growing number of packets, the book aims to nip overwhelm before it happens. The two big areas to cover before actually using Wireshark are the GUI and filters.
We provided a general overview of the GUI, focusing on its layout and the reasoning behind it. The layout is divided into three panes: Packet List, Packet Details, and Packet Bytes. The panes present packet data at different levels of detail and serve to help the user drill down to individual bytes.
The chapter also discussed Wireshark's two types of filters. You can use capture filters to filter what packets are captured. Capture filters operate while a capture is taking place, screening what network traffic is kept and what traffic is ignored. You also can use display filters to filter what packets are presented. Display filters operate either while a capture is taking place or after a capture has finished.
The next chapter presents options for running Wireshark, particularly using virtual environments.
Exercises
- Consider existing network issues you might have where Wireshark might be helpful. (Knowing these issues might be useful in later chapters.)
- Write down a few filter examples to help in the case of exercise #1.
- Design a display filter that will help you see DHCP request and response traffic for when another machine first connects to the network.