
Chapter 3
The Fundamentals
It's a sure bet that readers will come from a variety of backgrounds, possess varied skill sets, and approach Wireshark with a range of expectations. So, there are fundamentals to solidify before moving on. This chapter aims to both refresh memories and deliver new material (while acknowledging that readers will have different ideas of what needs refreshing and what might be new).
We highlight some key areas and assume that you will delve deeper into a topic if you wish to do so. There are three main areas where people's experience and expectations likely differ:
- Networking
- Security
- Packet and protocol analysis
Each subject is chosen in anticipation of exercises in the upcoming chapters. We cover basic concepts and, where possible, apply those concepts toward the other two.
Note that some of the things covered may be considered too basic by some readers. It is our hope, however, that as you read you will discover some new and helpful concepts. The goal is to ensure that all readers have a common understanding of these fundamentals and can make the most of using Wireshark.
Networking
Without networking, there will be no packets to capture from the box you're sitting in front of now. It's essential we're on the same page about how information flows from one device to another, and nothing summarizes it better than working through the OSI model.
OSI Layers
Yes, it wouldn't be a networking discussion without mentioning the OSI model and the layers therein. It's assumed you have all seen the following group of layers: the Open Systems Interconnection reference model, or OSI model. Each layer of one system talks to the corresponding layer of the other system. See the following list for the familiar breakdown of the seven OSI layers. A few words are included to remind you what each layer handles.
- SYSTEM 1 ← --------------------------------- → SYSTEM 2
- Application ← specific service or application → Application
- Presentation ← how the service is formatted → Presentation
- Session ← rules how systems talk to one another → Session
- Transport ← segment reliability, error checking → Transport
- Network ← packets / datagram routing → Network
- Data Link ← structure of data to/from physical → Data Link
- Physical ← tangible electrical, light or RF → Physical
When you are working with Wireshark, the layers are directly apparent in the Packet Details pane. In an earlier chapter, we mentioned how the Wireshark GUI is organized. In Figure 3-1, we show just the top two GUI panes, the Packet List pane and the Packet Details pane. Wireshark's Packet Details pane shows the packet divided into subtrees. Each subtree represents an OSI layer. If you click and highlight the very top subtree, “Frame 4,” then all 314 bytes in the Packet Bytes pane would highlight.
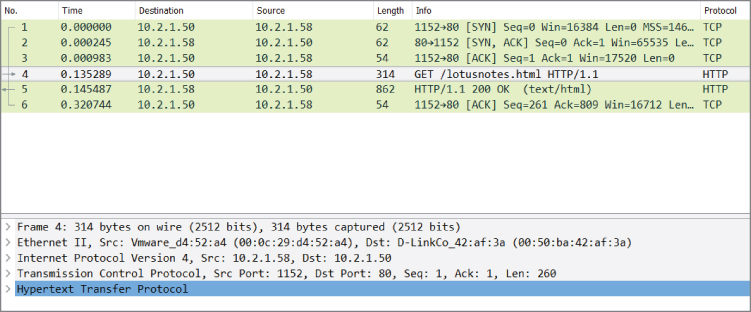
Figure 3-1: OSI layers in Wireshark
In Figure 3-1, the OSI layers begin with the next subtree, “Ethernet II,” as the layer 2 frame. The next subtree, “Internet Protocol Version 4…,” is the layer 3 packet. The next subtree, “Transmission Control Protocol,” is the layer 4 TCP segment. Finally, at the bottom of the figure, the innermost, highlighted portion is the last subtree showing an application layer protocol, HTTP.
Seeing the packet in Wireshark is a great demonstration of how one layer is sandwiched by another. To be more accurate, only the two bottom layers include both a header and footer. The top five include only a footer. The next section shows an example workflow of how data progresses through these layers.
Get the Picture?
Bear with me on this example of sending a picture from one system to another.
Obviously, a picture cannot keep the appearance of a picture across the wire. The information must go through a few stages of abstraction before sending. This is the same requirement for any picture, song, or other application data.
For the data to be understood as a definite “picture,” it has to follow some standards or rules. The picture's presentation is understood by both sending and receiving systems. Maybe the picture needs to be encrypted, reformatted, or compressed. In any case, it is here where our picture goes through real abstraction and transformation.
The picture is ready to send as far as it's concerned. However, both systems still need to agree how to communicate. Maybe our two systems agree to speak only when spoken to, or perhaps talk at the same time during their session, but here the systems agree our whole picture must be divided into segments of data. More guidelines include how much picture data to send at a time, ensuring each packet will get there (and what to do if not), how quickly to send more or less, and, of course, how to number each segment so that the picture doesn't end up resembling a Rorschach test when put back together. In all, the real networking starts with these rules on how to transport your picture.
Of course, odds are good your two systems are connected to each other on the same network. They could be on different floors, in different buildings, or in different countries. Because different places have their own networks, your data segments become network packets. Appended to every packet is instruction where is it ultimately going, and where it was ultimately from.
However, the final stop is irrelevant to this last abstraction step. Closer to the real world, there are multiple hops across networks. To prepare network packets for sending requires an important link, the data link. Regarding the data link layer, additional addressing is needed, relevant only to the next actual hop, from the previous hop. Finally, according to the needs of the physical hardware, your digital information gets readied to be sent into the real world. What used to be packets are now frames. Those frames are transmitted as pulses of voltage, light, or as radio waves. And, thanks to all the agreed protocols between systems, those pulses will again become the picture.
Described above is the tiered series of steps of how data goes through layers of abstraction and encapsulation to get out of the system.
Example
A user calls you because she opened a suspicious attachment. (First, thank her for coming forward about that!) She now suspects the PC is making unauthorized connections, or at least trying, based on screen activity. She watched her network link light, but it doesn't “seem to be super lively.” Still, she asks if you could confirm her doubts.
You first confirm antivirus is running as well as the Windows Firewall. Nothing caught, but a few minutes spent diagnosing the desktop raise the alarm that, yes, something is indeed trying to connect outside. What would convince you whether traffic is or isn't getting out? Enter Wireshark.
As you know, Wireshark shows what packets are leaving and entering the client. You have an idea of the baseline type of traffic, and perhaps after a long and careful examination, you would hope to find some culprit traffic and insight into what data is being sent. Or at the least the destination information.
But this isn't a question about security best practices. (You are a security professional; we don't need to quiz you on that.) This is a question about whether Wireshark can help you and what you should expect to see.
Will Wireshark show you anything? To answer that, consider where Wireshark sits in the stack in the OSI layers. Yes, Wireshark presents its data to you at the application layer. But the data presented originates with the lowest logical layer, the data link layer. From the data link layer, you are seeing the entire frame, starting with the MAC addresses, then all the data encapsulated within.
You decide to install Wireshark on the suspect machine. After Wireshark has been running for any considerable time, you might have a fairly large capture file. Even with great filter finesse, however, no unaccountable connections are leaving the machine. You run Wireshark on a machine connected to a local hub and capture packets going to and from the user's machine. To your surprise, you actually see connection initiation attempts going to the user's desktop, but nothing in response.
What's happening? The Windows Firewall is stopping the outbound connection from finishing.
It's important to recognize that results differ depending where Wireshark is run. When capturing on a Windows system, winpcap is doing the capturing, not the application Wireshark. And winpcap performs “closer” to the network card than an application layer firewall, like Windows Firewall.
With regard to packets heading to the user's system, you are capturing packets before the firewall sees them. But in regard to any packets that would be blocked by Windows Firewall, those packets won't make it to Wireshark (winpcap), no matter where you're capturing.
In general, it is best practice to run Wireshark from a device on the network, rather than on a system in question. This way, you're really seeing what's on the wire, versus what you think should be on the wire (and maybe wrongly confirmed).
Networking between Virtual Machines
There will be times you are capturing packets between multiple virtual machines (VMs), or you are capturing packets between a VM and your host system. Or you will capture packets between a VM and a system outside your private network. In any event, it's a good idea to quickly discuss networking options between the home network, VMs, and the Internet.
VirtualBox, which you use to run the virtual machine Kali, allows for a few networking schemes. These options are available when you configure any virtual machine, as shown in Figure 3-2.

Figure 3-2: VirtualBox networking options
Network Address Translation = Just Like Home
This is the default mode when building a new virtual machine. NAT is set by default, because normally you don't want the outside world connecting to your VM. In the same manner your home cable modem provides connectivity, NAT translates the internal (VM's) addressing space to the external (host's) connection.
And again like your home cable modem/router, there is added protection over a simple router. Your VM can connect to external addresses transparently, but a system outside cannot initiate a connection to the internal network. You have the option of forwarding a specific port (again, similarly with other NAT configurations). Then again, if you want complete connectivity, there is the Bridged mode option, which is described next.
Bridged = Outside World
You built a web server, and you want it reachable from the outside world. Here, you need Bridged mode. Bridged mode differs from NAT in that the outside system can initiate and reach an internal VM.
This means someone on your host system's subnet can initiate traffic and reach your virtual machines. Any security concerns with this? Absolutely. If you're in a coffee shop, library, or otherwise public subnet, you'll want to remember how your VM's network is configured, lest someone abuse a vulnerable server or tool-rich Kali install.
Internal = All Guests on Same Network
When you chose Internal Network mode, you're saying all the VMs can see each other. There is no connectivity to reach the host system.
If a VM is on a different network, then that too is unreachable. For example, let's say you have three machines on the 10.0.0.0/8 network and two machines on a 172.16.0.0/12 network. All of the network adapters are set as Internal. Therefore, the three systems in the 10.x.x.x space can talk to each other but not to the two systems in the 172.x.x.x space.
Host-only = A 1:1 Network, Guest, and Host
When you choose this network mode for a guest operating system's adapter, you permit the guest to communicate with the host, and that's all. So, let's say you're testing an application server running on the guest server. Your host could connect as a client. It's a small network of two systems.
Each of the network configurations has its purpose, depending on what you're setting up, what connectivity you need, and where you want the perimeter to be. From a Wireshark standpoint, it matters most what you want to capture and from where you'll capture.
Security
As previously mentioned, security professionals come from varied backgrounds. Any of you might specialize in an area. Those with strong networking backgrounds might have gravitated toward firewall management, intrusion detection, or security information and event management (SIEM). Those with coding expertise might now be exploit researchers or malware analysts. There are penetration testers and incident handlers who came from … who knows where! The point is, we don't expect you to know everything. And you can't expect us to skip a topic because it's too basic for you. Instead, we look through the lens of working with Wireshark and the rest of this book. We hope you'll bear with us.
The following is not a simple laundry list of terms and definitions. The following includes a few ideas that, as you read through, will help you see how Wireshark relates to each of them. Each concept is considered in the context of networking and protocol analysis.
The Security Triad
Confidentiality, integrity, and availability are the three aspects of information security. This triad comes up early and often in every textbook and certification course. Every security professional knows of the “C-I-A” triad or “A-I-C” triad.
If it is so well known, why bring it up now? What does it mean in the context of networking and packet analysis? It's about data confidentiality. This is a reminder of all the times you read or heard of the relative safety of information on a trusted, internal network. That relative safety is based on the assumption that no one would normally employ a network sniffer. So it goes almost without saying that Wireshark would be available only to personnel authorized to see virtually anything traveling over the network. And, obviously, Wireshark would be used only for circumstances requiring its use.
When it comes to confidentiality, keeping the data secret from prying eyes is the job of encryption. For as long as network traffic is encrypted, it's unintelligible to the person reading packets off the wire (or wireless). Unfortunately, that also means those packets are unintelligible to you. The packet headers still have value in terms of troubleshooting, but the packet data will be meaningless.
Intrusion Detection and Prevention Systems
Ever played with Snort? Snort is the open-source intrusion detection and prevention software that has been around forever. It is notoriously easy to set up—and notoriously difficult to apply well. Installing and configuring takes 5% of the work. The other 95% is the tuning or constant adjustments to separate the “wheat from the chaff.” If you are one of those security professionals who installs, manages, and tunes IDSs/IPSs, then you appreciate that your tuning never seems to end.
Briefly, the difference between intrusion detection and intrusion prevention is this: An intrusion detection system (IDS) only alerts that something bad was seen, while the intrusion prevention system (IPS) alerts and then responds to hopefully counter the problem. How does the IDS/IPS know when something is noteworthy? It detects one of two principle ways (or both). The two methods of detection are signature-based and anomaly-based.
Signature-based means it detects based on what it knows about. The IDS has a database of many signatures or patterns to watch out for. If any examined traffic matches the pattern or signature—boom, an alert! Anomaly-based, on the other hand, triggers because traffic looks suspiciously different compared to what's been normal to date. Either method is not failsafe. Any new service or system, whether legitimate or not, creates a new traffic baseline, which may in turn trigger the IDS as an “anomaly.”
What about Wireshark? Could it function as an IDS? You know the answer already. Yes, as a signature-based IDS, Wireshark will detect whatever you want to find in the packet contents. Or Wireshark could keep watch over a particular IP address, network, or service. In fact, if you can make a filter for it, Wireshark will let you know when that condition is met on the wire.
False Positives and False Negatives
In the earlier discussion about intrusion detection, we said the tuning of those systems never seems complete. That's because if you're not too busy getting rid of false alarms, you're in constant fear of missing something legitimately bad. Those two issues come together at the balance of tuning your intrusion detection.
False alarms and missed detection events are also called false positives and false negatives, respectively. The false positive is when a good event gets flagged as bad, while the false negative is when the bad event wasn't detected or wrongly detected.
Experience shows that this is one concept that most security professionals understand, but unless it is their daily job, the terms can get confused, so it's worth raising here just this once.
Malware
We're all used to the umbrella term malware. A catch-all term, malware represents viruses, worms, Trojans or remote access tools, and basically any other malicious code. In the old days, each of those categories meant specific behavior. For example, viruses would attach to other files and couldn't spread without human help, while worms spread unassisted. A Trojan horse was the application that hid itself, possibly including a backdoor or remote access. Rootkits, a special evil, hide within the operating system or firmware to avoid detection.
These days, malware takes on characteristics of several of the previous categories. Malware, waiting to start as a virus, might then launch a worm to further propagate, planting remote access tools as it spreads. It makes for a far more effective piece of malware, but that much tougher to defend against and recover from.
Where does this leave us in Wireshark? Wireshark simply reports what it sees on the wire. Unlike in a compromised operating system, a rootkit can't manipulate how Wireshark interprets data or restrict what Wireshark presents. Wireshark shows it as it sees it. (Of course, encryption can restrict what you interpret.)
For malware, if you know what to look for, you will find it in the capture or it's not there. The part “if you know what to look for” is the trick though, isn't it? In the context of intrusion detection, what we're talking about is the signature. For example, take a look at Figure 3-3, where some signature code is more than obvious.
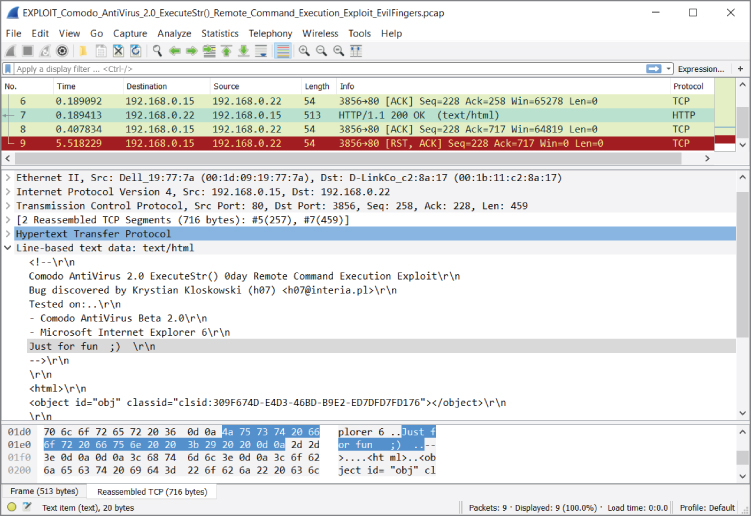
Figure 3-3: Malware signature code
The “knowing what to look for” might be a known string of text or ASCII, a peculiar source or destination port, calling “home” to a certain IP address range—all are example signs that would help you build the right display filter.
Spoofing and Poisoning
When I go to the grocery store, I sometimes set up a table in front of the deli and pretend I work there. I wear my apron and people just trust me because I say I'm the deli guy. When people want meat or cheese, I turn and grab it from the real deli counter. No one is the wiser, right?
That's what happens in spoofing or poisoning. An imposter gets in a position to intercept requests. Unsuspecting customers come with legitimate requests or are told in advance who to ask. The imposter, now acting as “man in the middle,” services the requests. What to do with those requests is up to the imposter.
The danger is obvious. The skill involved is minimal. With the plethora of tools available, complete with fool-proof GUIs, even the non-technical, disgruntled employee can spoof service requests for fun or profit.
What's the difference between spoofing and poisoning? Semantics really, but if anything, the order of events. Spoofing is answering a good request with a malicious response, while poisoning is sending out the bad information in advance. The intent of poisoning in advance is the redirect is then cached, saving the need to send a request to get intercepted.
What protocols become the deli counter? Two big, easy targets: Address Resolution Protocol (ARP) and Domain Name System (DNS). To refresh, ARP answers what layer 2 MAC address is associated with a known IP address. Similarly, DNS resolution answers what IP address associates to a known domain name (sampleURL.com or mailserver.corporate.com).
For both ARP and DNS, requests and replies happen without authentication, without validation, and far too often to watch over manually. For performance reasons, any new information is typically saved, even overwriting valid, nonexpired information. So, spoofing is far too easy. Thankfully, tools do exist to detect spoofing nearly as easily.
In Chapter 6 we use Wireshark to follow along the sequence and timing of the attacks and how to detect them.
Packet and Protocol Analysis
Earlier in the chapter, we rehashed the OSI model and its seven layers. Those layers, or levels of abstraction, then provide an example workflow, as data (a picture file) works through the layers, from the application to the wire. Even though the concepts should already be fairly familiar, the model itself stays fairly abstract until now.
With regard to protocol analysis, it is essential to keep your understanding sharp. For most security professionals, while the OSI model is well understood, it still remains abstract to most job tasks. As said in an earlier section, in Wireshark the OSI layers are clearly denoted by the packet details.
With respect to the OSI layers, it's then helpful to have a quick appreciation for how physically close (or distant) layers 2 and 3 are for the packets you're inspecting. Layer 2 is obviously the MAC address, while layer 3 is the IP address. And which part of this packet tells you where the capture was collected? Do you recall the workflow example earlier, when we highlighted the IP destination and source addresses, asking where the packet is ultimately going to and coming from? As a packet hops from router to router, IP addresses don't change. But with every hop, the MAC addresses do. And with every subsequent hop, the router will request to find out (or its cache already knows) which next MAC address will bring this packet closer to its final destination. So, keeping layers 2 and 3 addressing in mind, which one is more local, and which one is more global? Yes, the layer 2 address is just concerned with the local subnet, while the layer 3 addressing stays consistent from source to destination. The one exception being NAT, where, true to its name, the network addressing is translated or changed across that boundary.
A Protocol Analysis Story
When it comes to using Wireshark, you often use it to prove what the problem is not. Like when developers (or their managers) complain the network is intermittent. Or worse, when someone suspects the fault to be network RFC standards, as demonstrated by some newly developed application.
Typically, when a new application suggests a stable network is broken, the fault is likely not the network hardware, right? Tread lightly and be ready with Wireshark. Plus, here is an example of how important it is to gather as much information as you can first.
Let's say the application developers tell you they coded a new way to send “heartbeat” checks between cluster server nodes. They add you should be grateful because their packets are a record-thin size of just 30 bytes, saving valuable network bandwidth. (Wow, thanks!) But, they add, something's wrong and it seems your network is broken. The heartbeat packets are not traversing the network.
Because you're familiar with Ethernet enough to know layer 2 frames are typically a minimum 64 octets, you already have doubts about this bandwidth saver.
As a refresher, Ethernet frames at layer 2 include (with # of bits):
- A preamble (56 bits = 7 octets)
- A start frame delimiter (8 bits = 1 octet)
- A destination MAC address (48 bits = 6 octets)
- A source MAC address (48 bits = 6 octets)
- Length/Type field (16 bits = 2 octets)
- Stuff inside the layer 2 frame (remaining 46 to 1500 octets)
- Pad: zeros to fill if needed
- Frame Check Sequence or FCS (32 bits = 4 octets)
The Wireshark capture engine includes the information at layer 2. However, it picks up neither the preamble nor the FCS. For outbound frames, Wireshark gets it before the FCS is appended. For inbound frames, Wireshark gets the frame after the FCS is stripped off.
Going deeper down the rabbit hole, Wireshark picks up these frames differently, depending on whether they are leaving (outbound) or being received (inbound).
In Figure 3-4, the packet's size can be seen in a few places—under the length column in the Packet List pane and in the first subtree in the Packet Details pane.
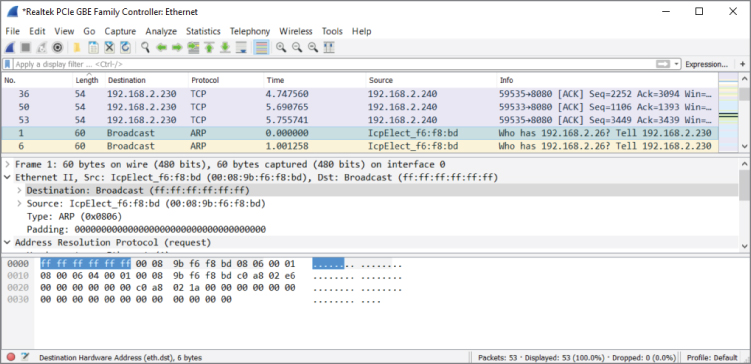
Figure 3-4: Small Incoming Layer 2 frame
For small incoming packets, an ARP request in this case and the data alone do not satisfy the minimum 64-byte size, so padding is added. Notice also the preamble and SFD are already stripped off. The destination MAC address bits (highlighted) are the first bits shown in the Packet Bytes pane. Given the Ethernet padding of 18 bytes, this frame is shown as “60 bytes on the wire.”
Compare that to Figure 3-5, where this outgoing packet is still smaller, “54 bytes on the wire.” How does that happen? For outbound frames, Wireshark gets it before the FCS is appended. And Wireshark picks it up before any padding is put on (to meet that frame length minimum).

Figure 3-5: Smaller outgoing Layer 2 frame
So, for this outgoing packet (a tiny TCP packet) Wireshark sees the length as only 54 octets. Padding is added before the frame goes on the wire. The FCS is calculated, and the frame is sent off.
Recalling CSMA/CD
We are still working through our protocol analysis story. But suddenly, something hits you from when you studied networking long ago, particularly about Ethernet technology. You remembered something called Carrier Sense Multiple Access / Collision Detection (CSMA/CD). Although CSMA/CD is buried in your memory, you remember it was about network cards negotiating so that bits on the wire do not bump into each other. Oh, by the way, Wireshark does not capture or present that auto-negotiation traffic, so no troubleshooting help there. But you recalled CSMA/CD, because when a frame is less than 64 octets long, the receiving network device assumes it to be just a fragment and evidence of a collision. Remember what is done with those fragments? They are discarded.
So, you have all the preliminary information you can gather, and you are armed with your knowledge and practice. Now is a good time to fire up Wireshark. Considering the size of the heartbeat packets, you feel they might not be considered valid when received on a machine, so you decide to run Wireshark on a system to capture the packets as they are sent out.
Sure enough, Wireshark sees the packets being sent out. Of course, the protocol is not understood by any dissectors (we discuss them later), but you see the tiny frames, complete with correct layer 2 information.
You confirm your suspicion by now capturing traffic along the way, and then on the machine, which should be receiving the heartbeat packets. But no, it isn't.
What's the solution for application developers? Insert enough padding into their homegrown packets. Zeros work fine, but they provide enough padding in order to increase the frame to the minimum Ethernet size of 64 octets (shown as 54 octets on the wire when you test again). Provided that the rest of the development works, the packet should continue along the network to its intended destination.
The Rare Smoking Gun
That previous example went pretty smoothly—maybe too smoothly, given the beginning hints.
You know already you can't count on real-life analysis flowing so linearly. You will naturally, like any person, have evolving notions of what's going on, what might be wrong, what to look for next, and what to disregard. As an analyst in any field with any investigative tool, your bigger challenge will be to keep track of what notions can safely be ruled out and where next to dig deeper.
Generally, experience pays off, but it can also introduce bias, which isn't so helpful. While you analyze traffic in Wireshark, your judgment can and will get challenged by what you see. When you are reading through packets, your own experience, knowledge, and biases greatly influence how you interpret the list of packets. This happens to both the person new to Wireshark and veteran packet analysts. The chief difference between a new analyst and the one with years of experience is that the experienced analyst does not expect to find the “smoking gun” without being distracted a few times by other discoveries. It's simply too rare to find the root of the problem quickly or to find it with just one capture, from one location.
See Figure 3-6 for an example. Wireshark captured a gratuitous ARP packet. A gratuitous ARP packet may be an ARP request or ARP reply. After our talk about ARP spoofing, seeing a gratuitous ARP should likely draw suspicion. And let's say you saw this plus other packets like it in a trace while investigating the legitimate service repeatedly offline. Maybe this packet appears to be the smoking gun, but, in most networks, gratuitous ARPs come from a list of reasons. For example, a cluster node changes IPs, a desktop discovers a duplicate IP, or even when workstations reboot, informing everyone that MAC is back up.

Figure 3-6: Gratuitous ARP
It's more common to need traffic captured from a few different spots in the network, especially when diagnosing problems related to connectivity, performance, or other problems you can't categorize until you dig into them. Imagine clients having trouble with an application server. They ask you to investigate. Just in the early question-and-answer session, you learn there is a web front-end, a middle-tier, and a back-end database server. Where is the problem? Yup, you'll likely be launching Wireshark in a few spots.
Ports and Protocols
Moving up the networking stack, you come to the transport layer. Perhaps the most well-known parts of the transport layer are the well-known port numbers and the two popular protocols that service them. A few words about these and how they relate in Wireshark will be helpful.
TCP and UDP
Both TCP and UDP are used to relay messages, rely on a source port and destination port (creating a socket at that instance), and perform some level of error checking. Apart from that, the two message protocols are very different.
Do you remember some of those key differences?
- TCP first creates a connection before any message is sent, whereas UDP does not.
- UDP is much faster, light weight, and doesn't care if the packet reaches its destination.
- While both do error checking by checksums, UDP won't recover from one. TCP includes error recovery, thanks to acknowledgments.
Before sending any actual data, TCP first establishes a connection. The famous three-way (three packet) handshake is shown in Figure 3-7.
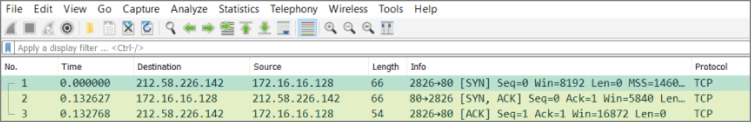
Figure 3-7: TCP's 3-way handshake
As shown in Figure 3-7, TCP is connection-oriented and will first establish by 3-way handshake a connection between the two systems: a SYN there, a SYN-ACK in response, then an ACK to confirm. Only after the 3-way handshake is confirmed is a message packet sent or streamed across many packets to follow. (By the way, did you notice the 3-way handshake in the chapter's first figure, 3-1?)
TCP is used when a service requires reliability, error checking, and recovery, flow control, and sequenced packets. UDP is just “best effort”—fire and forget. Basically, every application or service makes use of just one or the other, TCP or UDP.
A big exception to using only TCP or UDP is the protocol DNS. DNS regularly uses both, according to needs of performance versus reliability. When it comes to DNS queries (Where's that server? Where's that website?), the query is sent fast and furious by UDP. If no answer after a few seconds, it sends it again. No need to bother with 3-way handshakes with so many queries to follow. But, databases need to stay accurate and do so with confidence. That reliability justifies the cost of TCP. That's what makes DNS packet captures fun to follow, seeing stuff fly around over port 53/udp and 53/tcp, which leads to the next section.
Well-Known Ports
If the TCP protocol is the message, then the port number is the mail slot where the message goes. The kind of message being delivered is what determines to which port to send the message.
Got a DNS query about a website? That's UDP port 53.
Data request to the HTTP server? That's TCP port 80.
Logging in to your bank's webserver? That's TCP port 443.
Fetching your webmail? That's TCP port 110. Sending? TCP port 25.
In short, for any system with services running, the common understanding is to connect to that system at the expected port number. These ports are so expected and widely established, they are called the well-known ports. The port number is written as “TCP port 80” or as “80/tcp”—both standard ways to denote the same thing.
If anyone's security mind is questioning, “This makes the service so well known and vulnerable?” No, it must be available for use. You harden the service, right? There's no security through obscurity. If, for example, you configured your DNS server to listen on port 118 instead of 53, then everyone's queries would end at a closed 53/udp, to be left unanswered. (And, maybe SQL databases would feel less special.)
Well-known ports include those from port 0 to 1024. From 1025 to 49151, they are called registered ports, then dynamic from port 49152 onward. We are really only concerned with well-known ports, and those on the server or listening side. Rather than list the hundreds or thousands of port numbers and associated services here, please feel free to search online for “well-known ports” to find many available lists.
Wireshark obviously knows the well-known ports and associates protocols by name against the port numbers seen in packets. So, when a packet is captured with destination port 80, Wireshark will present it in the Packet List pane with “HTTP” in the protocol column. This is the default configuration, but it isn't fixed or locked that way. Under Preferences, Wireshark can be told not to automatically resolve those protocols by port number and/or told which specific port numbers to assign to a protocol—certainly something to change if your company's internal application uses the same registered port as a famous piece of malware.
Summary
We've touched on a variety of topics, across security, networking, and protocol analysis. We supplemented the topics with a few example stories, scenarios, and a few problems solved. With regard to networking, we highlighted the OSI model. (Can't publish a book without it.) The OSI model is used in separating the subtrees in Wireshark's Packet Details pane. Also regarding networking, the various network options for virtual machines were described.
A few topics of security were covered with regard to Wireshark, including confidentiality and the way Wireshark can lend itself as an intrusion detection system or malware hunter. Also discussed were spoofing and poisoning, in preparation for a future exercise.
Lastly, we covered a few items regarding protocol analysis. After walking through an example of analyzing a problem, it was cautioned that Wireshark only rarely finds the “smoking gun” so quickly. Other basic essentials covered included a few well-known ports and differences between layer 4 protocols TCP and UDP.
In Chapter 4, we deep dive into capturing, recording, and storing network traces.
Exercises
- Open Wireshark and start a capture. Browse anywhere in your web browser. Stop the capture. Can you find the 3-way handshake?
- Set up two virtual machines in VirtualBox, with their adapters set to Host-only mode. Ensure IP addresses are on the same subnet. Can you ping between them? Can each ping the host?
- Prepare the same two virtual machines, but with adapters set to Internal mode (and same network name). Can they ping each other now? Or the host? Bonus: If you ran Wireshark on your host, would you see any traffic between the VMs?