
Chapter 7
Decrypting TLS, Capturing USB, Keyloggers, and Network Graphing
In this chapter, we visit a few other features of Wireshark. We start by walking through how to decrypt SSL/TLS. Encrypted traffic provides little insight into the data, apart from routing information, so this task can be useful for inspecting suspect activity. The next topic focuses on sniffing USB traffic. The reasons for capturing traffic over a USB port ranges from troubleshooting a USB-specific problem to forensic analysis. We show how to perform USB captures on both Linux and Windows, and then demonstrate how Wireshark can analyze the capture as you would a network capture, and even how to write a simple keylogger using TShark.
Decrypting SSL/TLS
When an analyst or researcher performs network packet captures, encrypted traffic can quickly become blinding and hide the inner workings of a connection. Once again, however, Wireshark has you covered. Wireshark comes with built-in support for some of the most common encrypted protocols you will likely encounter on modern networks. We go over decrypting SSL/TLS, which is by far one of the most common encrypted network protocols today.
You use SSL/TLS every time you browse to an HTTPS site. The protocol started its life as Secure Sockets Layer (SSL) but was later renamed to Transport Layer Security (TLS) after modifying the protocol and fixing issues with the original SSL protocol. People often use SSL and TLS interchangeably. Current versions of SSL are considered insecure and should be replaced with TLS. And during a packet capture, while the Wireshark dissector may correctly interpret the protocol as TLS, certain dialog boxes might still refer to the protocol as SSL, as we will see later in the chapter.
The TLS protocol supports various cipher suites, or means of encryption. This is deciding dynamically between the client and the server based on what either end supports. The inner workings of TLS can get rather complex. An entire chapter (even a book!) could be written on the details of the TLS protocols and the various nuisances regarding the security it provides. Instead, we are going to try and take a nice, high-level view of how TLS works, and then work through a practical example of how to perform TLS decryption with Wireshark. TLS is considered a hybrid cryptosystem in that it utilizes both symmetric and asymmetric encryption.
Symmetric encryption is what you think of when you hear encryption. It means that a single key gets used for both decryption and encryption. The issue with symmetric encryption is that you have a secret key that has to be shared. Of course, it's very difficult to securely share a key on an insecure network such as the public network.
Asymmetric encryption helps to solve this problem. With asymmetric encryption, there is both a private and a public key. Anything encrypted with the private key can only be decrypted with the public key, and vice versa; anything encrypted with the public key can only be decrypted by the private key. So, to securely share a key, the client can encrypt a key with the server's public key. This way, the only person who can decrypt this message is the server that has their own private key. The server then uses this passed-on key to perform symmetric encryption of the transmitted data. You may be wondering why we don't just use asymmetric encryption during the whole process. The reason is that symmetric encryption generally provides better security and, more importantly, is much faster than asymmetric encryption.
Decrypting SSL/TLS Using Private Keys
Now that you have a basic understanding of TLS, let's look at how to decrypt the traffic. We know that the key will be encrypted with the public key of the server (the web server in the case of HTTP). Therefore, you need to access the private key from the server to figure out the symmetric encryption key to actually decrypt the application data. If you don't have the lab started, fire it up and start Wireshark on the host machine listening on the w4sp_lab interface. Once the lab is up and Wireshark is capturing packets, browse to https://ftp1.labs (see Figure 7-1). If you get a certificate error, click that you understand the risk and add an exception, and then check the box to permanently store the exception.
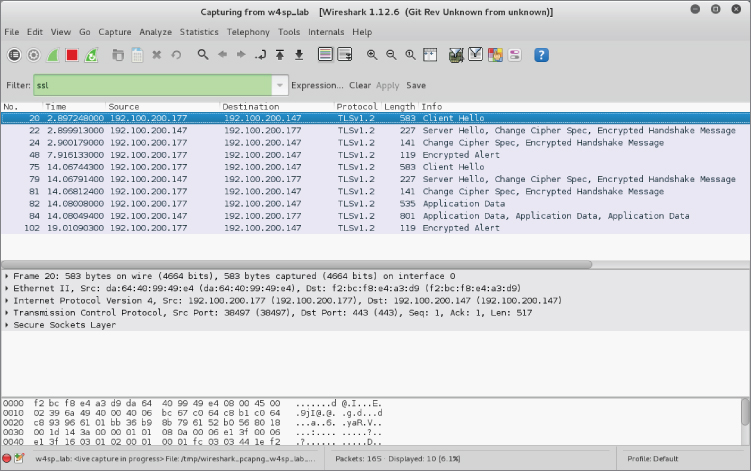
Figure 7-1: Browsing to ftp1.labs
If you type ssl into the filter window, you should be able to quickly drill into the HTTPS traffic that you just generated. The word “ssl” must be typed in the filter, even though Wireshark correctly recognizes the traffic as TLS. If you right-click on a packet and click Follow TCP Stream, you see that it is mostly a bunch of garbage (see Figure 7-2). As mentioned earlier, you need the ftp1.labs private key. This is provided within the w4sp_lab/images/ftp_tel/ directory and is named apache.key.

Figure 7-2: Follow TCP stream on SSL/TLS traffic
To use apache.key to decrypt the SSL/TLS traffic, you have to tell Wireshark where the key is located, as well as which traffic can be decrypted using that key.
Return back to the Wireshark GUI. Click Edit and select Preferences, and then expand the Protocols section. Then type ssl anywhere while the Preferences window is active to see the SSL protocol options (see Figure 7-3). Note that Wireshark, as an application, uses the acronym SSL, but as mentioned earlier, the protocol has been replaced by TLS.

Figure 7-3: Wireshark SSL/TLS protocol options
From here, click Edit for the RSA keys list, and select New, which opens another small window. The first box to fill out on this new window is the IP address. This will be the IP address of the TLS server—the ftp1.labs HTTPS server in this case. For the lab instance used for these figures, the IP address of the ftp1.labs server was 192.100.200.147. Keep in mind that your ftp1.labs server may have a different IP address, so make sure to double-check and use the correct IP address. The next box to fill in is the port. This is easy, because it is TCP port 443, the standard default port for HTTPS. The next box is for the Protocol. This tells Wireshark what kind of data is being encrypted with the TLS stream. You are using an HTTPS server, so the underlying protocol is going to be HTTP. The next option is for the key file. Clicking this opens a file dialog that allows you to pick the TLS server private key. Again, you want to select the apache.key file located in the w4sp_lab/images/ftp_tel directory (see Figure 7-4). The last box is for encrypted private keys and is where you would place the password to decrypt this file. In our example, the private key is not encrypted, so you can leave this blank.

Figure 7-4: Setting up SSL/TLS decryption
With all this information filled out, you can start clicking the OK buttons to start closing out all the preference windows, leading you back to the main Wireshark UI. At this point, you should note that the packet list refreshed and you can now see some HTTP traffic in Wireshark. If, for some reason, you don't see any HTTP traffic, double-check that you have captured the Client and Server Hello, as well as a Client Key Exchange SSL/TLS packet. Try refreshing the page a few times or closing out of the browser and opening the https://ftp1.labs page to make sure you capture the full SSL/TLS handshake. To further test decryption, you can right-click a TLS packet in Wireshark and select the Follow SSL Stream option (see Figure 7-5). This should now open a window similar to what you see when you select Follow TCP Stream, and should be showing the decrypted HTTP traffic to the ftps1.labs site.

Figure 7-5: Decrypting TLS traffic in Wireshark
Decrypting SSL/TLS Using Session Keys
The previous section walked through how to decrypt TLS traffic using Wireshark. Unfortunately, this can't be reproduced on the web server in the lab environment. The lab environment is actually configured to block secure TLS protocols, in particular, on the ftp1.labs web server. The ftp1.labs server has the Diffie-Helman (DH) key exchange protocol explicitly disabled.
The DH algorithm is disabled because it actually makes decryption much trickier, because DH works very much like the asymmetric encryption we talked about earlier. The difference is that with DH, even an attacker that has captured the session key exchange and has access to the server's private key is not able to get at the session keys. This feature, whereby even the compromise of the private key doesn't compromise all the session key exchanges, is referred to as Perfect Forward Secrecy (PFS). The good news for anyone relying on TLS when doing shopping or banking is that DH is more and more common, and browsers, by default, try to negotiate the strongest TLS algorithms the web server supports. This is bad news, though, for attacks or network forensic people. If the client and server use DH key exchange, then compromising the server's private key doesn't help us.
All is not lost, however. Just because you are not able to decrypt the session key exchange doesn't mean you can't get to the session keys themselves. Remember, asymmetric encryption is just used to protect the session keys in transit, and that actual application data encryption is done using the session keys. If a client and server are using DH, this means you have to find another way to get access to these session keys. There are various ways to get access to session keys. They are often application specific and just require a little creativity. For us, though, we are just going to leverage built-in web browser debug functionality to demonstrate how to decrypt a TLS stream using session keys instead of the web server's private key.
When dealing with TLS, developers often need to be able to decrypt TLS streams. To this end, most web browsers support the ability to log out the session keys used for TLS encryption. You can enable this functionality by creating an environment variable called SSLKEYLOGFILE. An environment variable is exactly what it sounds like; it is just a variable that is accessible to any application running within the operating system's environment. Each operating system sets different environment variables, so you will need to do some research, depending on the operating system for which you want to set environment variables. For Linux, the process of setting a temporary environment variable is to open a terminal and type
root@w4sp-kali:~# export SSLKEYLOGFILE='/root/session.log'
After setting the environment variable, launch the browser Iceweasel, which is the Firefox equivalent on Kali.
Be sure to launch Iceweasel from the same terminal so that it picks up your newly added environment variable.
root@w4sp-kali:~# iceweasel
This should launch the web browser. Browse to a website secured with TLS (https://wikipedia.org is a good example). After some secure browsing, you should be able to see the session.log file in the /root directory. The following is the output from the session.log file after browsing to some secured sites.
root@w4sp-kali:~# cat session.log
# SSL/TLS secrets log file, generated by NSS
CLIENT_RANDOM 1688068b367700c719e838d1baf25fac55a7ef3ca05a378f8f72959
72e86d9c4af39975ee5e8d952eb586acf9a4d2b6eab8da6d1945a7289b8635ee17941
8d0269a7d439770b01487b96e7bd5081f787
CLIENT_RANDOM 8641caefc8229bee3cb5a864805cf117cb96f40bfa33ae4e2fd9332
823bb9391d2ee10693d96a3d4c69503413fba08de3b14d079c72ab6daf33c4032deef
994a08a90affd3bea4f6728a6505fdaf1059
CLIENT_RANDOM 7d40e7ef3cf1a29cf888c86c4a871332fc3493bf0958a174bddb5d8
f63d491a8bf784a80dcfde1c9d4db67648e817704c8a1a5d3e3c9fce63a4f7988c2a9
c8b70e43b24d367250541887b419882e16fb
CLIENT_RANDOM ea23d54e2f28fca9ddf434472a98e96124192b575c46c160dd1a72a
c0b99e39a0f8dbe392d65efa8e719c7bc7ed0fe33288109659a0e4d38327759fd95c5
aaf03bb36d214651e38ab072f42c0dfd2a4b
CLIENT_RANDOM 7bec7ca91a9635c34cc02caa5603a83321e0ea1e343a0256c882ffc
8b7c0dd38afd9f3a990b8f6b231c4a12787f0654bd76f7f58e637f9fbea3dc23145f4
2a5bd48598821b32f54af3d85e32d59628ed
This output of session keys can now be easily parsed by Wireshark for decryption. You need to go back and edit the SSL protocol preferences by clicking Edit, then Protocols and SSL. From that window, select Browse for the (Pre)-Master-Secret log filename. Select whatever log file you set the SSLKEYLOGFILE environment variable to. In this case, this was the /root/session.log file (see Figure 7-6).

Figure 7-6: Adding SSLKEYLOGFILE
With Wireshark configured to use the log file, you can go back to the main packet list and drill into the SSL/TLS traffic. If you right-click on an SSL/TLS packet now and select Follow SSL Stream, you can see the decrypted traffic. You may also notice an additional tab appears for Application Data SSL/TLS packets that also show you the decrypted contents. You probably noticed that the decrypted data doesn't immediately look like HTTP traffic. The reason for this is that Wireshark is strictly decrypting the TLS traffic and is not applying any additional protocol dissector to the data (see Figure 7-7).

Figure 7-7: Decrypted SSL/TLS data
USB and Wireshark
When you think about USB debugging, you usually don't think about Wireshark. But Wireshark is able to both capture (on Linux) and dissect/decode USB traffic, which makes it a handy tool. In this section, we go over some basics of the USB protocol and how to capture USB traffic on both Linux and Windows machines. Then we walk through how to create a simple keylogger using TShark and a Lua script. If you don't have one handy, start scouring around for a USB keyboard. You are going to need one to build your keylogger.
At a high level, USB is a bus with multiple devices connected and can actually be thought of like an Ethernet hub, where all packets are sent to all devices connected on the bus but only those devices to which the USB packet is destined are going to respond. Each device on the bus can have a number of endpoints (see Figure 7-8). These endpoints determine the direction of the traffic, either coming into the device or going out of the device, as well as how the data is transferred, such as in bulk, all at once, or in small chunks, as the host asks for data from the endpoint.
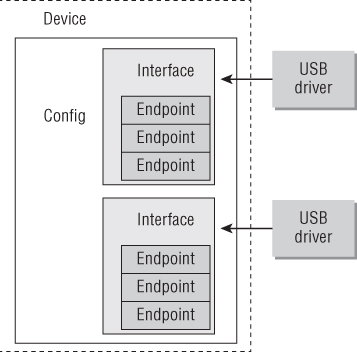
Figure 7-8: USB device overview
Capturing USB Traffic on Linux
We start with capturing on Linux, as live capture is supported using the usbmon kernel facility. Usbmon effectively allows for packet capture on a USB bus and was mainlined into the Linux kernel starting with 2.6.11, so it should be available on pretty much any modern Linux installation. Let's look at how to use the usbmon functionality in Kali. The first step is to load the usbmon driver. This is accomplished by running the modprobe command, as shown in the following snippet:
root@w4sp-kali:~# modprobe usbmon
root@w4sp-kali:~# lsmod | grep usbmon
usbmon                 28672  0
usbcore               200704  6 ohci_hcd,ohci_pci,ehci_hcd,ehci_pci,
usbhid,usbmon
We run lsmod to list all the loaded drivers (modules), and we use grep to search for the usbmon string to verify that the driver is indeed loaded. Keep in mind that you need to be running as root to be able to load the usbmon module. If you fire up Wireshark, you will see that there are now usbmon x interfaces, with the x corresponding to a USB device (see Figure 7-9).

Figure 7-9: usbmon interfaces
Okay, you have usbmon interfaces, but how do you figure out which interface corresponds to which actual physical USB device? You can start by using the lsusb command, which lists the available USB devices on the system. If you are running Kali in a VirtualBox virtual machine (VM) without any other USB devices, you should see something similar to the following snippet:
root@w4sp-kali:~# lsusb
Bus 001 Device 001: ID 1d6b:0002 Linux Foundation 2.0 root hub
Bus 002 Device 002: ID 80ee:0021 VirtualBox USB Tablet
Bus 002 Device 001: ID 1d6b:0001 Linux Foundation 1.1 root hub
This tells you that there are two USB hubs: one for USB 1.1 and another for USB 2.0. You also see that there is a VirtualBox USB Tablet connected on bus number 2. This is the virtual USB device that VirtualBox uses to provide mouse input to the VM. Before you start checking out some USB traffic, go ahead and work out how to connect a USB device to your VM. Using VirtualBox, this is as easy as clicking Devices and then USB, and selecting the USB device connected to the host that you want to connect to the VM. In Figure 7-10, you can see that a Dell keyboard is being added to the Kali VM. You can disconnect the device by going to the same menu and selecting the device again.

Figure 7-10: Connecting USB device to Kali VM
Now that you know how to connect a USB device, run lsusb again to see which hub your device is connected to:
root@w4sp-kali:~# lsusb
Bus 001 Device 001: ID 1d6b:0002 Linux Foundation 2.0 root hub
Bus 002 Device 004: ID 413c:2107 Dell Computer Corp.
Bus 002 Device 002: ID 80ee:0021 VirtualBox USB Tablet
Bus 002 Device 001: ID 1d6b:0001 Linux Foundation 1.1 root hub
You can see that we have a new Dell device, number 4, that is attached to bus number 2.
Let's fire up Wireshark now and see if we can check out some USB traffic. You know that our device should be on bus 2, so we will start capturing on usbmon2. Keep in mind that this may be different on your machine and that you need to verify which bus your USB device ends up connecting to. If you are running Wireshark as root, you are not going to have any problems performing a capture. However, if you are playing it safe and not running Wireshark, you may run into an error message, as shown in Figure 7-11.
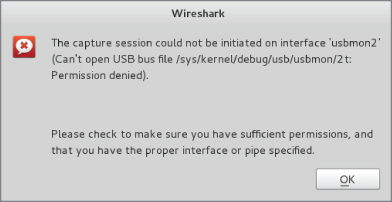
Figure 7-11: Wireshark usbmon error
This error tells us that we don't have permissions to read from the usbmon2 interface. To fix this error, we have to change permissions on the usbmon device, so that our low-privilege user can read from it. It is very important to remember that this will now allow low-privilege users the ability to sniff all the USB traffic going across this particular bus. Depending on your system, this can leave open a huge security hole. You can change permissions by running the following command:
root@w4sp-kali:/home/w4sp# chmod 644 /dev/usbmon2
You should now be able to capture on usbmon2 as a low-privilege user. The easiest way to ensure that this functionality isn't abused is to ensure that, when you are done sniffing USB traffic, you unload the usbmon driver by typing the following command:
root@w4sp-kali:/home/w4sp# rmmod usbmon
Removing the usbmon driver ensures that the usbmon interfaces are not accessible. With permissions set, or you running as root, select the appropriate usbmon interface. You should be able to see traffic similar to that in Figure 7-12. If you type a key into the USB attached keyboard, you should see additional traffic being generated.

Figure 7-12: Capturing on usbmon2
Now you can go about performing analysis on the USB traffic, even saving the packets out to pcap for later analysis. Before we get into playing around with the USB traffic, let's go over how to capture traffic in Windows.
Capturing USB Traffic on Windows
Unlike Linux, Windows does not have a built-in functionality to sniff USB traffic. Capturing USB traffic on Windows requires third-party software. Recent releases of the Windows Wireshark installer come bundled with USBPcap, a third-party utility for sniffing USB traffic. You should already have this installed if you followed the Wireshark installation instructions for Windows. If not, you can always download the latest version of USBPcap from http://desowin.org/usbpcap/. USBPcap is a command-line tool, so you run it from the Windows command prompt. USBPcap needs administrator privileges, so make sure you select Run as Administrator when opening a command prompt to run USBPcap. After opening an Adminstrator command prompt, you will change directories to the USBPcap installation directory, which, by default, is located at C:Program FilesUSBPcap. The following sample output shows how to run and display the USBPcap help:
Microsoft Windows [Version 6.1.7601]
Copyright (c) 2009 Microsoft Corporation.  All rights reserved.

C:WINDOWSsystem32>cd C:Program FilesUSBPcap

C:Program FilesUSBPcap>USBPcapCMD.exe -h

C:Program FilesUSBPcap>Usage: USBPcapCMD.exe [options]
  -h, -?, --help
    Prints this help.
  -d <device>, --device <device>
    USBPcap control device to open. Example: -d \.USBPcap1.
  -o <file>, --output <file>
    Output .pcap file name.
  -s <len>, --snaplen <len>
    Sets snapshot length.
  -b <len>, --bufferlen <len>
    Sets internal capture buffer length. Valid range <4096,134217728>.
  -A, --capture-from-all-devices
    Captures data from all devices connected to selected Root Hub.
  --devices <list>
    Captures data only from devices with addresses present in list.
    List is comma separated list of values. Example --devices 1,2,3.
  -I,  --init-non-standard-hwids
    Initializes NonStandardHWIDs registry key used by USBPcapDriver.
    This registry key is needed for USB 3.0 capture.
To get a list of available devices, run the USBPcapCMD.exe command without any arguments. This brings up another command prompt that lists the available devices and asks which one you want to start capturing on. Figure 7-13 shows the USBPcap window running on a Windows 7 VM. You can see there are two buses, with a mouse (VirtualBox virtual pointer) and a smart card device connected to bus 1 named \.USBPcap1.

Figure 7-13: USBPcap device list
Number 1, the USB bus, is selected as the filter control device to sniff on. After selecting which device to sniff from, USBPcap then asks for an output filename. This file will be the output pcap. You are free to provide any name you want. As shown in Figure 7-14, we provided the filename w4sp_usb.pcap.
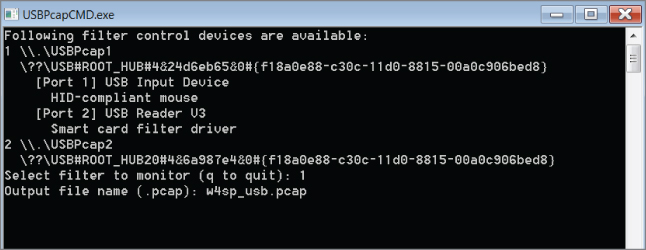
Figure 7-14: USBPcap running a capture
Only after you press Enter does USBPcap start capturing USB traffic. Notice, however, that USBPcap doesn't show any visual indication of what it is doing. Figure 7-14 shows USBPcap performing a packet capture.
Pressing Ctrl+C stops the capture, and the USBPcap window closes. The file is saved in the working directory of USBPcap, so we should now have a pcap file located at C:Program FilesUSBPcapw4sp_usb.pcap. When you open the file in Wireshark, you should be able to see USB traffic.
TShark Keylogger
Now that you know how to capture USB traffic from both Windows and Linux, let's discuss how to use Lua to turn TShark into a keylogger. To start, we need to figure out what our key presses look like. To do this, we again connect a USB keyboard to our Kali VM and sniff in Wireshark to see what kinds of packets are sent on a key press. Not being an expert on the USB protocol, analysis might start by pressing just the keys ABC and examining the traffic as a result.
Pressing three keys resulted in 12 USB packets being generated. Perhaps that means that four packets are sent per key press. We know that the keyboard is going to be sending to the host, so that is going to be the information we are most interested in. We can therefore limit some of the packets we have to analyze by using the usb.dst == "host" display filter so that we see only packets from USB devices going to the USB host (see Figure 7-15).

Figure 7-15: Filtering USB traffic to host
If you scroll through the packets now and look at the Leftover Capture Data, you can see that it contains either a few zeros and a single number or all zeros. If you look at the number, you may notice that it increases, starting at 4 and going up to 6. At this point, it is probably reasonable to assume that these are the key presses. You can verify this by pressing A again and checking to see if some data is going to the host with the number 4. The problem we have now is that this isn't an ASCII code, as A should map to 0x61. One way to figure out which keys are which is by pressing every key on the keyboard and recording the response. While this might sound like it would be a lot of fun, that would be cruel. It turns out that USB defines a standard for input devices such as mice, joysticks, and keyboards. These devices should all be following the USB Human Interface Device (HID) class specification. To save you some time reading the specification, it turns out that they define key codes, which tells how the USB key codes map to the actual keys on the keyboard. Figure 7-16 shows a snippet of the key codes from the HID standard, which verifies that we are correct in that 0x04 maps to ‘a’ or ‘A.’
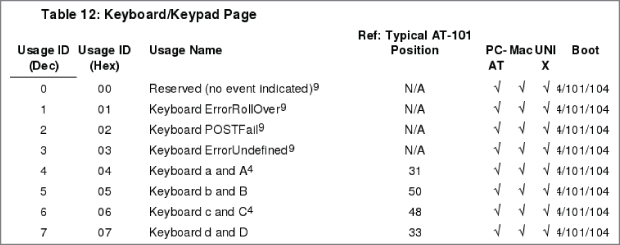
Figure 7-16: HID key codes
At this point, we have enough information to start building our keylogger. The first thing we want to do is define our fields. In our case, all we are concerned with is usb.capdata, which is the data payload for the USB packets parsed by Wireshark. With our field defined, we can define our init_listener function and create our Listener/tap. We will want our Listener to only process USB packets.
--we want to capture usb data for each packet
    local usbdata = Field.new("usb.capdata")

    --the listener function, will create our tap
    local function init_listener()
        print("[*] Started KeySniffing…
")

        --only listen for usb packets
        local tap = Listener.new("usb")
Now, we will define the Listener's packet function, which is the bulk of our processing. Here, we will verify that we have the USB data and then process it to determine the key that was pressed. The data we get will be in the form of %x:%x:%x:%x, with %x being a hex number. By looking at this data, it is readily apparent that the key pressed will be the third hex number. So, to get this, we “split” the USB data on the ':' field. This gives us an ordered table of hex bytes. Then we can pull out the third item in the table, allowing us to map this hex byte to the corresponding keyboard key press and print it to the screen.
--called for every packet meeting the filter set
for the Listener(), so usb packets
        function tap.packet(pinfo, tvb)

            --list from http://www.usb.org/developers/
devclass_docs/Hut1_11.pdf
            local keys = "????abcdefghijklmnopqrstuvwxyz1234567890

??	 -=[]\?;??,./"
            --get the usb.capdata
            local data = usbdata()

            --make sure the packet actually has a usb.capdata field
            if data ~= nil then
                local keycodes = {}
                local i = 0

                --match on everything that is a hex byte %x and add it to the table
                --this works b/c data is in format %x:%x:%x:%x
                --it is effectively pythons split(':') function
                for v in string.gmatch(tostring(data), "%x+") do
                    i = i + 1
                    keycodes[i] = v
                end

                --make sure we got a keypress, which is the 3rd value
                --this works on a table b/c we are using int key values
                if #keycodes < 3 then
                    return
                end

                --convert the hex key to decimal
                local code = tonumber(keycodes[3], 16) + 1
                --get the right key mapping
                local key = keys:sub(code, code)

                --as long as it isn't '?' lets print it to stdout
                if key ~= '?' then
                    io.write(key)
                    io.flush()
                end
            end
        end
Because we are printing the keys as we go along, we don't need to put any functionality in the Listener.draw() function:
--this is called when capture is reset
        function tap.reset()
            print("[*] Done Capturing")
        end

        --function called at the end of tshark run
        function tap.draw()
            print("

[*] Done Processing")
        end
    end

    init_listener()
Save this code as keysniffer.lua. Let's take a crack at running it on our Kali VM and try pressing some keys on our USB keyboard. You will want to make sure you switch out from the terminal window so that any key presses you make don't go to that window. You should get something similar to Figure 7-17.

Figure 7-17: TShark key sniffer
Graphing the Network
Wireshark comes with some graphing capabilities and has a whole slew of options under the statistics section from the main screen. These are generally geared, however, toward network troubleshooting and fine-grained analysis.
Penetration testers often find themselves sitting on unfamiliar networks with the need to quickly determine what the network looks like. Other security professionals might also need to analyze connections being made from a packet capture sample.
We naturally understand a foreign network more quickly if given a visual representation. And a graphic network diagram easily paints the “big picture,” if you pardon the metaphor. As such, graphs can be an excellent way to quickly consume information and determine the connection between various machines. Pentesters have a number of tools to accomplish this, but we can at least demonstrate how to add Wireshark to that list of tools.
To map out a network, there is one striking difference to using Wireshark as opposed to more common tools. With Wireshark, you know the network is being represented by actual traffic, not from a storm of probes or ping packets. Using Wireshark, your network map shows the active devices, not latent devices or honeypots (enticing hosts, available only to those who search them out). While seeing only active devices might not be a complete picture, some professionals might find it more representative of the actual working network.
Lua with Graphviz Library
This will again be an early session with Lua, the script language. To accomplish this network mapping with Wireshark, we move from the graphical user interface of Wireshark and instead use the command-line interface TShark, along with Lua and the open source Graphviz visualization library. Apart from this script, the book saves the majority of Lua work for Chapter 8.
We want to be able to visualize the connections being made between machines. This can give us insight into various patterns, such as which machines may be infected, which servers are domain controllers, and so on. We can use TShark to work out the various connections between machines, and then use the Graphviz library for Lua to render it into a nice graph showing the connected nodes. First, we need to figure out which fields from the packet we are going to be interested in. The most obvious ones are the source and destination IP addresses. These will be our nodes. Then we can use both TCP and UDP port numbers as a way of determining the connections between these nodes. The connections between nodes are generally referred to as edges. The algorithm we are going to use is that for each TCP stream we want to pull the source and destination IP addresses and the corresponding port numbers. Then, in our tap.draw() function, we connect each node. The nice thing about the Graphviz library is that it can output to various formats. Because we are going to be using tooltips and other features, we are going to stick with SVG format for this example. SVG is also handy in that it can be embedded in a web page. In fact, we will use the Kali Iceweasel browser to view our SVG graph generated by TShark and Lua.
The following code shows the graphing solution:
do

    local gv = require("gv")

    --helper function for to check if element is in table
    --http://stackoverflow.com/questions/2282444/
how-to-check-if-a-table-contains-an-element-in-lua
    function table.contains(table, element)
        for _, value in pairs(table) do
            if value == element then
                return true
            end
        end
        return false

    --end of table.contains function
    end

    -- we want the src of the arp packet (remember arp doesn't
 have an IP header)
    local tcp_stream = Field.new("tcp.stream")

    --get the eth and ip src so we can map them
    local eth_src = Field.new("eth.src")

    local ip = Field.new("ip")
    local ip_src = Field.new("ip.src")
    local ip_dst = Field.new("ip.dst")

    --we can do basic service analysis
    local tcp = Field.new("tcp")
    local tcp_src = Field.new("tcp.srcport")
    local tcp_dst = Field.new("tcp.dstport")

    local udp = Field.new("udp")
    local udp_src = Field.new("udp.srcport")
    local udp_dst = Field.new("udp.dstport")

    --{ STREAMIDX:
    --    {
    --        SRCIP: srcip,
    --        DSTIP: dstip,
    --        SRCP: srcport,
    --        DSTP: dstport,
    --        TCP: bool
    --    }
    --}


    streams = {}


    -- create our function to run that creates the listener
    local function init_listener()

        -- create our listener with no filter so we get all frames
        local tap = Listener.new(nil, nil)

        --called for every packet
        function tap.packet(pinfo, tvb, root)

            local tcpstream = tcp_stream()

            local udp = udp()
            local ip = ip()

            if tcpstream then

                --if we have already processed this stream then return
                if streams[tostring(tcpstream)] then
                    return
                end

                --calling tostring as we assume if there is a tcp stream we have an ip header
                local ipsrc = tostring(ip_src())
                local ipdst = tostring(ip_dst())

                local tcpsrc = tostring(tcp_src())
                local tcpdst = tostring(tcp_dst())

                --build out the stream info table
                local streaminfo = {}
                streaminfo["ipsrc"] = ipsrc
                streaminfo["ipdst"] = ipdst
                streaminfo["psrc"] = tcpsrc
                streaminfo["pdst"] = tcpdst
                streaminfo["istcp"] = true

                streams[tostring(tcpstream)] = streaminfo


            end


            if udp and ip then

                --calling tostring as we assume if there is a tcp stream we have an ip header
                local ipsrc = tostring(ip_src())
                local ipdst = tostring(ip_dst())

                local udpsrc = tostring(udp_src())
                local udpdst = tostring(udp_dst())

                --a 'udp stream' will just be a key that is the ip:port:ip:port
                local udp_streama = ipsrc .. udpsrc .. ipdst .. udpdst
                local udp_streamb = ipdst .. udpdst .. ipsrc .. udpsrc

                --we processed this 'stream' already
                if streams[udp_streama] or streams[udp_streamb] then
                    return
                end

                --build out the stream info table
                local streaminfo = {}
                streaminfo["ipsrc"] = ipsrc
                streaminfo["ipdst"] = ipdst
                streaminfo["psrc"] = udpsrc
                streaminfo["pdst"] = udpdst
                streaminfo["istcp"] = false

                streams[udp_streama] = streaminfo

            end

        --end of tap.packet()
        end

        -- just defining an empty tap.reset function
        function tap.reset()

        --end of tap.reset()
        end

        -- define the draw function to print out our created arp cache.
        function tap.draw()


            --create a graphviz unigraph
            G = gv.graph("wireviz.lua")

            for k,v in pairs(streams) do
                local streaminfo = streams[k]

                --create nodes for src and dst ip
                local tmp_s = gv.node(G, streaminfo["ipsrc"])
                local tmp_d = gv.node(G, streaminfo["ipdst"])

                --lets connect them up
                local tmp_e = gv.edge(tmp_s, tmp_d)
                gv.setv(tmp_s, "URL", "")
                local s_tltip = gv.getv(tmp_s, "tooltip")
                local d_tltip = gv.getv(tmp_d, "tooltip")

                gv.setv(tmp_s, "tooltip", s_tltip .. "
"
 .. streaminfo["psrc"])
                gv.setv(tmp_d, "tooltip", d_tltip .. "
"
 .. streaminfo["pdst"])

                if streaminfo["istcp"] then
                    gv.setv(tmp_e, "color", "red")

                else
                    gv.setv(tmp_e, "color", "green")

                end

            end

            --gv.setv(G, "concentrate", "true")
            gv.setv(G, "overlap", "scale")
            gv.setv(G, "splines", "true")
            gv.layout(G, "neato")
            gv.render(G, "svg")


        --end of tap.draw()
        end

    --end of init_listener()
    end

    -- call the init_listener function
    init_listener()


--end of everything
end
To run the script, run the following command, which generates an SVG file and saves it as w4sp_graph.svg. Notice that we are sniffing on the w4sp_lab interface. This script can also run against a packet capture by using the -r switch.
w4sp@w4sp-kali:~$ w4sp_tshark -q -X lua_script:wireviz.lua
 -i w4sp_lab > w4sp_graph.svg
Capturing on 'w4sp_lab'
^C143 packets captured
Once the SVG file is open, you can view it in Iceweasel by running the following command:
w4sp@w4sp-kali:~$ iceweasel w4sp_graph.svg
You should see something like in Figure 7-18.
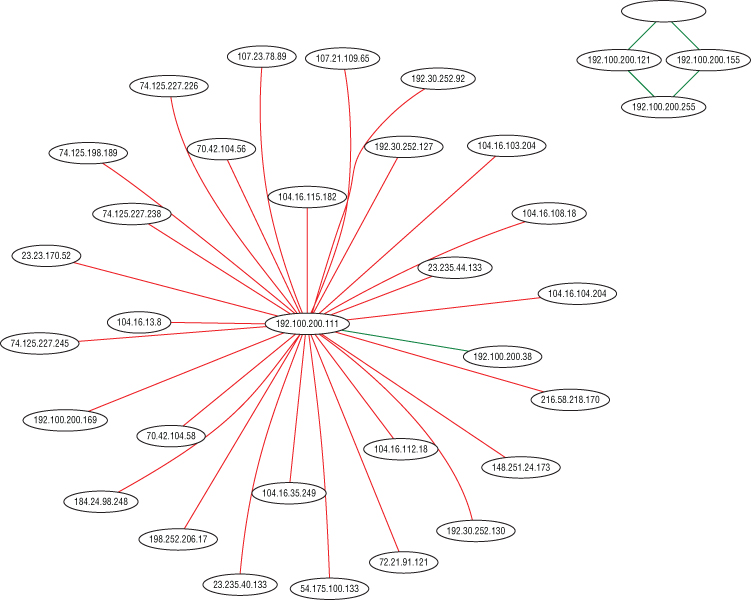
Figure 7-18: TShark-generated network graph
Having a network graph can be valuable in a few scenarios. Like we hinted at in the section's introduction, you might be a penetration tester at an unfamiliar network. With this Lua script, you can gain a high-level overview of the network traffic. Regardless of whether or not the customer provides you a network diagram, your diagram is based on actual traffic, not how the customer believes the traffic is.
Similarly, you might have the scenario where you're expecting a certain connection between two systems but your Lua-generated network graph fails to show that connection. While this isn't a “smoking gun” for a problem, it does illustrate a discrepancy that might need further investigation.
Summary
This chapter covered a wide range of topics. We went through how you can use Wireshark to decrypt SSL/TLS-encrypted traffic. The first method of decryption utilized the TLS server's private key and can only be utilized if the Diffie-Helman key exchange is not used. In the case of more robust cipher suites that utilize Diffie-Helman, we walked through how to get the session keys needed for decryption from your browser by setting the SSLKEYLOGFILE environment variable, and then feeding the resulting file to Wireshark.
After decryption, we quickly changed tracks and moved into how you can capture USB traffic from both Windows and Linux operating systems using Wireshark. With a solid understanding of how to capture USB packets, we weaponized that functionality to build a TShark-based key sniffer.
Finally, we covered how to import the Graphviz Lua graphing library to help you visualize the network. Using the Graphviz library, we created an SVG file that contains all the network hosts, as well as the corresponding connections. This allows you to quickly get an idea of the network topology without injecting any packets from your system.
Exercises
- Try decrypting SSL/TLS traffic on your home browser. Even when provided the key, can you decrypt? Why or why not? (Hint: DH exchange.)
- Suppose you find a legacy Linux system with kernel 2.6.7. What is the extra step for capturing USB traffic on a pre-2.6.23 kernel? See
https://wiki.wireshark.org/CaptureSetup/USB#Linux. - Try graphing the network in different W4SP Lab scenarios—for example, with the MitM or the IPS buttons enabled. Compare the different nodes that come up (or don't).