
CHAPTER 3
WBS Software and the WBS in Software
The following two aspects of the WBS and software applications are discussed in this chapter:
![]() Software designed to help the user develop and present the project or program WBS and thereby define the scope
Software designed to help the user develop and present the project or program WBS and thereby define the scope
![]() How the WBS is used in software as one of the disciplines used for organizing and communicating data, presenting the scope, and providing the framework for planning and scheduling
How the WBS is used in software as one of the disciplines used for organizing and communicating data, presenting the scope, and providing the framework for planning and scheduling
SOFTWARE TO HELP DEVELOP THE WBS
This section describes three software products that contain features that help the user in developing a WBS. Only the features of these products judged useful by the author in developing and using the WBS are addressed. These products have other features and capabilities that are outside the scope of this book.
WBS Chart Pro
WBS Chart Pro1 is a Microsoft Windows-based project management software application that is used to create and display projects using a WBS chart.
Features
WBS Chart Pro is used to develop a WBS from the top down in the typical organization-chart format. It helps users to think about the structure of the project while they define the various levels of detail. A new project starts with a single top-level element. As other elements are added, they are linked automatically into the selected parent–child or brother–sister relationship.
Figures 3-1 and 3-2 present two alternate displays of a sample project in WBS Chart Pro.
FIGURE 3-1 Sample WBS Chart Pro WBS

FIGURE 3-2 Sample WBS Chart Pro WBS

The two figures show alternative layouts of the same project. There are many more layout and content possibilities.
Additions are made by clicking an appropriate box in the existing WBS and then clicking one of four directional symbols in the toolbar to indicate the location for the next box. A blank box is then inserted to the left, to the right, above, or below the original box.
As a planning tool, WBS Chart Pro can be used to quickly sketch a project WBS on the screen using a top-down approach. You use the procedure just described to add the Level 2 items, and then you click in the new boxes and type in the WBS element names. Then you continue to break down each element by adding the next lower-level element. Remember to follow the 100 percent rule.
In setting up the format for the summary elements and detail tasks in WBS Chart Pro, one of the options is to include the WBS number. The WBS number then would then appear automatically, as shown in Figures 3-1 and 3-2. WBS numbers can also be assigned to the activities or tasks, if desired, but Figures 3-1 and 3-2 do not contain them. (They can be added at any point, however, by adding the “WBS” to the format of the task element.)
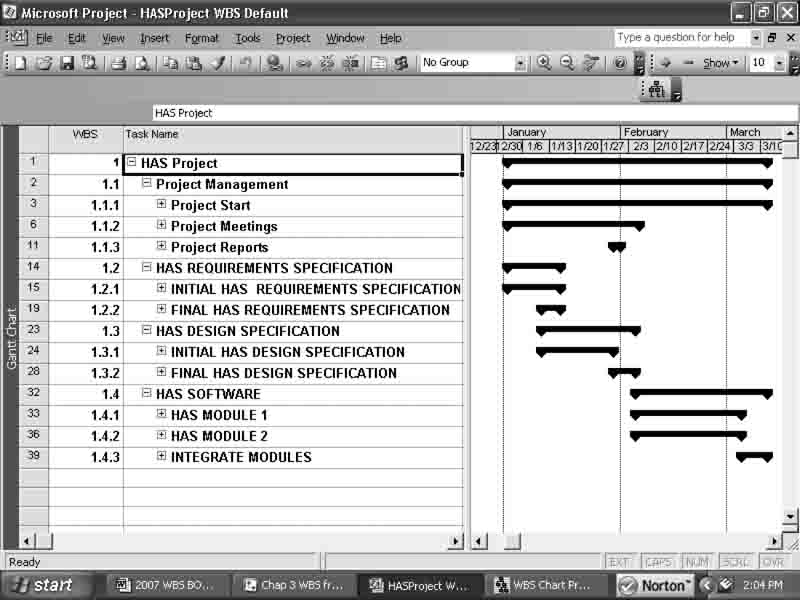
WBS Chart Pro can be tightly linked to Microsoft Project files. The Microsoft Project version of Figures 3-1 and 3-2 is shown in Figure 3-3. Note that the levels of indenting in Microsoft Project correspond to the WBS levels in Figures 3-1 and 3-2. The difference is that in Microsoft Project you do not have the option of not including a WBS number at the activity level (if you add a WBS column).
When a WBS chart of an existing Microsoft Project plan is created, all changes made in the WBS chart are immediately reflected in the Microsoft Project plan. This means that you can add, delete, reorganize, and update tasks in your Microsoft Project plan using the WBS chart.
Changing the levels in Microsoft Project by changing the level of indenting automatically updates the WBS Chart Pro file, and updating likewise occurs when the WBS Chart Pro file is revised.
FIGURE 3-3 Sample WBS in Microsoft Project

The elements in the WBS Chart Pro display can be modified to present any of the data that can be displayed in Microsoft Project. You can double-click a task within WBS Chart Pro to add schedule information like duration, start date, finish date, cost, work, and so on. A useful feature is the ability to automatically roll up (summarize) data to each level of the chart. This includes budgets, costs, hours, and the like, all from within WBS Chart Pro. This ability to roll up cost data makes WBS Chart Pro useful in some stand-alone situations (without Microsoft Project). For example, budgets and cost estimates can be shown in hierarchical formats and then discussed. The breakdowns are clearly presented, and this graphic presentation fits the work environment of many people better than tables of numbers.
Plans created in WBS Chart Pro can be maintained and managed separately, transferred directly to Microsoft Project, or transferred to any program that can read the MPX file format. A WBS chart can be easily transferred to Microsoft Project at any time. All the information you enter in WBS Chart Pro is automatically transferred to Microsoft Project. You can also enter data into Microsoft Project and then display it in WBS Chart Pro in the WBS chart format.
The author uses WBS Chart Pro and Microsoft Project simultaneously when developing the WBS and master schedule for a new project. Every project is different, and the exact approach is tailored to the specific project and organization. However, the process is generally the same in each case and is roughly as follows:
1. Open Microsoft Project and set up the new project. Open WBS Chart Pro from Microsoft Project and lay out the Level 2 breakdown and the Level 3 breakdown. One of the Level 2 elements should be Project Management (see Chapter 2).
2. In Microsoft Project, identify the deliverables and any other specific milestones required to be in the project.
3. Add additional levels to the WBS either in WBS Chart Pro or Microsoft Project down to the work package level. (Three levels may be at the work package level for parts of the WBS.) Think in terms of the 100 percent rule to make sure the WBS is complete.
4. Under each work package, identify the activities and their predecessors to form the network diagram. Tie in to each deliverable. (As the activities are added, estimate the durations as a minimum.) Review the WBS in WBS Chart Pro to making sure it is coherent and reflects the 100 percent rule at each level.
There is nothing absolute about this approach; each planner should tailor it to his/her own style and thought processes. The work plan development is iterative. Other considerations, such as the breakdown of “Project Management” and the use of “Start Project” and “Complete Project” milestones, are covered elsewhere. Also, WBS Chart Pro files can be readily converted to .jpg files and inserted in other applications (e.g., Figures 3-1 and 3-2).
Other Uses
The WBS-like hierarchical structure capabilities of WBS Chart Pro make the software suitable for uses beyond developing a WBS. Business Design Concepts (BDC) is a Temperance, Michigan, company that specializes in helping companies develop strategic business plans.2 The company does not follow the traditional methodology for developing strategic plans3 but has its own approach that it believes is much more effective and can be implemented in a much shorter time.
The BDC approach is to account for the current design of the business in developing the strategic plan. Goals and strategies need to factor in the performance capabilities of any design. For example: Your car may not be designed to go from 0 to 60 in two seconds, and setting goals and developing strategies based on this assumed performance will fail unless the design of the car is changed. The same applies to businesses. Without understanding the design constraints of a business, many strategies will fail to be implemented only because the design could not support the strategy.
Only strategies that can be accommodated by the existing business model can be implemented. The BDC methodology is based on a market model that is shown in Figure 3-4. A key analysis and communication tool is the WBS Chart Pro presentation of the four processes identified in the figure as relates to a specific company.
FIGURE 3-4 Business Design Concepts Market Model

BDC bases its approach on the following five key components in every business model, as pictured in Figure 3-4:
![]() Capstone (Mission, Environment, Goals)
Capstone (Mission, Environment, Goals)
![]() Market Model
Market Model
![]() Process Model
Process Model
![]() Physical Model
Physical Model
These are shown in Figure 3-4 as the “organization-chart” elements just below the capstone. The four models are developed using WBS Chart Pro.
The company defines and quantifies each component of the business model so that all components can be measured and managed. The components of the business model are developed and displayed in WBS Chart Pro format, as shown in Figure 3-5 for the top two levels.
FIGURE 3-5 Business Design Concepts Physical Model Example

BDC analyses have shown that there are structures, frameworks, and metrics common to every business. The analyses have identified common fundamentals that are applicable to companies of any size in any industry. The common elements can also be applied to government agencies and educational organizations.
The end product is more than a strategic plan; it consists of a high-level set of Business Blueprints™ that contain:
![]() A Market Model for critical products and customer segments
A Market Model for critical products and customer segments
![]() A Process Model showing critical processes
A Process Model showing critical processes
![]() A Cultural Model identifying key cultural elements such as mission and business goals
A Cultural Model identifying key cultural elements such as mission and business goals
![]() A Stakeholder Model recognizing the person(s) responsible for the performance of each critical process
A Stakeholder Model recognizing the person(s) responsible for the performance of each critical process
![]() Business Analysis of any findings encountered during the project
Business Analysis of any findings encountered during the project
The first four of these deliverables are developed using WBS Chart Pro.
The only way to effectively change a process is to first document it so that it becomes visible. Then you can see how everything is interrelated and make an intelligent and far less risky change. Without being able to physically see the design, solving a problem in one area can cause unexpected problems elsewhere. WBS Chart Pro is the vehicle used to make the major processes visible and available for discussion and change.
For our purposes, the importance of the work of BDC is in its use of WBS software to develop multidimensional hierarchical structures that are closely related to WBS concepts and follow WBS development rules.
An example of a BDC process chart appears in Figure 3-6.
FIGURE 3-6 Business Design Concepts Process Model

Visio WBS Modeler
An add-in to Microsoft Project is the Microsoft Visio WBS Modeler.4 It is a free download from Microsoft that requires users to have both Microsoft Project and Microsoft Visio on their computers. It works somewhat like WBS Chart Pro except that it uses Microsoft Visio and has the added ability to use all of Microsoft Visio’s functionality to add elements and text, and to edit. The basic WBS transferred directly from Microsoft Project is depicted in Figure 3-7, and the Microsoft Project version follows in Figure 3-8. In this case, an existing Microsoft Project example was used and imported into Microsoft Visio. The reverse process is possible and is what Microsoft envisioned: developing the WBS in Microsoft Visio and then exporting it to Microsoft Project.

FIGURE 3-8 Microsoft Project Version of Visio WBS
Although both Figure 3-7 and Figure 3-8 show only the levels selected in Microsoft Project, the complete WBS, including all activities, was transferred to Microsoft Visio using the import command on the WBS Modeler tab in Microsoft Visio. Figure 3-9 shows the pop-up screen with the full WBS in outline form that was imported to Microsoft Visio. An advantage of having the WBS in Microsoft Visio is that it is easier to edit graphics in that application and to prepare presentations and handouts than it is in Microsoft Project.
FIGURE 3-9 WBS Screen in Visio

The WBS Modeler can be used to either visualize and edit an existing project plan or create a new project plan in Microsoft Visio and then export it to Microsoft Project to carry out the next planning steps.
The WBS can be exported back to Microsoft Project into a new project plan. It is also possible to update an existing plan. However, the update process is limited to deleting, renaming, or adding elements. Moving elements to a different parent is not supported in the WBS Modeler at present. To organize the structure within WBS Modeler, the outline code from Microsoft Project is used, as shown in Figure 3-9.
WBS Director
WBS Director is a recent Microsoft Project add-in developed by QuantumPM, LLC, of Denver, Colorado. The focus of this application is on using a WBS that is built on the screen using the graphic display, in combination with a spreadsheet that presents the child elements of the node selected. The WBS Director assists in structuring the project via a WBS and in defining the beginning and ending activities of each work package. Figure 3-10 presents a picture of the screen display used when developing the WBS in WBS Director.
FIGURE 3-10 WBS Director Sample Display 1

As an add-in to Microsoft Project, WBS Director operates within the Microsoft Project file. While the WBS is being developed, the same elements are being entered into Microsoft Project, as shown in Figure 3-11.
FIGURE 3-11 WBS Director Sample Display 2
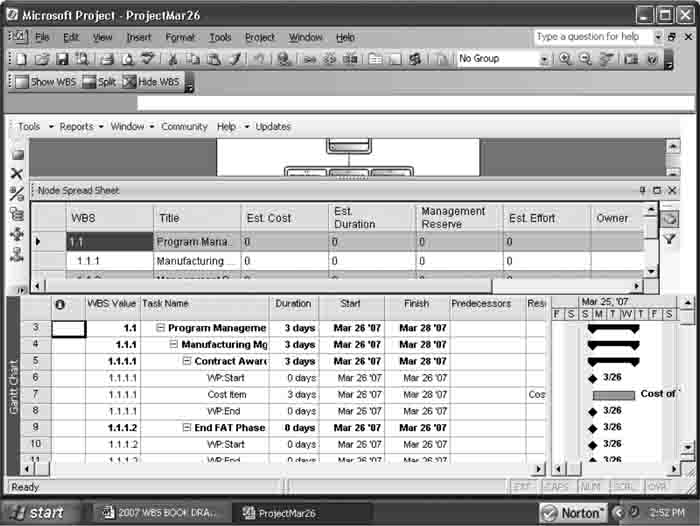
The Node Spread Sheet was left open partially in Figure 3-11 so that the relationships are visible. By toggling the Hide/Show WBS icons, it is possible to move back and forth between the two linked applications.
A key aspect of the WBS Director algorithm is defining the lowest levels in the WBS as the work packages, as is customary in project management and consistent with the PMBOK® Guide. For each work package, WBS Director has Microsoft Project automatically display the WP:Start and WP:End milestones. This action forces the user to follow good project management (PM) practices in the definition of activities within each work package. The WBS numbers do not change or increment for the activities because they are assigned to WBS elements, of which the work package is the lowest. All milestones and activities within a work package retain the WBS number of the work package. This is especially useful when using WBS Director and Microsoft Project in an earned value management system (EVMS).
Because of the nature of the Node Spread Sheet, as can be seen in Figure 3-11, all Microsoft Project data can be input via this sheet. There is no need to toggle back and forth between applications.
Another useful aspect of WBS Director is the WBS dictionary display, which allows a description of each WBS element to be entered and reported, and a WBS dictionary to be developed.
SOFTWARE USING THE WBS
In the previous section three software programs that assist the user in developing a WBS were described. In this section the use of an already-developed WBS in project management software is discussed. The purpose is to be able to relate activities in project management software to the WBS structure to facilitate cost “roll-up” and for other purposes.
Project Management Software
Most of the existing project management software application programs incorporate a WBS in their basic operations. It is common for the software to use the WBS structure as the basis for the numbering scheme for activities and to identify levels for summarization. This section shows the use of two of the most popular applications, Microsoft Project and Primavera Project Planner.
Microsoft Project Software
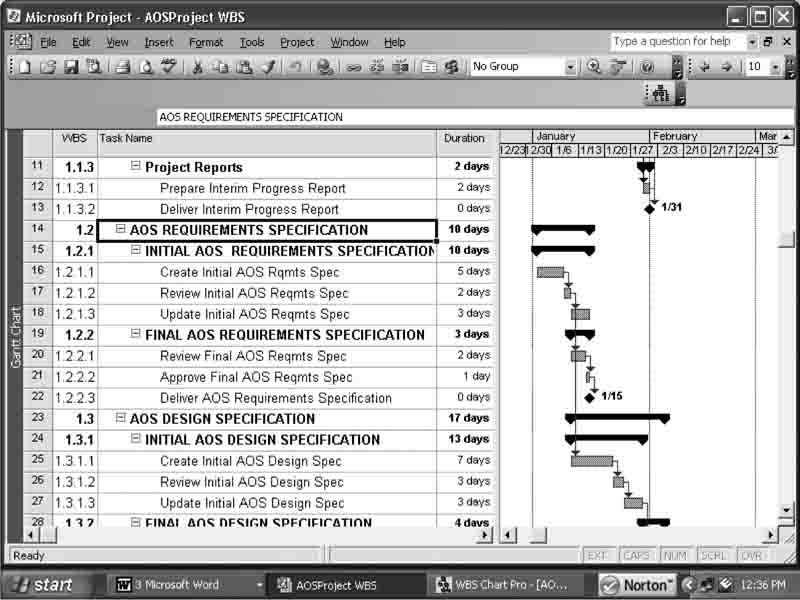
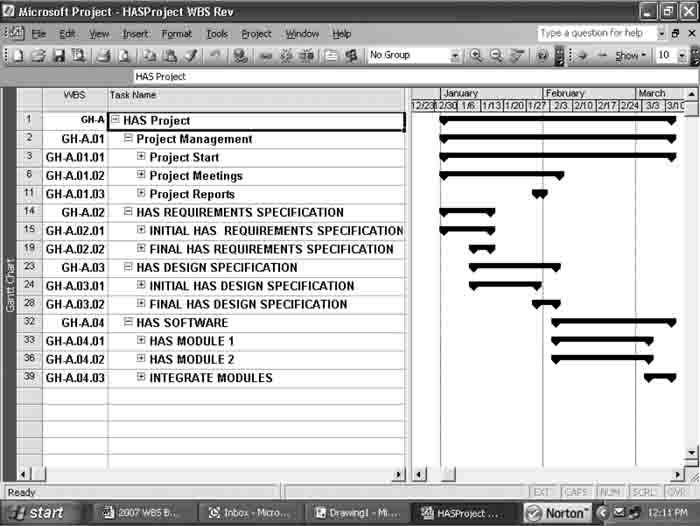
The most commonly used software for project management is Microsoft Project.5 Figure 3-12 shows the screen and the WBS for a sample project. The WBS column is added by the user by inserting a column (usually on the far left) and then selecting “WBS” from a long list of possible column content definitions. When “WBS” is selected, the entries in the Task Name fields are numbered automatically according to the levels of indenting and the WBS Code Definitions entered. The default values are shown in the figure.
FIGURE 3-12 Example Microsoft Project WBS Numbering
The WBS Chart Pro version of the same WBS is shown in Figure 3-13. It presents only Levels 2 and 3 because the Level 1 project name was not included in the Microsoft Project version.
FIGURE 3-13 WBS Chart Pro Sample

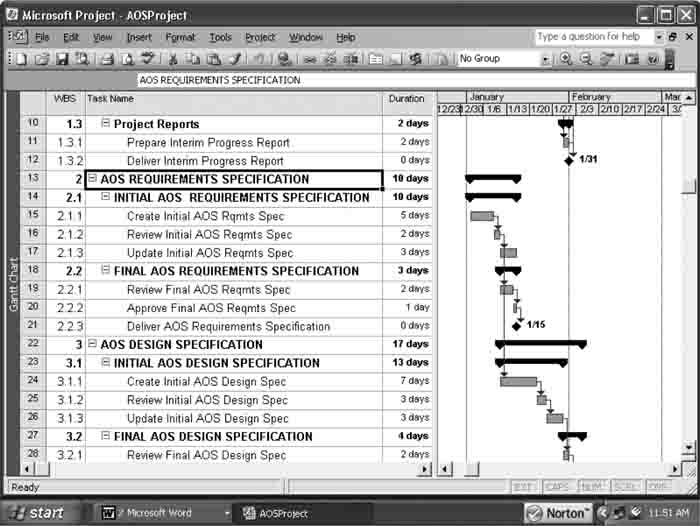
If the Microsoft Project file is changed to add the project name, AOS Project, to the first line of the Gantt Chart display, and the elements are moved down a level (one step to the right), we get the default Microsoft Project WBS numbering that is shown in Figure 3-14 and the related WBS Chart Pro WBS shown in Figure 3-15.
FIGURE 3-14 AOS Project WBS Numbering
Figures 3-14 and 3-15 show how the levels of indenting in Microsoft Project affect the WBS numbering.
FIGURE 3-15 WBS Chart Pro Presentation
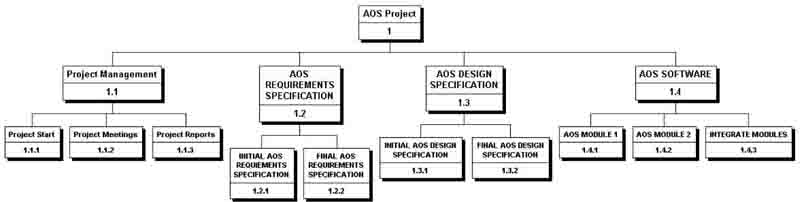
Figure 3-16 shows the flexibility that is available for establishing WBS numbering in Microsoft Project when the WBS Code Definition dialog box is used.
FIGURE 3-16 WBS Numbering Example
In Figure 3-16, a project identifier “GH” was added as a prefix. The identifier might help identify and differentiate the WBS elements in this project from other enterprise projects, or the “GH” might be a program identifier. An identifier is especially useful if you work with multiple projects that are consolidated in a master program or with projects that have links to external tasks.
Besides a choice of field size for each level of indenting number, the separator is also optional, and almost any symbol can be chosen. It is not necessary to use a period, as shown in the figure. Within each level, there is a choice of four options for the primary sequencing system, as shown in Figure 3-17 in the dialog box.
FIGURE 3-17 Microsoft Project WBS Code Definition

This ability to structure the WBS number is a very useful feature. The comparable WBS, as presented in WBS Chart Pro, is shown in Figure 3-18.
FIGURE 3-18 Microsoft Project WBS Numbering in WBS Chart Pro

Microsoft Project also provides the user with the ability to choose not to automatically generate WBS codes and the ability to choose to enter duplicate codes.
Primavera Project Planner® Software
Primavera Project Planner® software, also referred to as P3®, is an upscale project management software package designed for large projects having thousands of activities and large numbers of different types of resources.6 The software is especially popular in the construction industry, where it dominates the field. Figure 3-19 shows the information available on a typical computer screen presentation showing the WBS field on each activity record. The ability to build-in a lot of intelligence in the Activity ID (among other things) gives P3® very powerful sorting capabilities that facilitate using the software throughout the project.
FIGURE 3-19 Example WBS in Primavera Project Planner®

The project partially presented is the recently completed project for a new DOT Headquarters Building in Washington, D.C., used as an illustration in other sections of this book. Note that the WBS is shown in the left-hand column and relates activities to work packages. As can be seen, each work package, identified by a WBS number, has several activities. All the activities in a particular work package have the same WBS number.
Figure 3-20 shows part of the setup of the WBS in P3®. At first glance, the screen display is daunting because two dialog boxes are shown in front of the basic display of project activities.
FIGURE 3-20 WBS Setup in Primavera Project Planner®

A first step in setting up the WBS is to determine the size of each field for the corresponding WBS level and enter that data into the Work Breakdown Structure dialog box. The separators to be used between the WBS level numbers are also identified. They do not have to be periods; they can be commas, dashes, spaces, and so on. Choosing a separator is done as part of setting up the software and needs to be done only once.
The WBS entered into the WBS data menu includes a number and WBS element description. It can be accessed from the main menu. The WBS dialog box opens and is referred to in P3® jargon as the “WBS dictionary.” This is not a true “WBS dictionary,” as described elsewhere in this book, because it does not describe what work is addressed, only the name of the WBS element. The WBS dictionary does not have to be built up all at once, nor does it have to be prepared at any one particular time, although it should be used to assist in the planning. The WBS dictionary can be printed separately or just viewed on-screen at any time. The numbering system will be automatically indexed for new WBS elements after the WBS numbering system for any level is defined. The numbers may be any alphanumeric combination, for example, “AM.04. 1. A” for an activity at Level 4. Such a system gives the user great flexibility in WBS numbering because it includes a method of identifying discrete projects within a program and provides a way of adding other information—such as organizational responsibility—into the WBS fields. Up to 20 levels can be identified in the WBS, and each level can contain up to 10 digits.
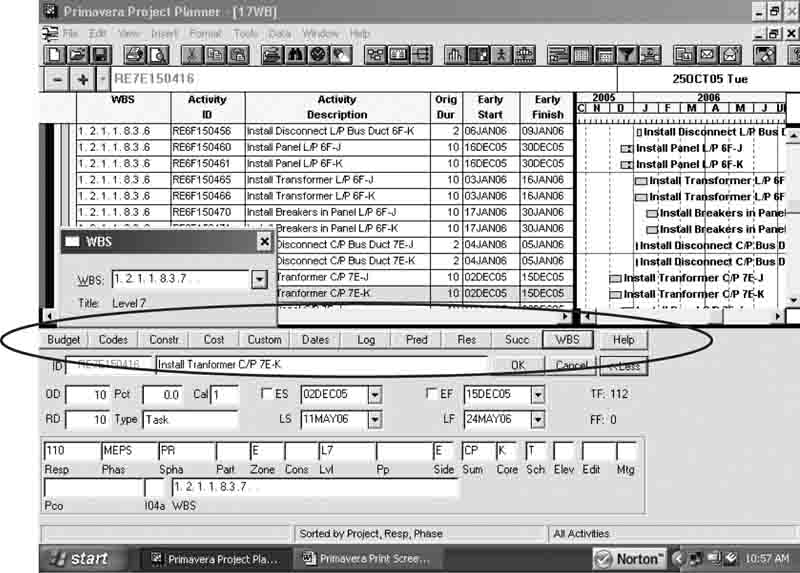
Figure 3-21 shows the data that are available for each activity and the dialog box that can be used to enter or identify the specific WBS number for a specific activity. Each of the tabs in the lower circled table can be clicked to open the appropriate data entry screen (as was done for the WBS). Activity data can be entered, changed, or reviewed in this form. This feature provides wide flexibility for entering or debugging WBS numbers. By using the recommended WBS numbering scheme for activities, all the activities that are part of the same work package are assigned the same WBS number. This action greatly facilitates the implementation of EVMS.
FIGURE 3-21 P3® Sample with Activity Data Pop-up
For organizations that have a more or less standard WBS, it is possible to copy the WBS from one project to another to save repeating the data entry process. It is also possible for parts of the WBS to be copied and pasted where there is a lot of duplication of text and the numbering is automatically changed. P3® is a complex project management software package, and getting further into the detail of it is beyond the scope of this book. The purpose of this brief review is to point out the manner in which the WBS numbering is accomplished in other popular software and how the numbering is linked to work packages and activities.
Cost-Estimating Software
Cost-estimating software that uses a bottom-up approach as opposed to parametric cost-estimating relations is usually based on a WBS. For example, International Project Estimating, Ltd., of Toronto, Canada, offers project estimating software that is WBS-based (http://www.ipestimate.com). The company’s model has the option for the user to develop the WBS or to choose one of several standard international construction structures or master WBSs as a starting point, including the following:
![]() Construction Specification Institute, CSI—North American Building Breakdown
Construction Specification Institute, CSI—North American Building Breakdown
![]() California DOT—Caltrans Standard Bid Item Breakdown
California DOT—Caltrans Standard Bid Item Breakdown
![]() International Project Estimating, Ltd., IPEL—Design Build Infrastructure Breakdown, Chief Estimator WBS
International Project Estimating, Ltd., IPEL—Design Build Infrastructure Breakdown, Chief Estimator WBS
![]() Ministry of Transportation of Ontario, MTO—MTO Standard Codes
Ministry of Transportation of Ontario, MTO—MTO Standard Codes
![]() SMM7—British Standard Method of Measurement
SMM7—British Standard Method of Measurement
These structures provide the specific WBS summary and lowest-level work packages. The estimator defines the activities within each work package, and the costs and resources required for each activity of the work package in total are individually estimated within the model. Not all work packages under each summary WBS are used in all projects, but the estimator selects the relevant WBS work package. See Chapter 9 for examples of these specific work breakdowns, and see Chapter 5 for a discussion of bottom-up cost estimation.
NOTES
1. Critical Tools™, “Project Planning and Graphic Software,” Critical Tools, Inc. Online at http://www.criticaltools.com (accessed February 2008).
2. For more information about Business Design Concepts, please visit its website at http://www.businessdesignconcepts.com (accessed February 2008).
3. Gregory T. Haugan, Project Planning and Scheduling (Vienna, VA: Management Concepts, Inc., 2002), 10.
4. See the Microsoft Download page, “Microsoft Office Visio 2007 WBS Modeler,” Microsoft Corporation. Online at http://www.wbsmodeler.com (accessed February 2008).
5. See the Microsoft Office Project page, “Microsoft Office Project 2007,” Microsoft Corporation. Online at http://www.microsoft.com/office/project (accessed February 2008).
6. See the Primavera website, “Primavera Project Planner®, P3®,” Primavera Systems, Inc. Online at http://www.primavera.com/products/p3.asp (accessed February 2008).