
8. Promotion
Introduction
Price promotions can be divided into two broad categories:
• Temporary price reductions.
• Permanent features of pricing systems.1
With both of these, firms seek to change the behavior of consumers and trade customers in ways that increase sales and profits over time, though a promotion’s short-term effect on profits will often be negative. There are multiple routes to sales and profit growth and many potential reasons for offering price promotions. Such programs might be aimed at affecting the behavior of end users (consumers), trade customers (distributors or retailers), competitors, or even a firm’s own salespeople. Although the goal of a promotion is often to increase sales, these programs can also affect costs. Examples of specific, short-term promotional objectives include the following:
• To acquire new customers, perhaps by generating trial.
• To appeal to new or different segments that are more price-sensitive than a firm’s traditional customers.
• To increase the purchase rates of existing customers; to increase loyalty.
• To gain new trade accounts (that is, distribution).
• To introduce new SKUs to the trade.
• To increase shelf space.
• To blunt competitive efforts by encouraging the firm’s customers to “load up” on inventory.
• To smooth production in seasonal categories by inducing customers to order earlier (or later) than they ordinarily would.
The metrics for many of these interim objectives, including trial rate and percentage of new product sales, are covered elsewhere. In this chapter, we focus on metrics for monitoring the acceptance of price promotions and their effects on sales and profits.
The most powerful framework for evaluating temporary price promotions is to partition sales into two categories: baseline and incremental. Baseline sales are those that a firm would have expected to achieve if no promotion had been run. Incremental sales represent the “lift” in sales resulting from a price promotion. By separating baseline sales from incremental lift, managers can evaluate whether the sales increase generated by a temporary price reduction compensates for the concomitant decrease in prices and margins. Similar techniques are used in determining the profitability of coupons and rebates.
Although the short-term effect of a price promotion is almost invariably measured by its increase in sales, over longer periods management becomes concerned about the percentage of sales on deal and the percentage of time during which a product is on deal. In some industries, list price has become such a fiction that it is used only as a benchmark for discussing discounts.
Average deal depth and the price waterfall help capture the depth of price cuts and explain how one arrives at a product’s net price (pocket price) after accounting for all discounts. There are often major differences between the discounts offered to trade customers and the extent to which those discounts are accepted. There may also be a difference between the discounts received by the trade and those that the trade shares with its customers. The pass-through percentage and price waterfall are analytic structures designed to capture those dynamics and thus to measure the impact of a firm’s promotions.
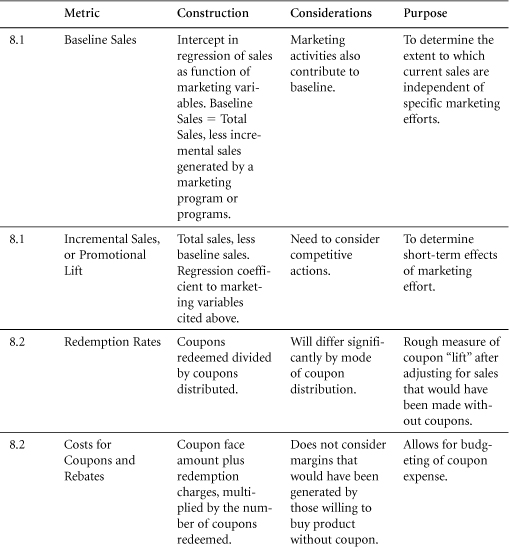
8.1 Baseline Sales, Incremental Sales, and Promotional Lift
The justification of marketing spending almost always involves estimating the incremental effects of the program under evaluation. However, because some marketing costs are often assumed to be fixed (for example, marketing staff and sales force salaries), one rarely sees incremental sales attributed to these elements of the mix.
Purpose: To select a baseline of sales against which the incremental sales and profits generated by marketing activity can be assessed.
A common problem in marketing is estimating the sales “lift” attributable to a specific campaign or set of marketing activities. Evaluating lift entails making a comparison with baseline sales, the level of sales that would have been achieved without the program under evaluation. Ideally, experiments or “control” groups would be used to establish baselines. If it were quick, easy, and inexpensive to conduct such experiments, this approach would dominate. In lieu of such control groups, marketers often use historical sales adjusted for expected growth, taking care to control for seasonal influences. Regression models that attempt to control for the influence of these other changes are often used to improve estimates of baseline sales. Ideally, both controllable and uncontrollable factors, such as competitive spending, should be included in baseline sales regression models. When regression is used, the intercept is often considered to be the baseline.
Construction
In theory, determining incremental sales is as simple as subtracting baseline sales from total sales. Challenges arise, however, in determining baseline sales.
Baseline Sales: Expected sales results, excluding the marketing programs under evaluation.
In reviewing historical data, total sales are known. The analyst’s task then is to separate these into baseline sales and incremental sales. This is typically done with regression analysis. The process can also involve test market results and other market research data.
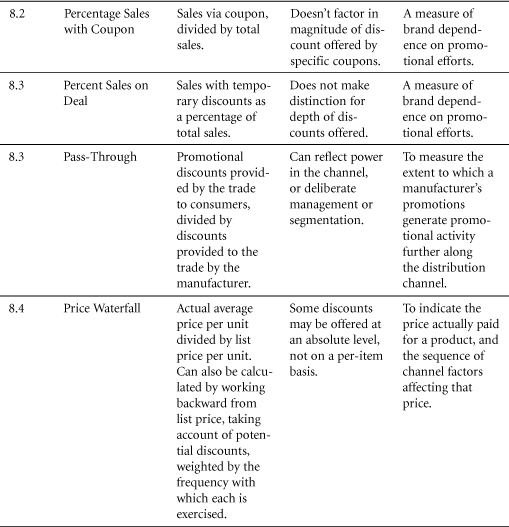
Total Sales ($,#) = Baseline Sales ($,#) + Incremental Sales ($,#)
Analysts also commonly separate incremental sales into portions attributable to the various marketing activities used to generate them.

Baseline sales are generally estimated through analyses of historical data. Firms often develop sophisticated models for this purpose, including variables to adjust for market growth, competitive activity, and seasonality, for example. That done, a firm can use its model to make forward-looking projections of baseline sales and use these to estimate incremental sales.
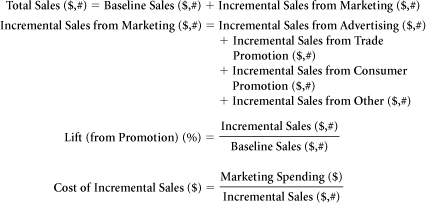
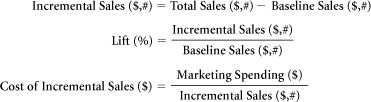
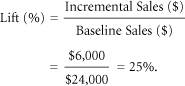
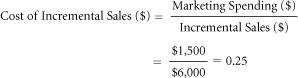
Incremental sales can be calculated as total sales, less baseline sales, for any period of time (for example, a year, a quarter, or the term of a promotion). The lift achieved by a marketing program measures incremental sales as a percentage of baseline sales. The cost of incremental sales can be expressed as a cost per incremental sales dollar or a cost per incremental sales unit (for example, cost per incremental case).
EXAMPLE: A retailer expects to sell $24,000 worth of light bulbs in a typical month without advertising. In May, while running a newspaper ad campaign that cost $1,500, the store sells $30,000 worth of light bulbs. It engages in no other promotions or nonrecurring events during the month. Its owner calculates incremental sales generated by the ad campaign as follows:
The store owner estimates incremental sales to be $6,000. This represents a lift (%) of 25%, calculated as follows:
The cost per incremental sales is $0.25, calculated as follows:
Total sales can be analyzed or projected as a function of baseline sales and lift. When estimating combined marketing mix effects, one must be sure to determine whether lift is estimated through a multiplicative or an additive equation. Additive equations combine marketing mix effects as follows:
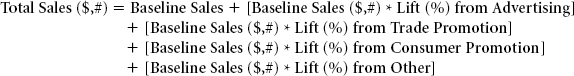
This additive approach is consistent with the conception of total incremental sales as a sum of the incremental sales generated by various elements of the marketing mix. It is equivalent to a statement that

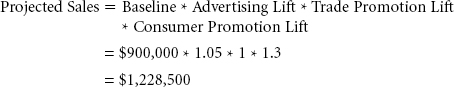
Multiplicative equations, by contrast, combine marketing mix effects by using a multiplication procedure, as follows:

When using multiplicative equations, it makes little sense to talk about the incremental sales from a single mix element. In practice, however, one may encounter statements that attempt to do exactly that.
EXAMPLE: Company A collects data from past promotions and estimates the lift it achieves through different elements of the marketing mix. One researcher believes that an additive model would best capture these effects. A second researcher believes that a multiplicative model might better reveal the ways in which multiple elements of the mix combine to increase sales. The product manager for the item under study receives the two estimates shown in Table 8.1.
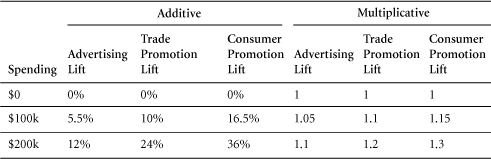
Table 8.1 Expected Returns to Marketing Spending
Fortunately, both models estimate baseline sales to be $900,000. The product manager wants to evaluate the following spending plan: advertising ($100,000), trade promotion ($0), and consumer promotion ($200,000). He projects sales using each method as follows:
Additive:
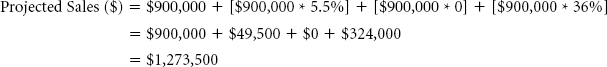
Note: Because these models are constructed differently, they will inevitably yield different results at most levels. The multiplicative method accounts for a specific form of interactions between marketing variables. The additive method, in its current form, does not account for interactions.
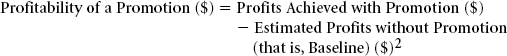
When historic sales have been separated into baseline and incremental components, it is relatively simple to determine whether a given promotion was profitable during the period under study. Looking forward, the profitability of a proposed marketing activity can be assessed by comparing projected levels of profitability with and without the program:
EXAMPLE: A luggage manufacturer faces a difficult decision regarding whether to launch a new promotion. The firm’s data show a major increase in product sales in November and December, but its managers are unsure whether this is a permanent trend of higher sales or merely a blip—a successful period that can’t be expected to continue (see Figure 8.1).
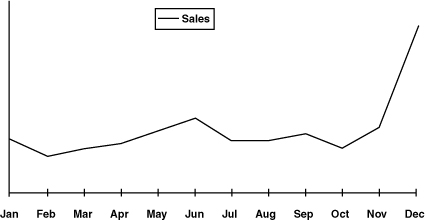
Figure 8.1 Monthly Sales Patterns
The firm’s VP of Marketing strongly supports the proposed promotion. He argues that the increased volume can’t be expected to continue and that the firm’s historic baseline (26,028 units) should be used as the level of sales that can be anticipated without the promotion. In addition, the Marketing VP argues that only the variable cost of each sale should be considered. “After all, the fixed costs will be with us whatever we do,” he says. On this basis, the relevant cost per unit subject to analysis would be $25.76.
The CEO hires a consultant who has a very different opinion. In the consultant’s view, the November-December sales increase was more than a blip. The market has grown, she says, and the strength of the firm’s brand has grown with it. Consequently, a more appropriate estimate of baseline sales would be 48,960 units. The consultant also points out that in the long term, no costs are fixed. Therefore, for purposes of analysis, fixed costs should be allocated to the cost of the product because the product must ultimately generate a return after such expenses as factory rent are paid. On this basis, the full cost of each unit, $34.70, should be used as the cost of incremental sales (see Table 8.2).
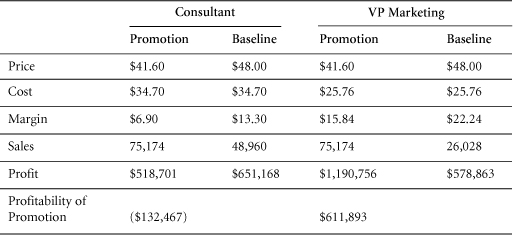
Table 8.2 Baseline Matters When Considering Profitability
The Marketing VP and the consultant make very different projections of the profitability of the promotion. Once again, the choice of the baseline matters. Also, we can see that establishing a shared understanding of costs and margins can be critical.
Data Sources, Complications, and Cautions
Finding a baseline estimate of what a company can be expected to sell, “all things being equal,” is a complex and inexact process. Essentially, the baseline is the level of sales that can be expected without significant marketing activities. When certain marketing activities, such as price promotions, have been employed for several periods, it can be especially difficult to separate “incremental” and “baseline” sales.
In many companies, it is common to measure sales performance against historic data. In effect, this sets historic sales as the baseline level for analysis of the impact of marketing spending. For example, retailers can evaluate their performance on the basis of same store sales (to remove differences caused by the addition or removal of outlets). Further, they can compare each current period to the same period in the prior year, in order to avoid seasonality biases and to ensure that they measure periods of special activity (such as sales events) against times of similar activity.
It is also common practice to adjust the profitability of promotions for longer-term effects. These effects can include a decline in sales levels in periods immediately following a promotion, as well as higher or lower sales in related product categories that are associated with a promotion. Adjustments can be negative or positive. Additional long-term effects, such as obtaining trial by new consumers, gaining distribution with trade customers, and increased consumption rates were discussed briefly in the chapter introduction.
Long-Term Effects Of Promotions
Over time, the effects of promotions may be to “ratchet” sales up or down (see Figures 8.2 and 8.3). Under one scenario, in response to one firm’s promotions, competitors may also increase their promotional activity, and consumers and trade customers in the field may learn to wait for deals, increasing sales for no one (see the prisoner’s dilemma in Section 7.5).
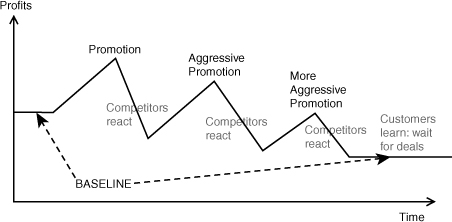
Figure 8.2 Downward Spiral—Promotional Effectiveness
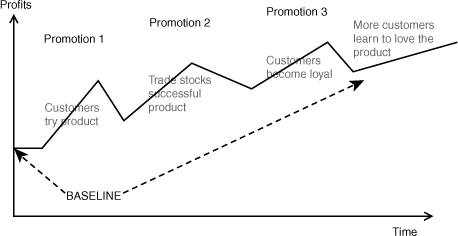
Figure 8.3 Successful Promotion with Long-Term Benefits
Under a different, more heartening scenario, promotions can generate trial for new products, build trade distribution, and encourage loyalty, thus raising the long-term level of baseline sales.
8.2 Redemption Rates, Costs for Coupons and Rebates, Percent Sales with Coupon
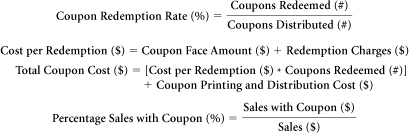
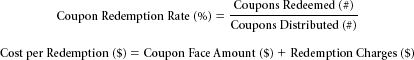
The redemption rate is an important metric for marketers assessing the effectiveness of their coupon distribution strategy. It helps determine whether coupons are reaching the customers who are motivated to use them. Similar metrics apply to mail-in rebates.
Cost per redemption ($) measures variable costs per coupon redeemed. Coupon distribution costs are usually viewed as fixed costs.
Purpose: To track and evaluate coupon usage.
Some people hate coupons. Some like them. And some say they hate coupons, but really like them. Businesses often say they hate coupons but continue to use them. Coupons and rebates are used to introduce new products, to generate trial of existing products by new customers, and to “load” consumers’ pantries, encouraging long-term consumption.
Almost all of the interim objectives discussed in the introduction to this chapter can apply to coupons and rebates. Coupons can be used to offer lower prices to more price-sensitive consumers. Coupons also serve as a form of advertising, making them dual-purpose marketing vehicles. Coupon clippers will see a brand name and pay closer attention to it— considering whether they desire the product—than would an average consumer exposed to an advertisement without a compelling offer. Finally, both rebates and coupons can serve as focus points for retailer promotions. To generate traffic, retailers can double or even triple coupon amounts—generally up to a declared limit. Retailers also often advertise prices “after rebates” in order to promote sales and perceptions of value.
Construction
Total Coupon Cost: Reflects distribution, printing,3 and redemption costs to estimate the total cost of a coupon promotion.
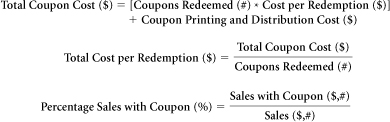
To determine the profitability of coupons and rebates, managers require approaches similar to those used in estimating baseline and incremental sales, as discussed in the previous section of this chapter. By themselves, redemption rates are not a good measure of success. Under certain circumstances, even low redemption rates can be profitable. Under other circumstances, by contrast, high redemption rates can be quite damaging.
Data Sources, Complications, and Cautions
To calculate coupon redemption rates, managers must know the number of coupons placed in circulation (distributed) as well as the number redeemed. Companies generally engage distribution services or media companies to place coupons in circulation. Redemption numbers are usually derived from the invoices presented by coupon clearinghouses.
Related Metrics and Concepts
Mail-In Rebates
The rebate, in effect, is a form of coupon that is popular with big-ticket items. Its usage dynamics are straightforward: Customers pay the full price for a product, enabling retailers to meet a specific price point. The customer then exercises the rebate and receives back a specified dollar amount.
By using rebates, marketers gain information about customers, which can be useful in remarketing and product control. Mail-in rebates also reduce the effective price of an item for customers who are sufficiently price-conscious to take advantage of them. Others pay full price. The “non-redemption rates” for rebates are sometimes called “breakage.”
Breakage: The number of rebates not redeemed by customers. The breakage rate is the percentage of rebates not redeemed.
EXAMPLE: A cell phone company sold 40,000 handsets in one month. On each purchase, the customer was offered a $30 rebate. Thirty thousand rebates were successfully claimed.
In volume terms, the rebate redemption rate can be calculated by dividing the number of rebates successfully claimed (30,000) by number offered (40,000):
Managers often balk at the cost of distributing coupons. Because promotions rely on adequate distribution, however, it is inadvisable to create arbitrary cutoffs for distribution costs. The total cost of incremental sales generated would represent a better metric to evaluate coupon efficiency—and thus to determine the point at which diminishing returns make further coupon distribution unattractive.
In evaluating a coupon or rebate program, companies should also consider the overall level of benefit provided to consumers. Retailers commonly increase the value of coupons, offering customers a discount of double or even triple the coupons’ face value. This enables retailers to identify price-sensitive customers and offer them additional savings. Of course, by multiplying the savings afforded consumers, the practice of doubling or tripling coupons undoubtedly raises some redemption rates.
8.3 Promotions and Pass-Through
Manufacturers offer many discounts to their distributors and retailers (often called “the trade”) with the objective of encouraging them to offer their own promotions, in turn, to their customers. If trade customers or consumers do not find promotions attractive, this will be indicated by a decline in percentage sales on deal. Likewise, low pass-through percentages can indicate that too many deals—or the wrong kinds of deals—are being offered.
Purpose: To measure whether trade promotions are generating consumer promotions.
Pass-Through: The percentage of the value of manufacturer promotions paid to distributors and retailers that is reflected in discounts provided by the trade to their own customers.
“Middlemen” are a part of the channel structure in many industries. Companies may face one, two, three, or even four levels of “resellers” before their product reaches the ultimate consumer. For example, a beer manufacturer may sell to an exporter, who sells to an importer, who sells to a local distributor, who sells to a retail store. If each channel adds its own margin, without regard for how others are pricing, the resulting price can be higher than a marketer would like. This sequential application of individual margins has been referred to as “double marginalization.”4
Construction
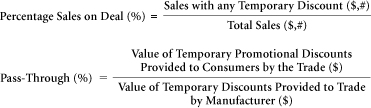
Percentage Sales on Deal: Measures the percentage of company sales that are sold with a temporary trade discount of some form. Note: This usually would not include standard discounts such as those for early payment or cooperative advertising allowances (accruals).
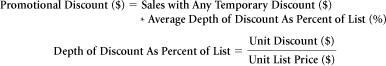
Promotional discount represents the total value of promotional discounts given throughout the sales channel.
Pass-through is calculated as the value of discounts given by the trade to their customers, divided by the value of temporary discounts provided by a manufacturer to the trade.
Data Sources, Complications, and Cautions
Manufacturers often compete with one another for the attention of retailers, distributors, and other resellers. Toward that end, they build special displays for their products, change assortments to include new offerings, and seek to elicit increasing attention from resellers’ sales personnel. Significantly, in their effort to increase channel “push,” manufacturers also offer discounts and allowances to the trade. It is important to understand the rates and amounts of discounts provided to the trade, as well as the proportions of those discounts that are passed along to the resellers’ customers. At times, when resellers’ margins are thin, manufacturers’ discounts are designed to enhance them. Market leaders often worry that trade margins are too thin to support push efforts. Other manufacturers may be concerned that retail margins are too high, and that too few of their discounts are being passed along. The metrics discussed in this chapter should be interpreted with these thoughts in mind.
Resellers may decide that optimizing an entire product line is more important than maximizing profits on any given product. If a reseller stocks multiple competing lines, it can be difficult to find an overall solution that suits both that reseller and its suppliers. Manufacturers strive to motivate resellers to market their goods aggressively and to grow their shared sales through such programs as incentives for “exclusivity,” or rebates based on increasing shares of category sales or on year-to-year growth in sales.
Resellers learn to adapt their buying and selling practices to take advantage of manufacturer pricing incentives. In this area, marketers must pay special attention to the law of unforeseen consequences. For example, resellers have been known to
• Buy larger quantities of a product than they can sell—or want to sell—in order to qualify for volume discounts. The excess goods are then sold (diverted) to other retailers, stored for future sales, or even destroyed or returned to the manufacturer for “credit.”
• Time their purchases at the ends of accounting periods in order to qualify for rebates and allowances. This results in “lumpy” sales patterns for manufacturers, making forecasting difficult, increasing problems with out-of-date products and returns, and raising production costs.
In some instances, a particularly powerful channel “captain” can impose pricing discipline on an entire channel. In most cases, however, each “link” in the distribution chain can coordinate only its own pricing. A manufacturer, for example, may work out appropriate pricing incentives for wholesalers, and the wholesalers in turn may develop their own pricing incentives for retailers.
In many countries and industries, it is illegal for suppliers to dictate the selling prices of resellers. Manufacturers can’t dictate wholesaler selling prices, and wholesalers can’t dictate retail prices. Consequently, members of the channel seek indirect methods of influencing resellers’ prices.
8.4 Price Waterfall
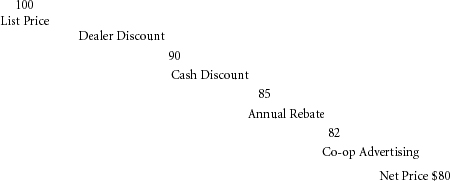
In this structure, the average price paid by customers will depend on the list price of a product, the sizes of discounts given, and the proportion of customers taking advantage of those discounts.
By analyzing the price waterfall, marketers can determine where product value is being lost. This can be especially important in businesses that allow the sales channel to reduce prices in order to secure customers. The price waterfall can help focus attention on deciding whether these discounts make sense for the business.
Purpose: To assess the actual price paid for a product, in comparison with the list price.
In pricing, the bad news is that marketers can find it difficult to determine the right list price for a product. The good news is that few customers will actually pay that price anyway. Indeed, a product’s net price—the price actually paid by customers—often falls between 53% and 94% of its base price.5
Net Price: The actual price paid for a product by customers after all discounts and allowances have been factored in. Also called the pocket price.
List Price: The price of a good or service before discounts and allowances are considered.
Invoice Price: The price specified on the invoice for a product. This price will typically be stated net of some discounts and allowances, such as dealer, competitive, and order size discounts, but will not reflect other discounts and allowances, such as those for special terms and cooperative advertising. Typically, the invoice price will therefore be less than the list price but greater than the net price.
Price Waterfall: The reduction of the price actually paid by customers for a product as discounts and allowances are given at various stages of the sales process. Because few customers take advantage of all discounts, in analyzing a product’s price waterfall, marketers must consider not only the amount of each discount but also the percentage of sales to which it applies.
As customers vary in their use of discounts, net price can fall into a wide range relative to list price.
Construction
To assess a product’s price waterfall, one must plot the price a customer will pay at each stage of the waterfall, specifying potential discounts and allowances in the sequence in which those are usually taken or applied. For example, broker commissions are generally applied after trade discounts.
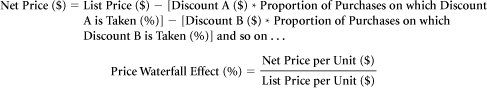
Net Price: The actual average price paid for a product at a given stage in its distribution channel can be calculated as its list price, less discounts offered, with each discount multiplied by the probability that it will be applied. When all discounts are considered, this calculation yields the product’s net price.
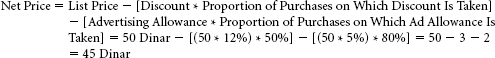
EXAMPLE: Hakan manages his own firm. In selling his product, Hakan grants two discounts or allowances. The first of these is a 12% discount on orders of more than 100 units. This is given on 50% of the firm’s business and appears on its invoicing system. Hakan also gives an allowance of 5% for cooperative advertising. This is not shown on the invoicing system. It is completed in separate procedures that involve customers submitting advertisements for approval. Upon investigation, Hakan finds that 80% of customers take advantage of this advertising allowance.
The invoice price of the firm’s product can be calculated as the list price (50 Dinar per unit), less the 12% order size discount, multiplied by the chance of that discount being given (50%).
The net price further reduces the invoice price by the average amount of the cooperative advertising allowance granted, as follows:
To find the effect of the price waterfall, divide the net price by the list price.
Data Sources, Complications, and Cautions
To analyze the impact of discounts, allowances, and the overall price waterfall effect, marketers require full information about sales, in both revenue and unit volume terms, at an individual product level, including not only those discounts and allowances that are formally recorded in the billing system, but also those granted without appearing on invoices.
The major challenge in establishing the price waterfall is securing product-specific data at all of these various levels in the sales process. In all but the smallest businesses, this is likely to be quite difficult, particularly because many discounts are granted on an off-invoice basis, so they might not be recorded at a product level in a firm’s financial system. Further complicating matters, not all discounts are based on list price. Cash discounts, for example, are usually based on net invoice price.
Where discounts are known in theory, but the financial system doesn’t fully record their details, the problem is determining how to calculate the price waterfall. Toward that end, marketers need not only the amount of each discount, but also the percentage of unit sales for which customers take advantage of that discount.
The typical business offers a number of discounts from list prices. Most of these serve the function of encouraging particular customer behaviors. For example, trade discounts can encourage distributors and resellers to buy in full truckloads, pay invoices promptly, and place orders during promotional periods or in a manner that smoothes production. Over time, these discounts tend to multiply as manufacturers find it easier to raise list price and add another discount than to eliminate discounts altogether.
Problems with discounts include the following:
• Because it’s difficult to record discounts on a per-item basis, firms often record them in aggregate. On this basis, marketers may see the total discounts provided but have difficulty allocating these to specific products. Some discounts are offered on the total size of a purchase, exacerbating this problem. This increases the challenge of assessing product profitability.
• Once given, discounts tend to be sticky. It is hard to take them away from customers. Consequently, inertia often leaves special discounts in place, long after the competitive pressures that prompted them are removed.
• To the extent that discounts are not recorded on invoices, management often loses track of them in decision-making.
As the Professional Pricing Society advises, when considering the price of a product, “Look past the invoice price.”6
Related Metrics and Concepts
Deductions: Some “discounts” are actually deductions applied by a customer to an invoice, adjusting for goods damaged in shipment, incorrect deliveries, late deliveries, or in some cases, for products that did not sell as well as hoped. Deductions might not be recorded in a way that can be analyzed, and they often are the subject of disputes.
Everyday Low Prices (EDLP): EDLP refers to a strategy of offering the same pricing level from period to period. For retailers, there is a distinction between buying at EDLP and selling at EDLP. For example, some suppliers offer constant selling prices to retailers but negotiate periods during which a product will be offered on deal with display and other retail promotions. Rather than granting temporary price discounts to retailers, suppliers often finance these programs through “market development funds.”
HI-LO (High-Low): This pricing strategy constitutes the opposite of EDLP. In HI-LO pricing, retailers and manufacturers offer a series of “deals” or “specials”—times during which prices are temporary decreased. One purpose of HI-LO pricing and other temporary discounts is to realize price discrimination in the economic—not the legal— sense of the term.
Price Discrimination And Tailoring
When firms face distinct and separable market segments with different willingness to pay (price elasticities), charging a single price means that the firm will “leave money on the table”—not capture the full consumer value.
There are three conditions for price tailoring to be profitable:
• Segments must have different elasticities (willingness to pay), and/or marketers must have different costs of serving the segments (say shipping expenses) and the incremental volume must be sufficiently large to compensate for the reduction in margin.
• Segments must be separable—that is, charging different prices does not just result in transfer between segments (for example, your father cannot buy your dinner and apply the senior citizen discount).
• The incremental profit from price tailoring exceeds the costs of implementing multiple prices for the same product or service.
Price tailoring is clearly a euphemism for price discrimination. However, the latter term is loaded with legal implications, and marketers understandably use it with caution.
When facing a total demand curve composed of identifiable segments with different demand slopes, a marketer can use optimal pricing for each segment recognized, as opposed to using the same price based upon aggregate demand. This is usually done by
• Time: For example, subways or movie theaters charging a higher price during rush or peak hour or products that are launched at a high price in the beginning, “skimming” profits from early adopters.
• Geography: Such as international market divisions—different prices for different regions for DVDs, for example.
• Tolerable discrimination: Identifying acceptable forms of segmentation, such as discriminating between students or senior citizens and the general public.
Price differences cause gray markets; goods are imported from low-price to high-price markets. Gray markets are common in some fashion goods and pharmaceuticals.
References and Suggested Further Reading
Abraham, M.M., and L.M. Lodish. (1990). “Getting the Most Out of Advertising and Promotion,” Harvard Business Review, 68(3), 50.
Ailawadi, K., P. Farris, and E. Shames. (1999). “Trade Promotion: Essential to Selling Through Resellers,” Sloan Management Review, 41(1), 83–92.
Christen, M., S. Gupta, J.C. Porter, R. Staelin, and D.R. Wittink. (1997). “Using Market-level Data to Understand Promotion Effects in a Nonlinear Model,” Journal of Marketing Research (JMR), 34(3), 322.
“Roegner, E., M. Marn, and C. Zawada. (2005). “Pricing,” Marketing Management, Jan/Feb, Vol. 14 (1).