
2. Share of Hearts, Minds, and Markets
Introduction
“As Wal-Mart aggressively rolls out more stores, it continues to capture an increasing share of wallet. Three out of five consumers shopped for gifts at Wal-Mart this past holiday season. U.S. households now buy, on average, 22% of their groceries at Wal-Mart. A quarter of all shoppers indicate that they are spending more of their clothing budget at Wal-Mart now compared with a year ago. These ShopperScape findings lend credence to Retail Forward’s premise that Wal-Mart will continue to push the boundaries of what consumers will allow it to be.”1
At first glance, market share appears to involve a relatively simple calculation: “us/(us + them).” But this raises a host of questions. Who, for example, are “they?” That is, how broadly do we define our competitive universe? Which units are used? Where in the value chain do we capture our information? What time frame will maximize our signal-to-noise ratio? In a metric as important as market share, and in one as closely monitored for changes and trends, the answers to such questions are crucial. In this chapter, we will address them and also introduce key components of market share, including penetration share, heavy usage index, and share of requirements.
Probing the dynamics behind market share, we’ll explore measures of awareness, attitude, and usage—major factors in the decision-making process by which customers select one brand over another. We’ll discuss customer satisfaction with products and dealers, the quantification of which is growing in importance among marketing professionals. Finally, we’ll consider metrics measuring the depth of consumer preference and satisfaction, including customers’ willingness to search if a brand is unavailable and their disposition to recommend that brand to others. Increasingly, marketers rely on these as leading indicators of future changes in share.
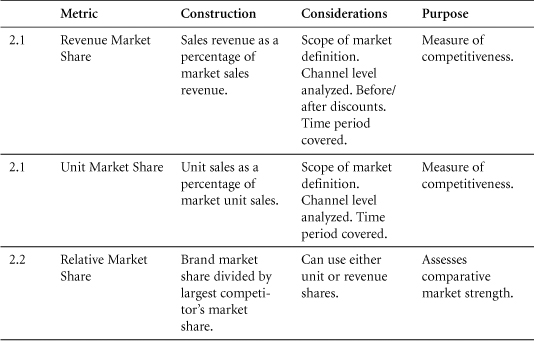
2.1 Market Share
Marketers need to be able to translate sales targets into market share because this will demonstrate whether forecasts are to be attained by growing with the market or by capturing share from competitors. The latter will almost always be more difficult to achieve. Market share is closely monitored for signs of change in the competitive landscape, and it frequently drives strategic or tactical action.
Purpose: Key indicator of market competitiveness.
Market share is an indicator of how well a firm is doing against its competitors. This metric, supplemented by changes in sales revenue, helps managers evaluate both primary and selective demand in their market. That is, it enables them to judge not only total market growth or decline but also trends in customers’ selections among competitors. Generally, sales growth resulting from primary demand (total market growth) is less costly and more profitable than that achieved by capturing share from competitors. Conversely, losses in market share can signal serious long-term problems that require strategic adjustments. Firms with market shares below a certain level may not be viable. Similarly, within a firm’s product line, market share trends for individual products are considered early indicators of future opportunities or problems.
Construction
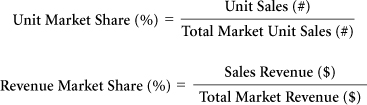
Market Share: The percentage of a market accounted for by a specific entity.
Unit Market Share: The units sold by a particular company as a percentage of total market sales, measured in the same units.
This formula, of course, can be rearranged to derive either unit sales or total market unit sales from the other two variables, as illustrated in the following:
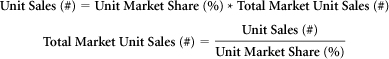
Revenue Market Share: Revenue market share differs from unit market share in that it reflects the prices at which goods are sold. In fact, a relatively simple way to calculate relative price is to divide revenue market share by unit market share (see Section 7.1).
As with the unit market share, this equation for revenue market share can be rearranged to calculate either sales revenue or total market sales revenue from the other two variables.
Data Sources, Complications, and Cautions
Market definition is never a trivial exercise: If a firm defines its market too broadly, it may dilute its focus. If it does so too narrowly, it will miss opportunities and allow threats to emerge unseen. To avoid these pitfalls, as a first step in calculating market share, managers are advised to define the served market in terms of unit sales or revenues for a specific list of competitors, products, sales channels, geographic areas, customers, and time periods. They might posit, for example, that “Among grocery stores, we are the revenue market share leader in sales of frozen Italian food entrées in the Northeastern U.S.”
Data parameters must be carefully defined: Although market share is likely the single most important marketing metric, there is no generally acknowledged best method for calculating it. This is unfortunate, as different methods may yield not only different computations of market share at a given moment, but also widely divergent trends over time. The reasons for these disparities include variations in the lenses through which share is viewed (units versus dollars), where in the channel the measurements are taken (shipments from manufacturers versus consumer purchases), market definition (scope of the competitive universe), and measurement error. In the situation analysis that underlies strategic decisions, managers must be able to understand and explain these variations.
Competitive dynamics in the automobile industry, and at General Motors in particular, illustrate the complexities involved in quantifying market share:
“With market share sliding in the first two months of the year, from 27.2% to 24.9%—the lowest level since a two-month strike shut the company down in 1998—GM as a whole expects a net loss of $846 million the first quarter.”2
Reviewing this statement, drawn from Business Week in 2005, a marketing manager might immediately pose a number of questions:
• Do these figures represent unit (auto) or revenue (dollar) market shares?
• Does this trend hold for both unit and revenue market shares at GM?
• Was revenue market share calculated before or after rebates and discounts?
• Do the underlying sales data reflect factory shipments, which relate directly to the manufacturer’s current income statement, or sales to consumers, which are buffered by dealer inventories?
• Does the decline in market share translate to an equivalent percentage decrease in sales, or has the total market size changed?
Managers must determine whether a stated market share is based on shipment data, channel shipments, retail sales, customer surveys, or some other source. On occasion, share figures may represent combinations of data (a firm’s actual shipments, for example, set against survey estimates of competitors’ sales). If necessary, managers must also adjust for differences in channels.
The time period measured will affect the signal-to-noise ratio: In analyzing short-term market dynamics, such as the effects of a promotion or a recent price change, managers may find it useful to measure market share over a brief period of time. Short-term data, however, generally carry a low signal-to-noise ratio. By contrast, data covering a longer time span will be more stable but may obscure important, recent changes in the market. Applied more broadly, this principle also holds in aggregating geographic areas, channel types, or customers. When choosing markets and time periods for analysis, managers must optimize for the type of signal that is most important.
Potential bias in reported shares: One way to find data for market sizing is through surveys of customer usage (see Section 2.7). In interpreting these data, however, managers must bear in mind that shares based on reported (versus recorded) sales tend to be biased toward well-known brands.
Related Metrics and Concepts
Served Market: That portion of the total market for which the firm competes. This may exclude geographic regions or product types. In the airline industry, for example, as of mid 2009, Ryan Air did not fly to the United States. Consequently, the U.S. would not be considered part of its served market.
2.2 Relative Market Share and Market Concentration
Market concentration, a related metric, measures the degree to which a comparatively small number of firms accounts for a large proportion of the market.
These metrics are useful in comparing a firm’s or a brand’s relative position across different markets and in evaluating the type and degree of competition in those markets.
Purpose: To assess a firm’s or a brand’s success and its position in the market.
A firm with a market share of 25% would be a powerful leader in many markets but a distant “number two” in others. Relative market share offers a way to benchmark a firm’s or a brand’s share against that of its largest competitor, enabling managers to compare relative market positions across different product markets. Relative market share gains some of its significance from studies—albeit controversial ones—suggesting that major players in a market tend to be more profitable than their competitors. This metric was further popularized by the Boston Consulting Group in its famous matrix of relative share and market growth (see Figure 2.1).
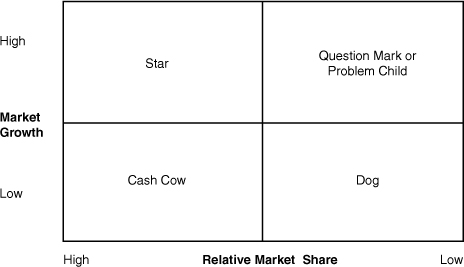
Figure 2.1 The BCG Matrix
In the BCG matrix, one axis represents relative market share—a surrogate for competitive strength. The other represents market growth—a surrogate for potential. Along each dimension, products are classified as high or low, placing them in one of four quadrants. In the traditional interpretation of this matrix, products with high relative market shares in growing markets are deemed stars, suggesting that they should be supported with vigorous investment. The cash for that investment may be generated by cash cows, products with high relative shares in low-growth markets. Problem child products may have potential for future growth but hold weak competitive positions. Finally, dogs have neither strong competitive position nor growth potential.
Construction
Relative market share can also be calculated by dividing brand sales (#,$) by largest competitor’s sales (#,$) because the common factor of total market sales (or revenue) cancels out.
EXAMPLE: The market for small urban cars consists of five players (see Table 2.1).
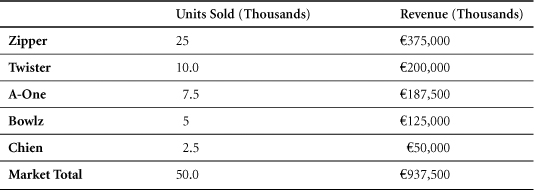
Table 2.1 Market for Small Urban Cars
In the market for small urban cars, managers at A-One want to know their firm’s market share relative to its largest competitor. They can calculate this on the basis of revenues or unit sales.
In unit terms, A-One sells 7,500 cars per year. Zipper, the market leader, sells 25,000. A-One’s relative market share in unit terms is thus 7,500/25,000 or 0.30. We arrive at the same number if we first calculate A-One’s share (7,500/50,000 = .15) and Zipper’s share (25,000/50,000 = .50) and then divide A-One’s share by Zipper’s share (.15/.50 = .30).
In revenue terms, A-One generates €187.5 million in car sales each year. Zipper, the market leader, generates €375 million. A-One’s relative market share in revenue terms is thus €187.5m/€375m, or 0.5. Due to its comparatively high average price per car, A-One’s relative market share is greater in revenue than in unit terms.
Related Metrics and Concepts
Market Concentration: The degree to which a relatively small number of firms accounts for a large proportion of the market. This is also known as the concentration ratio. It is usually calculated for the largest three or four firms in a market.3
Three (Four) Firm Concentration Ratio: The total (sum) of the market shares held by the leading three (four) competitors in a market.
EXAMPLE: In the small urban car market, the three firm concentration ratio is comprised of the market shares of the top three competitors—Zipper, Twister, and A-One (see Table 2.2).
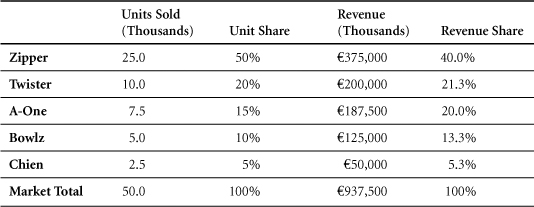
Table 2.2 Market Share—Small Urban Cars
In unit terms, the three firm concentration ratio is 50% + 20% + 15% = 85%.
In revenue terms, it is 40% + 21.3% + 20% = 81.3%.
Herfindahl Index: A market concentration metric derived by adding the squares of the individual market shares of all the players in a market. As a sum of squares, this index tends to rise in markets dominated by large players.
EXAMPLE: The Herfindahl Index dramatically highlights market concentration in the small urban car market (see Table 2.3).
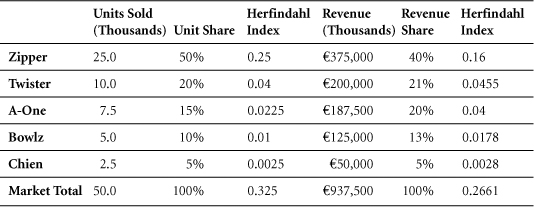
Table 2.3 Calculation of the Herfindahl Index for Small Urban Cars
On a unit basis, the Herfindahl Index is equal to the square of the unit market share of Zipper (50% ^ 2 = 0.25), plus that of Twister (20% ^ 2 = 0.04), plus those of A-One, Bowlz, and Chien = 0.325.
On a revenue basis, the Herfindahl Index comprises the square of the revenue market share of Zipper (40% ^ 2 5 0.16), plus those of all its competitors = 0.2661.
As demonstrated by the Herfindahl Index, the market for small urban cars is slightly more concentrated in unit terms than in revenue terms. The reason for this is straightforward: Higher-priced cars in this market sell fewer units.
Note: For a given number of competitors, the Herfindahl Index would be lowest if shares were equally distributed. In a five-firm industry, for example, equally distributed shares would yield a Herfindahl Index of 5 * (20% ^ 2) = 0.2.
Data Sources, Complications, and Cautions
As ever, appropriate market definition and the use of comparable figures are vital prerequisites to developing meaningful results.
Related Metrics and Concepts
Market Share Rank: The ordinal position of a brand in its market, when competitors are arranged by size, with 1 being the largest.
Share of Category: This metric is derived in the same manner as market share, but is used to denote a share of market within a certain retailer or class of retailers (for example, mass merchandisers).
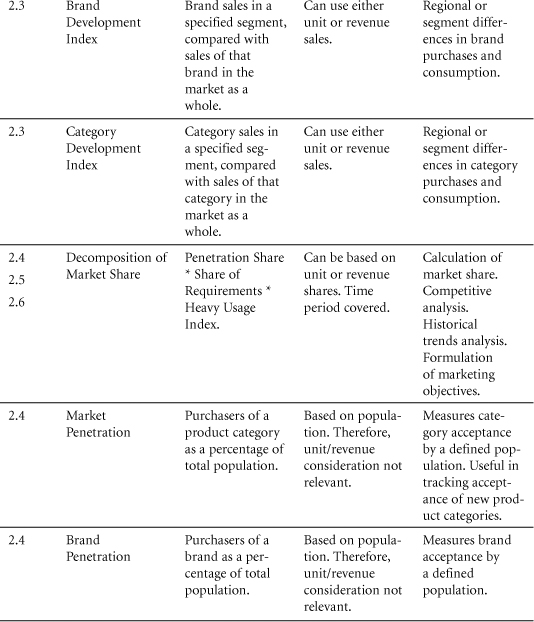
2.3 Brand Development Index and Category Development Index
The category development index (CDI) measures the sales performance of a category of goods or services within a specific group, compared with its average performance among all consumers.
The brand and category development indexes are useful for understanding specific customer segments relative to the market as a whole. Although defined here with respect to households, these indexes could also be calculated for customers, accounts, businesses, or other entities.
Purpose: To understand the relative performance of a brand or category within specified customer groups.
The brand and category development indexes help identify strong and weak segments (usually, demographic or geographic) for particular brands or categories of goods and services. For example, by monitoring the CDI (category development index), marketers might determine that Midwesterners buy twice as many country-western music CDs per capita as Americans in general, while consumers living on the East Coast buy less than the national average. This would be useful information for targeting the launch campaign for a new country-western performer. Conversely, if managers found that a particular product had a low brand development index in a segment that carried a high CDI for its category, they might ask why that brand suffered relatively poor performance in such a promising segment.
Construction
Brand Development Index—BDI (I): An index of how well a brand performs within a given market group, relative to its performance in the market as a whole.
The BDI (brand development index) is a measure of brand sales per person or per household within a specified demographic group or geography, compared with its average sales per person or household in the market as a whole. To illustrate its use: One might hypothesize that sales per capita of Ben & Jerry’s brand ice cream would be greater in the brand’s home state, Vermont, than in the rest of the country. By calculating Ben & Jerry’s BDI for Vermont, marketers could test this hypothesis quantitatively.
EXAMPLE: Oaties is a minor brand of breakfast cereal. Among households without children, its sales run one packet per week per 100 households. In the general population, Oaties’ sales run one packet per week per 80 households. This translates to 1/100 of a packet per household in the childless segment, versus 1/80 of a packet in the general populace.
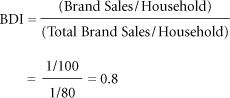
Oaties performs slightly less well in the childless segment than in the market as a whole.
Category Development Index—CDI: An index of how well a category performs within a given market segment, relative to its performance in the market as a whole.
Similar in concept to the BDI, the category development index demonstrates where a category shows strength or weakness relative to its overall performance. By way of example, Boston enjoys high per-capita consumption of ice cream. Bavaria and Ireland both show higher per-capita consumption of beer than Iran.
Data Sources and Complications
In calculating BDI or CDI, a precise definition of the segment under study is vital. Segments are often bounded geographically, but they can be defined in any way for which data can be obtained.
Related Metrics and Concepts
The term category development index has also been applied to retail organizations. In this application, it measures the extent to which a retailer emphasizes one category versus others.
This use of the term is similar to the category performance ratio (see Section 6.6).
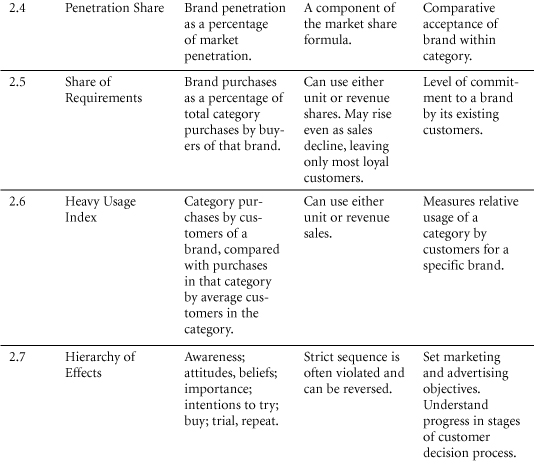
2.4 Penetration
Often, managers must decide whether to seek sales growth by acquiring existing category users from their competitors or by expanding the total population of category users, attracting new customers to the market. Penetration metrics help indicate which of these strategies would be most appropriate and help managers to monitor their success. These equations might also be calculated for usage instead of purchase.
Construction
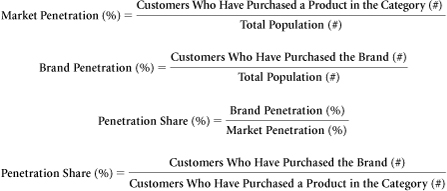
Penetration: The proportion of people in the target who bought (at least once in the period) a specific brand or a category of goods.
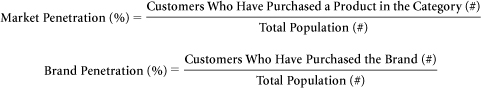
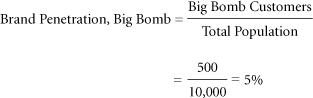
Two key measures of a product’s “popularity” are penetration rate and penetration share. The penetration rate (also called penetration, brand penetration, or market penetration as appropriate), is the percentage of the relevant population that has purchased a given brand or category at least once in the time period under study.
EXAMPLE: Over a period of a month, in a market of 10,000 households, 500 households purchased Big Bomb brand flea foggers.
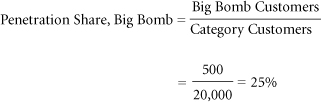
A brand’s penetration share, in contrast to penetration rate, is determined by comparing that brand’s customer population to the number of customers for its category in the relevant market as a whole. Here again, to be considered a customer, one must have purchased the brand or category at least once during the period.
EXAMPLE: Returning to the flea fogger market, during the month in which 500 households purchased Big Bomb, 2,000 households bought at least one product of any brand in this category. This enables us to calculate Big Bomb’s penetration share.
Decomposing Market Share
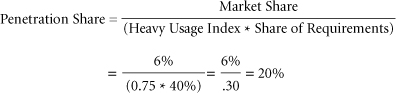
Relationship of Penetration Share to Market Share: Market share can be calculated as the product of three components: penetration share, share of requirements, and heavy usage index.
Market Share (%) = Penetration Share (%) * Share of Requirements (%) * Heavy Usage Index (I)
Share of Requirements: The percentage of customers’ needs in a category that are served by a given brand or product (see Section 2.5).
Heavy Usage Index: A measure of how heavily the people who use a specific product use the entire category of such products (see Section 2.6).
In light of these relationships, managers can use this decomposition of market share to reveal penetration share, given the other inputs.
EXAMPLE: Eat Wheats brand cereal has a market share in Urbanopolis of 6%. The heavy usage index for Eat Wheats cereal is 0.75 in Urbanopolis. Its share of requirements is 40%. From these data, we can calculate the penetration share for Eat Wheats brand cereal in Urbanopolis:
Data Sources, Complications, and Cautions
The time period over which a firm measures penetration can have a significant impact on the penetration rate. For example, even among the most popular detergent brands, many are not purchased weekly. As the time period used to define penetration becomes shorter, managers can expect penetration rates to decline. By contrast, penetration share may be less subject to this dynamic because it represents a comparison between brands, among which the effects of shorter periods may fall approximately evenly.
Related Metrics and Concepts
Total Number of Active Customers: The customers (accounts) who purchased at least once in a given time period. When assessed at a brand level, this is equivalent to brand penetration. This term is often used in shorthand form—total number of customers—though this would not be appropriate when a distinction must be made for ex-customers. This is discussed in more detail in Section 5.1 (customers of a specified recency).
Accepters: Customers who are disposed to accept a given product and its benefits: the opposite of rejecters.
Ever-tried: The percentage of a population that has tried a given brand at any time. (See Section 4.1 for more on trial.)
2.5 Share of Requirements
Many marketers view share of requirements as a key measure of loyalty. This metric can guide a firm’s decisions on whether to allocate resources toward efforts to expand a category, to take customers from competitors, or to increase share of requirements among its established customers. Share of requirements is, in essence, the market share for a brand within a market narrowly defined as the people who have already purchased that brand.
Purpose: To understand the source of market share in terms of breadth and depth of consumer franchise, as well as the extent of relative category usage (heavy users/larger customers versus light users/smaller customers).
Construction
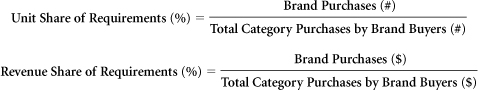
Share of Requirements: A given brand’s share of purchases in its category, measured solely among customers who have already purchased that brand. Also known as share of wallet.
When calculating share of requirements, marketers may consider either dollars or units. They must ensure, however, that their heavy usage index is consistent with this choice.
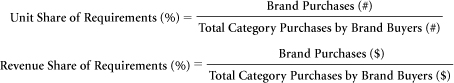
The best way to think about share of requirements is as the average market share enjoyed by a product among the customers who buy it.
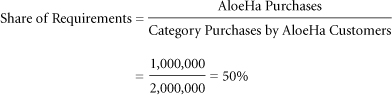
EXAMPLE: In a given month, the unit purchases of AloeHa brand sunscreen ran 1,000,000 bottles. Among the households that bought AloeHa, total purchases of sunscreen came to 2,000,000 bottles.
Share of requirements is also useful in analyzing overall market share. As previously noted, it is part of an important formulation of market share.
Market Share = Penetration Share * Share of Requirements * Heavy Usage Index
Share of requirements can thus be calculated indirectly by decomposing market share.
EXAMPLE: Eat Wheats brand cereal has a market share in Urbanopolis of 8%. The heavy usage index for Eat Wheats in Urbanopolis is 1. The brand’s penetration share in Urbanopolis is 20%. On this basis, we can calculate Eat Wheats’ share of requirements in Urbanopolis:
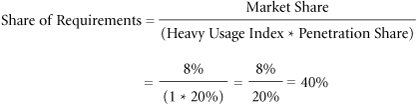
Note that in this example, market share and heavy usage index must both be defined in the same terms (units or revenue). Depending on the definition of these two metrics, the calculated share of requirements will be either unit share of requirements (%) or revenue share of requirements (%).
Data Sources, Complications, and Cautions
Double Jeopardy: Some marketers strive for a “niche” positioning that yields high market share through a combination of low penetration and high share of requirements. That is, they seek relatively few customers but very loyal ones. Before embarking on this strategy, however, a phenomenon known as “double jeopardy” should be considered. Generally, the evidence suggests that it’s difficult to achieve a high share of requirements without also attaining a high penetration share. One reason is that products with high market share generally have high availability, whereas those with low market share may not. Therefore, it can be difficult for customers to maintain loyalty to brands with low market share.
Related Metrics and Concepts
Sole Usage: The fraction of a brand’s customers who use only the brand in question.
Sole Usage Percentage: The proportion of a brand’s customers who use only that brand’s products and do not buy from competitors. Sole users may be die-hard, loyal customers. Alternatively, they may not have access to other options, perhaps because they live in remote areas. Where sole use is 100%, the share of wallet is 100%.
Number of Brands Purchased: During a given period, some customers may buy only a single brand within a category, whereas others buy two or more. In evaluating loyalty to a given brand, marketers can consider the average number of brands purchased by consumers of that brand versus the average number purchased by all customers in that category.
Repeat Rate: The percentage of brand customers in a given period who are also brand customers in the subsequent period.
Repurchase Rate: The percentage of customers for a brand who repurchase that brand on their next purchase occasion.
Confusion abounds in this area. In these definitions, we have tried to distinguish a metric based on calendar time (repeat rate) from one based on “customer time” (repurchase rate). In Chapter 5, “Customer Profitability,” we will describe a related metric, retention, which is used in contractual situations in which the first non-renewal (non-purchase) signals the end of a customer relationship. Although we suggest that the term retention be applied only in contractual situations, you will often see repeat rates and repurchase rates referred to as “retention rates.” Due to a lack consensus on the use of these terms, marketers are advised not to rely on the names of these metrics as perfect indicators of how they are calculated.
The importance of repeat rate depends on the time period covered. Looking at one week’s worth of purchases is unlikely to be very illuminating. In a given category, most consumers only buy one brand in a week. By contrast, over a period of years, consumers may buy several brands that they do not prefer, on occasions when they can’t find the brand to which they seek to be loyal. Consequently, the right period to consider depends on the product under study and the frequency with which it is bought. Marketers are advised to take care to choose a meaningful period.
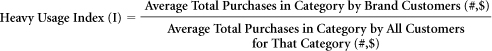
2.6 Heavy Usage Index
or
The heavy usage index, also called the weight index, yields insight into the source of volume and the nature of a brand’s customer base.
Purpose: To define and measure whether a firm’s consumers are “heavy users.”
The heavy usage index answers the question, “How heavily do our customers use the category of our product?” When a brand’s heavy usage index is greater than 1.0, this signifies that its customers use the category to which it belongs more heavily than the average customer for that category.
Construction
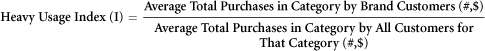
Heavy Usage Index: The ratio that compares the average consumption of products in a category by customers of a given brand with the average consumption of products in that category by all customers for the category.
The heavy usage index can be calculated on the basis of unit or dollar inputs. For a given brand, if the heavy usage index is greater than 1.0, that brand’s customers consume an above-average quantity or value of products in the category.
As previously noted, market share can be calculated as the product of three components: penetration share, share of requirements, and heavy usage index (see Section 2.4). Consequently, we can calculate a brand’s heavy usage index if we know its market share, penetration share, and share of requirements, as follows:
This equation works for market shares defined in either unit or dollar terms. As noted earlier, the heavy usage index can measure either unit or dollar usage. Comparing a brand’s unit heavy usage index to its dollar heavy usage index, marketers can determine whether category purchases by that brand’s customers run above or below the average category price.
Data Sources, Complications, and Cautions
The heavy usage index does not indicate how heavily customers use a specific brand, only how heavily they use the category. A brand can have a high heavy usage index, for example, meaning that its customers are heavy category users, even if those customers use the brand in question to meet only a small share of their needs.
Related Metrics and Concepts
See also the discussion of brand development index (BDI) and category development index (CDI) in Section 2.3.
2.7 Awareness, Attitudes, and Usage (AAU): Metrics of the Hierarchy of Effects
AAU studies are most useful when their results are set against a clear comparator. This benchmark may comprise the data from prior periods, different markets, or competitors.
Purpose: To track trends in customer attitudes and behaviors.
Awareness, attitudes, and usage (AAU) metrics relate closely to what has been called the Hierarchy of Effects, an assumption that customers progress through sequential stages from lack of awareness, through initial purchase of a product, to brand loyalty (see Figure 2.2). AAU metrics are generally designed to track these stages of knowledge, beliefs, and behaviors. AAU studies also may track “who” uses a brand or product—in which customers are defined by category usage (heavy/light), geography, demographics, psychographics, media usage, and whether they purchase other products.
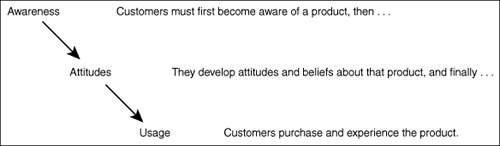
Figure 2.2 Awareness, Attitudes, and Usage: Hierarchy of Effects
Information about attitudes and beliefs offers insight into the question of why specific users do, or do not, favor certain brands. Typically, marketers conduct surveys of large samples of households or business customers to gather these data.
Construction
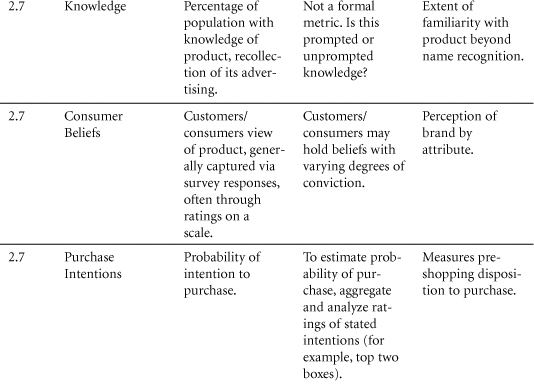
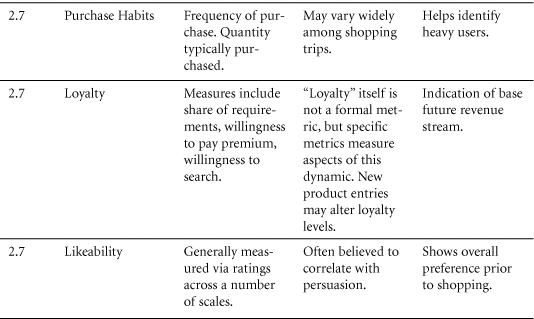
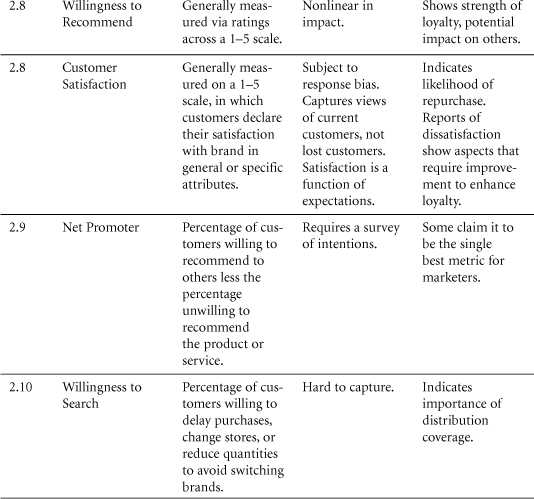
Awareness, attitudes, and usage studies feature a range of questions that aim to shed light on customers’ relationships with a product or brand (see Table 2.4). For example, who are the acceptors and rejecters of the product? How do customers respond to a replay of advertising content?
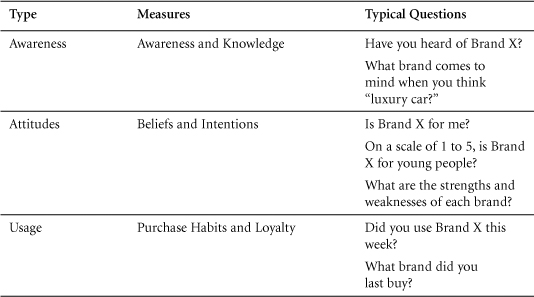
Table 2.4 Awareness, Attitudes, and Usage: Typical Questions
Marketers use answers to these questions to construct a number of metrics. Among these, certain “summary metrics” are considered important indicators of performance. In many studies, for example, customers’ “willingness to recommend” and “intention to purchase” a brand are assigned high priority. Underlying these data, various diagnostic metrics help marketers understand why consumers may be willing—or unwilling—to recommend or purchase that brand. Consumers may not have been aware of the brand, for example. Alternatively, they may have been aware of it but did not subscribe to one of its key benefit claims.
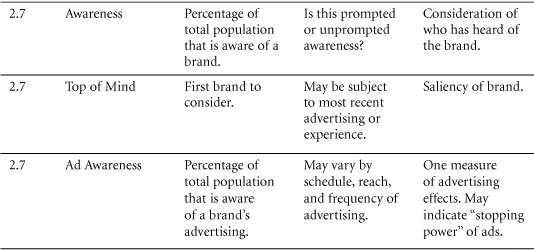
Awareness and Knowledge
Marketers evaluate various levels of awareness, depending on whether the consumer in a given study is prompted by a product’s category, brand, advertising, or usage situation.
Awareness: The percentage of potential customers or consumers who recognize—or name—a given brand. Marketers may research brand recognition on an “aided” or “prompted” level, posing such questions as, “Have you heard of Mercedes?” Alternatively, they may measure “unaided” or “unprompted” awareness, posing such questions as, “Which makes of automobiles come to mind?”
Top of Mind: The first brand that comes to mind when a customer is asked an unprompted question about a category. The percentage of customers for whom a given brand is top of mind can be measured.
Ad Awareness: The percentage of target consumers or accounts who demonstrate awareness (aided or unaided) of a brand’s advertising. This metric can be campaign- or media-specific, or it can cover all advertising.
Brand/Product Knowledge: The percentage of surveyed customers who demonstrate specific knowledge or beliefs about a brand or product.
Attitudes
Measures of attitude concern consumer response to a brand or product. Attitude is a combination of what consumers believe and how strongly they feel about it. Although a detailed exploration of attitudinal research is beyond the scope of this book, the following summarizes certain key metrics in this field.
Attitudes/Liking/Image: A rating assigned by consumers—often on a scale of 1–5 or 1–7—when survey respondents are asked their level of agreement with such propositions as, “This is a brand for people like me,” or “This is a brand for young people.” A metric based on such survey data can also be called relevance to customer.
Perceived Value for Money: A rating assigned by consumers—often on a scale of 1–5 or 1–7—when survey respondents are asked their level of agreement with such propositions as, “This brand usually represents a good value for the money.”
Perceived Quality/Esteem: A consumer rating—often on a scale of 1–5 or 1–7—of a given brand’s product when compared with others in its category or market.
Relative Perceived Quality: A consumer rating (often from 1–5 or 1–7) of brand product compared to others in the category/market.
Intentions: A measure of customers’ stated willingness to behave in a certain way. Information on this subject is gathered through such survey questions as, “Would you be willing to switch brands if your favorite was not available?”
Purchase Intentions: A specific measure or rating of consumers’ stated purchase intentions. Information on this subject is gathered through survey respondents’ reactions to such propositions as, “It is very likely that I will purchase this product.”
Usage
Measures of usage concern such market dynamics as purchase frequency and units per purchase. They highlight not only what was purchased, but also when and where it was purchased. In studying usage, marketers also seek to determine how many people have tried a brand. Of those, they further seek to determine how many have “rejected” the brand, and how many have “adopted” it into their regular portfolio of brands.
Usage: A measure of customers’ self-reported behavior.
In measuring usage, marketers pose such questions as the following: What brand of toothpaste did you last purchase? How many times in the past year have you purchased toothpaste? How many tubes of toothpaste do you currently have in your home? Do you have any Crest toothpaste in your home at the current time?
In the aggregate, AAU metrics concern a vast range of information that can be tailored to specific companies and markets. They provide managers with insight into customers’ overall relationships with a given brand or product.
Data Sources, Complications, and Cautions
Sources of AAU data include
• Warranty cards and registrations, often using prizes and random drawings to encourage participation.
• Regularly administered surveys, conducted by organizations that interview consumers via telephone, mail, Web, or other technologies, such as hand-held scanners.
Even with the best methodologies, however, variations observed in tracking data from one period to the next are not always reliable. Managers must rely on their experience to distinguish seasonality effects and “noise” (random movement) from “signal” (actual trends and patterns). Certain techniques in data collection and review can also help managers make this distinction.
1. Adjust for periodic changes in how questions are framed or administered. Surveys can be conducted via mail or telephone, for example, among paid or unpaid respondents. Different data-gathering techniques may require adjustment in the norms used to evaluate a “good” or “bad” response. If sudden changes appear in the data from one period to the next, marketers are advised to determine whether methodological shifts might play a role in this result.
2. Try to separate customer from non-customer responses; they may be very different. Causal links among awareness, attitudes, and usage are rarely clear-cut. Though the hierarchy of effects is often viewed as a one-way street, on which awareness leads to attitudes, which in turn determine usage, the true causal flow might also be reversed. When people own a brand, for example, they may be predisposed to like it.
3. Triangulate customer survey data with sales revenue, shipments, or other data related to business performance. Consumer attitudes, distributor and retail sales, and company shipments may move in different directions. Analyzing these patterns can be a challenge but can reveal much about category dynamics. For example, toy shipments to retailers often occur well in advance of the advertising that drives consumer awareness and purchase intentions. These, in turn, must be established before retail sales. Adding further complexity, in the toy industry, the purchaser of a product might not be its ultimate consumer. In evaluating AAU data, marketers must understand not only the drivers of demand but also the logistics of purchase.
4. Separate leading from lagging indicators whenever possible. In the auto industry, for example, individuals who have just purchased a new car show a heightened sensitivity to advertisements for its make and model. Conventional wisdom suggests that they’re looking for confirmation that they made a good choice in a risky decision. By helping consumers justify their purchase at this time, auto manufacturers can strengthen long-term satisfaction and willingness to recommend.
Related Metrics and Concepts
Likeability: Because AAU considerations are so important to marketers, and because there is no single “right” way to approach them, specialized and proprietary systems have been developed. Of these, one of the best known is the Q scores rating of “likeability.” A Q Score is derived from a general survey of selected households, in which a large panel of consumers share their feelings about brands, celebrities, and television shows.4
Q Scores rely upon responses reported by consumers. Consequently, although the system used is sophisticated, it is dependent on consumers understanding and being willing to reveal their preferences.
Segmentation by Geography, or Geo-clustering: Marketers can achieve insight into consumer attitudes by separating their data into smaller, more homogeneous groups of customers. One well-known example of this is Prizm. Prizm assigns U.S. households to clusters based on ZIP Code,5 with the goal of creating small groups of similar households. The typical characteristics of each Prizm cluster are known, and these are used to assign a name to each group. “Golden Ponds” consumers, for example, comprise elderly singles and couples leading modest lifestyles in small towns. Rather than monitoring AAU statistics for the population as a whole, firms often find it useful to track these data by cluster.
2.8 Customer Satisfaction and Willingness to Recommend
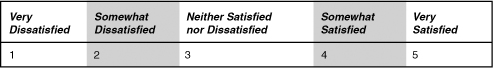
Figure 2.3 Ratings
Within organizations, customer satisfaction ratings can have powerful effects. They focus employees on the importance of fulfilling customers’ expectations. Furthermore, when these ratings dip, they warn of problems that can affect sales and profitability.
A second important metric related to satisfaction is willingness to recommend. When a customer is satisfied with a product, he or she might recommend it to friends, relatives, and colleagues. This can be a powerful marketing advantage.
Purpose: Customer satisfaction provides a leading indicator of consumer purchase intentions and loyalty.
Customer satisfaction data are among the most frequently collected indicators of market perceptions. Their principal use is twofold.
1. Within organizations, the collection, analysis, and dissemination of these data send a message about the importance of tending to customers and ensuring that they have a positive experience with the company’s goods and services.
2. Although sales or market share can indicate how well a firm is performing currently, satisfaction is perhaps the best indicator of how likely it is that the firm’s customers will make further purchases in the future. Much research has focused on the relationship between customer satisfaction and retention. Studies indicate that the ramifications of satisfaction are most strongly realized at the extremes. On the scale in Figure 2.3, individuals who rate their satisfaction level as “5” are likely to become return customers and might even evangelize for the firm. Individuals who rate their satisfaction level as “1,” by contrast, are unlikely to return. Further, they can hurt the firm by making negative comments about it to prospective customers. Willingness to recommend is a key metric relating to customer satisfaction.
Construction
Customer Satisfaction: The number of customers, or percentage of total customers, whose reported experience with a firm, its products, or its services (ratings) exceeds specified satisfaction goals.
Willingness to Recommend: The percentage of surveyed customers who indicate that they would recommend a brand to friends.
These metrics quantify an important dynamic. When a brand has loyal customers, it gains positive word-of-mouth marketing, which is both free and highly effective.
Customer satisfaction is measured at the individual level, but it is almost always reported at an aggregate level. It can be, and often is, measured along various dimensions. A hotel, for example, might ask customers to rate their experience with its front desk and check-in service, with the room, with the amenities in the room, with the restaurants, and so on. Additionally, in a holistic sense, the hotel might ask about overall satisfaction “with your stay.”
Customer satisfaction is generally measured on a five-point scale (see Figure 2.4).
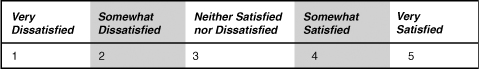
Figure 2.4 A Typical Five-Point Scale
Satisfaction levels are usually reported as either “top box” or, more likely, “top two boxes.” Marketers convert these expressions into single numbers that show the percentage of respondents who checked either a “4” or a “5.” (This term is the same as that commonly used in projections of trial volumes; see Section 4.1.)
EXAMPLE: The general manager of a hotel in Quebec institutes a new system of customer satisfaction monitoring (see Figure 2.5). She leaves satisfaction surveys at checkout. As an incentive to respond, all respondents are entered into a drawing for a pair of free airline tickets.
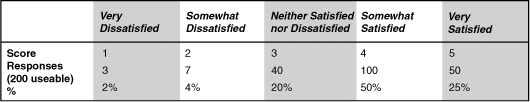
Figure 2.5 Hotel Customer Survey Response
The manager collects 220 responses, of which 20 are unclear or otherwise unusable. Among the remaining 200, 3 people rate their overall experience at the hotel as very unsatisfactory, 7 deem it somewhat unsatisfactory, and 40 respond that they are neither satisfied nor dissatisfied. Of the remainder, 50 customers say they are very satisfied, while the rest are somewhat satisfied.
The top box, comprising customers who rate their experience a “5,” includes 50 people or, as a percentage, 50/200 = 25%. The top two boxes comprise customers who are “somewhat” or “very” satisfied, rating their experience a “4” or “5.” In this example, the “somewhat satisfied” population must be calculated as the total usable response pool, less customers accounted for elsewhere, that is, 200 – 3 – 7 – 40 – 50 = 100. The sum of the top two boxes is thus 50 + 100 = 150 customers, or 75% of the total.
Customer satisfaction data can also be collected on a 10-point scale. Regardless of the scale used, the objective is to measure customers’ perceived satisfaction with their experience of a firm’s offerings. Marketers then aggregate these data into a percentage of top-box responses.
In researching satisfaction, firms generally ask customers whether their product or service has met or exceeded expectations. Thus, expectations are a key factor behind satisfaction. When customers have high expectations and the reality falls short, they will be disappointed and will likely rate their experience as less than satisfying. For this reason, a luxury resort, for example, might receive a lower satisfaction rating than a budget motel—even though its facilities and service would be deemed superior in “absolute” terms.
Data Sources, Complications, and Cautions
Surveys constitute the most frequently used means of collecting satisfaction data. As a result, a key risk of distortion in measures of satisfaction can be summarized in a single question: Who responds to surveys?
“Response bias” is endemic in satisfaction data. Disappointed or angry customers often welcome a means to vent their opinions. Contented customers often do not. Consequently, although many customers might be happy with a product and feel no need to complete a survey, the few who had a bad experience might be disproportionately represented among respondents. Most hotels, for example, place response cards in their rooms, asking guests, “How was your stay?’ Only a small percentage of guests ever bother to complete those cards. Not surprisingly, those who do respond probably had a bad experience. For this reason, marketers can find it difficult to judge the true level of customer satisfaction. By reviewing survey data over time, however, they may discover important trends or changes. If complaints suddenly rise, for example, that may constitute early warning of a decline in quality or service. (See number of complaints in the following section.)
Sample selection may distort satisfaction ratings in other ways as well. Because only customers are surveyed for customer satisfaction, a firm’s ratings may rise artificially as deeply dissatisfied customers take their business elsewhere. Also, some populations may be more frank than others, or more prone to complain. These normative differences can affect perceived satisfaction levels. In analyzing satisfaction data, a firm might interpret rating differences as a sign that one market is receiving better service than another, when the true difference lies only in the standards that customers apply. To correct for this issue, marketers are advised to review satisfaction measures over time within the same market.
A final caution: Because many firms define customer satisfaction as “meeting or exceeding expectations,” this metric may fall simply because expectations have risen. Thus, in interpreting ratings data, managers may come to believe that the quality of their offering has declined when that is not the case. Of course, the reverse is also true. A firm might boost satisfaction by lowering expectations. In so doing, however, it might suffer a decline in sales as its product or service comes to appear unattractive.
Related Metrics and Concepts
Trade Satisfaction: Founded upon the same principles as consumer satisfaction, trade satisfaction measures the attitudes of trade customers.
Number of Complaints: The number of complaints lodged by customers in a given time period.
2.9 Net Promoter6
Net Promoter Score (I) = Percentage of Promoters (%) – Percentage of Detractors (%)
Net promoter is claimed to be a particularly useful measure of customer satisfaction and/or loyalty.
Purpose: To measure how well the brand or company is succeeding in creating satisfied, loyal customers.
Net Promoter Score7 (NPS) is a registered trademark of Frederick R. Reichheld, Bain & Company, and Satmetrix that is a particularly simple measure of the satisfaction/loyalty of current customers. Customers are surveyed and asked (on a ten-point scale) how likely they are to recommend the company or brand to a friend or colleague. Based on their answers to this single question, customers are divided into
• Promoters: Customers who are willing to recommend the company to others (who gave the company a rating of 9 or 10).
• Passives: Satisfied but unenthusiastic customers (ratings of 7 or 8).
• Detractors: Customers who are unwilling to recommend the company to others (ratings of 0 to 6).
High NPSs generally mean that a company is doing a good job of securing their customers’ loyalty and active evangelism. Low and negative Net Promoter Scores are important early warning signals for the firm. Because the metric is simple and easy to understand, it provides a stable measure companies use to motivate employees and monitor progress.
Construction
The Net Promoter Score (NPS) is created by subtracting the percentage of detractors among current customers from the percentage of promoters among current customers.
Net Promoter Score (I) = Percentage of Promoters (%) – Percentage of Detractors (%)
For example if a survey of a company’s customers reports that there were 20% promoters, 70% passives, and 10% detractors, the company would have a Net Promoter Score of 20–10 = 10.
Data Sources, Complications and Cautions
Although the trademarked NPS asks a specific question, uses a 10-point scale, and defines promoters, passives, and detractors in a particular way (detractors are those giving ratings of 0 through 6), it is easy to imagine other versions of NPS that differ with respect to the wording of the question, the scale used (1 through 5 rather than 0 through 10), and the definitions (and labels) of the resulting groups of responders. The defining features of NPS are that it is constructed from responses to a question about willingness to recommend and is a net measure found by subtracting the fraction unwilling to recommend from the fraction willing to recommend and leaving out those in the middle.
The same NPS score can indicate different business circumstances. For instance, a Net Promoter Score of zero can indicate highly polarized customers, 50% promoters, 50% detractors, or a totally ambivalent customer base, 100% passives. Getting the NPS score may be a good way of starting a discussion about customer perceptions of the brand. As it is an average of current customers’ responses, managers must drill down to the data to understand the precise situation their business faces.
This score in specific circumstances can generate results that could mislead a manager who is not being careful. For example, consider a company whose current customers are 30% promoters, 30% detractors, and 40% passives. This company’s NPS is an unimpressive zero, or 30%-30%.
Suppose next that a new competitor steals two-thirds of the company’s detractors, and because these detractors immediately defect to the new competitor, they cease to be customers of the company. The NPS is remeasured.
Promoters are now 30% / (100% – 20% = 80%) = 37.5% of the customers that remain.
Passives are now 40% / (100% – 20% = 80%) = 50% of the customers that remain.
Detractors are now only (30% – 20% = 10%) / (100% – 20% = 80%) = 12.5% of the customers that remain.
The NPS is now 37.5% – 12.5% = a very healthy looking + 25.
The defection of the most vulnerable and unhappy customers led directly to an increase in NPS. Managers should make sure they fully understand what has happened.
While benchmarking is often a useful exercise, it is inappropriate to directly apply this measure across categories. Some products are in categories that are more likely to gain engagement both positive and negative than others.
A high Net Promoter Score while generally desirable does beg the question whether the company is properly monetizing the value they are providing to the consumer. The easiest way to develop a high Net Promoter Score is to provide a highly valued product free to customers. Why wouldn’t they be happy to recommend you? While there may be strategic reasons for situations like this to be acceptable to the company in the short or medium term, this probably won’t be a viable long-term strategy.
The Net Promoter Score is calculated from survey data. As such it may suffer from the problems common to most surveys, and the results should be interpreted in light of other data, such as sales trends. Is increased customer satisfaction leading to increased sales? If so, fine; if not, why not?
Although the Net Promoter Score has received much attention and relatively rapid adoption, it has also been the target of a recent award-winning article. Consultant Timothy Keiningham and his co-authors claim the benefits of the measure have been overstated relative to other measures of loyalty and satisfaction.8
2.10 Willingness to Search
Willingness to Search (%) = Percentage of Customers Willing to Delay Purchases, Change Stores, or Reduce Purchase Quantities to Avoid Switching Brands
This metric can tell a company much about the attitudes of its customers and whether its position in the market is likely to be defensible against sustained pressure from a competitor.
Purpose: To assess the commitment of a firm’s or a brand’s customer base.
Brand or company loyalty is a key marketing asset. Marketers evaluate aspects of it through a number of metrics, including repurchase rate, share of requirements, willingness to pay a price premium, and other AAU measures. Perhaps the most fundamental test of loyalty, however, can be captured in a simple question: When faced with a situation in which a brand is not available, will its customers search further or substitute the best available option?
When a brand enjoys loyalty at this level, its provider can generate powerful leverage in trade negotiations. Often, such loyalty will also give providers time to respond to a competitive threat. Customers will stay with them while they address the threat.
Loyalty is grounded in a number of factors, including
• Satisfied and influential customers who are willing to recommend the brand.
• Hidden values or emotional benefits, which are effectively communicated.
• A strong image for the product, the user, or the usage experience.
Purchase-based loyalty metrics are also affected by whether a product is broadly and conveniently available for purchase, and whether customers enjoy other options in its category.
Construction
Willingness to Search: The likelihood that customers will settle for a second-choice product if their first choice is not available. Also called “accept no substitutes.”
Willingness to search represents the percentage of customers who are willing to leave a store without a product if their favorite brand is unavailable. Those willing to substitute constitute the balance of the population.
Data Sources, Complications, and Cautions
Loyalty has multiple dimensions. Consumers who are loyal to a brand in the sense of rarely switching may or may not be willing to pay a price premium for that brand or recommend it to their friends. Behavioral loyalty may also be difficult to distinguish from inertia or habit. When asked about loyalty, consumers often don’t know what they will do in new circumstances. They may not have accurate recall about past behavior, especially in regard to items with which they feel relatively low involvement.
Furthermore, different products generate different levels of loyalty. Few customers will be as loyal to a brand of matches, for example, as to a brand of baby formula. Consequently, marketers should exercise caution in comparing loyalty rates across products. Rather, they should look for category-specific norms.
Degrees of loyalty also differ between demographic groups. Older consumers have been shown to demonstrate the highest loyalty rates.
Even with these complexities, however, customer loyalty remains one of the most important metrics to monitor. Marketers should understand the worth of their brands in the eyes of the customer—and of the retailer.