5
DEBUGGING WITH LLDB AND FRIENDS
Debugging iOS applications is considered one of Xcode’s strong components. In addition to the useful analysis features of DTrace, Xcode has a command line debugger with a relatively approachable graphical interface. As part of Apple’s migration away from GNU utilities, the default debugger is now lldb,1 which provides first-class support for Objective-C. Multithreaded debugging is well-supported, and you can even inspect objects from the debugger. The only downside is that you’ll have to translate your hard-won knowledge of gdb to a new environment.
Debugging is a vast topic, and there are multiple books on the subject.2 This chapter covers the basics for people new to Xcode, along with tips relevant to security testing and secure development. I assume you have some familiarity with gdb and debuggers in general.
Useful Features in lldb
Xcode’s built-in debugger interface is fairly powerful. It has a command line, but you can also use the GUI to view and interact with the current thread state, annotated assembly, and object details. The GUI includes a central breakpoint browser as well, where you can view, enable, and disable breakpoints.
NOTE
If you’re extremely comfortable using gdb, the LLVM project has a mapping of frequently used gdb commands to their lldb equivalents; see http://lldb.llvm.org/lldb-gdb.html.
Working with Breakpoints
You can set breakpoints graphically from Xcode’s lldb interface (see Figure 5-1), or you can do so from the command line. In addition to breaking when the program accesses a particular memory address or C function, you can also break on specific Objective-C methods.

Figure 5-1: Xcode’s lldb interface
Here are some of the ways you can set breakpoints:
➊ (lldb) breakpoint set --name myfunction --name myotherfunction
➋ (lldb) breakpoint set --name "-[myClass methodCall:]"
➌ (lldb) breakpoint set --selector myObjCSelector:
➍ (lldb) breakpoint set --method myCPlusPlusMethod
The command at ➊ sets one breakpoint on multiple functions, a feature you can use to enable and disable groups of functions simultaneously. As shown at ➋, you can also break on specific Objective-C instance and class methods—these can be also be grouped in a manner similar to the C function calls at ➊. If you want to break on all calls to a particular selector/method, use the --selector option ➌, which will break on any calls to a selector of this name, regardless of what class they’re implemented in. Finally, to break on specific C++ methods, simply specify --method instead of --name when defining the breakpoint, as at ➍.
In practice, setting a breakpoint in lldb looks like this:
(lldb) breakpoint set --name main
Breakpoint 2: where = StatePreservator`main + 34 at main.m:15, address = 0x00002822
(lldb) breakpoint set -S encodeRestorableStateWithCoder:
Breakpoint 2: where = StatePreservator`-[StatePreservatorSecondViewController
encodeRestorableStateWithCoder:] + 44 at StatePreservatorSecondViewController.
m:25, address = 0x00002d5c
After you set a breakpoint, lldb shows the code you’re breaking on. If you like, you can make this even simpler: like gdb, lldb recognizes keywords using the shortest matching text. So breakpoint can be shortened to break, or even b.
In the GUI, you can break on a particular line of code by clicking the number in the gutter to the left of the line (see Figure 5-2). Clicking again will disable the breakpoint. Alternatively, you can break on lines from the lldb CLI using the --file filename.m --line 66 syntax.

Figure 5-2: Setting breakpoints on specific lines with the mouse. Deactivated breakpoints are shaded a lighter gray.
When you want to create multiple breakpoints, it can be handy to use the -r flag at the command line to break on functions matching a particular regular expression, like so:
(lldb) break set -r tableView
Breakpoint 1: 4 locations.
(lldb) break list
Current breakpoints:
1: source regex = "tableView", locations = 4, resolved = 4
1.1: where = DocInteraction`-[DITableViewController tableView:
cellForRowAtIndexPath:] + 695 at DITableViewController.m:225, address = 0
x000032c7, resolved, hit count = 0
1.2: where = DocInteraction`-[DITableViewController tableView:
cellForRowAtIndexPath:] + 1202 at DITableViewController.m:245, address = 0
x000034c2, resolved, hit count = 0
1.3: where = DocInteraction`-[DITableViewController tableView:
cellForRowAtIndexPath:] + 1270 at DITableViewController.m:246, address = 0
x00003506, resolved, hit count = 0
1.4: where = DocInteraction`-[DITableViewController tableView:
cellForRowAtIndexPath:] + 1322 at DITableViewController.m:247, address = 0
x0000353a, resolved, hit count = 0
This will set a single breakpoint with a number of locations. Each location can be enabled and disabled, as shown here:
(lldb) break dis 1.4
1 breakpoints disabled.
(lldb) break list
Current breakpoints:
1: source regex = ".*imageView.*", locations = 4, resolved = 3
--snip--
1.4: where = DocInteraction`-[DITableViewController tableView:
cellForRowAtIndexPath:] + 1322 at DITableViewController.m:247, address = 0
x0000353a, unresolved, hit count = 0 Options: disabled
(lldb) break en 1.4
1 breakpoints disabled.
Notice that enabling and disabling locations works just like a regular breakpoint; just use break disable and break enable and reference the right numeric identifier.
Navigating Frames and Variables
Once you’ve arrived at a breakpoint, you can use lldb to examine the state of your program. You can do this via either the command line, as in the other lldb examples I’ve shown, or the visual lldb browser, as in Figure 5-3.

Figure 5-3: Examining frame variables from the command line and the GUI
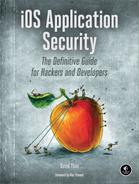
In addition to viewing and manipulating the variables of the current frame, you can navigate the program threads and frames of the call stack using the Debug Navigator, as shown in Figure 5-4.
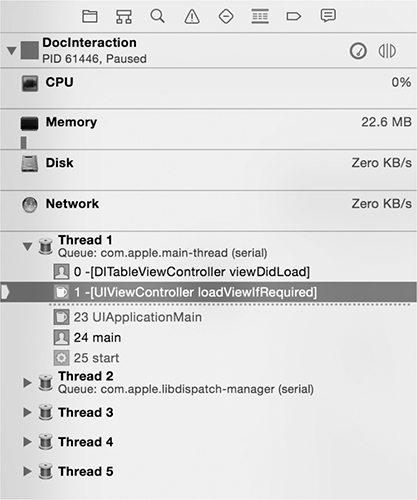
Figure 5-4: Using the Debug Navigator to switch frames and threads
Similar to using gdb, you can inspect the call stack of the current thread with the bt (short for backtrace) command (see Listing 5-1). Normally, you could also navigate frames using the typical up, down, and frame select commands. In some versions of Xcode however, a bug causes the frame to immediately revert to the frame selected in the Debug Navigator. In that case, you must switch frames manually within the Debug Navigator to inspect them individually.
(lldb) bt
* thread #1: tid = 0x11804c, 0x00002c07 StatePreservator`-[
StatePreservatorSecondViewController encodeRestorableStateWithCoder:](self=0
x07733c30, _cmd=0x005af437, coder=0x0756faf0) + 55 at
StatePreservatorSecondViewController.m:25, queue = 'com.apple.main-thread,
stop reason = breakpoint 1.1
frame #0: 0x00002c07 StatePreservator`-[StatePreservatorSecondViewController
encodeRestorableStateWithCoder:](self=0x07733c30, _cmd=0x005af437, coder=0
x0756faf0) + 55 at StatePreservatorSecondViewController.m:25
frame #1: 0x000277e7 UIKit`-[UIApplication(StateRestoration)
_saveApplicationPreservationState:] + 1955
frame #2: 0x00027017 UIKit`-[UIApplication(StateRestoration)
_saveApplicationPreservationStateIfSupported] + 434
frame #3: 0x0001b07b UIKit`-[UIApplication _handleApplicationSuspend:eventInfo
:] + 947
frame #4: 0x00023e74 UIKit`-[UIApplication handleEvent:withNewEvent:] + 1469
frame #5: 0x00024beb UIKit`-[UIApplication sendEvent:] + 85
frame #6: 0x00016698 UIKit`_UIApplicationHandleEvent + 9874
frame #7: 0x01beddf9 GraphicsServices`_PurpleEventCallback + 339
frame #8: 0x01bedad0 GraphicsServices`PurpleEventCallback + 46
frame #9: 0x01c07bf5 CoreFoundation`
__CFRUNLOOP_IS_CALLING_OUT_TO_A_SOURCE1_PERFORM_FUNCTION__ + 53
frame #10: 0x01c07962 CoreFoundation`__CFRunLoopDoSource1 + 146
frame #11: 0x01c38bb6 CoreFoundation`__CFRunLoopRun + 2118
frame #12: 0x01c37f44 CoreFoundation`CFRunLoopRunSpecific + 276
frame #13: 0x01c37e1b CoreFoundation`CFRunLoopRunInMode + 123
frame #14: 0x01bec7e3 GraphicsServices`GSEventRunModal + 88
frame #15: 0x01bec668 GraphicsServices`GSEventRun + 104
frame #16: 0x00013ffc UIKit`UIApplicationMain + 1211
frame #17: 0x0000267d StatePreservator`main(argc=1, argv=0xbffff13c) + 141 at
main.m:16
Listing 5-1: Getting the current call stack with the backtrace command
To examine the variables of the current frame, you can use the frame variable command, as shown in Listing ??.
(lldb) frame variable
(StatePreservatorSecondViewController *const) self = 0x0752d2e0
(SEL) _cmd = "encodeRestorableStateWithCoder:"
(NSCoder *) coder = 0x0d0234e0
Listing 5-2: Using the frame variable command
This will give you variable names and arguments of the local stack frame, along with their types and memory addresses. You can also use the context menu in the graphical debugger to print or edit variable contents; see Figure 5-5.
If you use frame select on its own, you can also see the program’s location in the call stack, along with the relevant surrounding lines of code, as in this example:
(lldb) frame select
frame #0: 0x00002d5c StatePreservator`-[StatePreservatorSecondViewController
encodeRestorableStateWithCoder:](self=0x0752d2e0, _cmd=0x005af437, coder=0
x0d0234e0) + 44 at StatePreservatorSecondViewController.m:25
22
23 -(void)encodeRestorableStateWithCoder:(NSCoder *)coder
24 {
-> 25 [coder encodeObject:[_myTextView text] forKey:@"UnsavedText"];
26 [super encodeRestorableStateWithCoder:coder];
27 }
28

Figure 5-5: The variable context menu, showing options for printing variable contents, setting watchpoints, and viewing memory contents
The frame select command also takes a numeric argument for the stack frame you want to inspect, if you’d like to look further up the call stack (see Listing 5-3).
(lldb) frame select 4
frame #4: 0x00023e74 UIKit`-[UIApplication handleEvent:withNewEvent:] + 1469
UIKit`-[UIApplication handleEvent:withNewEvent:] + 1469:
-> 0x23e74: xorb %cl, %cl
0x23e76: jmp 0x24808
; -[UIApplication handleEvent:withNewEvent:] + 3921
0x23e7b: movl 16(%ebp), %ebx
0x23e7e: movl %ebx, (%esp)
Listing 5-3: Assembly shown while examining a stack frame
Note that for code outside of your current project, such as other parts of the Cocoa API, the source will usually not be available; lldb will instead show you the relevant assembly instructions.3
You can also inspect the values of objects using lldb’s po (short for print object) command. For example, consider the following:
(lldb) po [self window]
$2 = 0x071848d0 <UIWindow: 0x71848d0; frame = (0 0; 320 480); hidden = YES; layer =
<UIWindowLayer: 0x71849a0>>
Using po on your main window fetches the addresses and attributes of that window.
Visually Inspecting Objects
If you’re using Xcode 5 or later, you can also hover the mouse over objects to inspect the contents, as shown in Figure 5-6. If you drill down into individual subobjects, you can either view their memory directly (Figure 5-7) by clicking the i button or use the Quick Look “eye” button to see the contents of the object represented as a fully rendered image, text, or any other data type that OS X’s Quick Look API understands (see Figure 5-8). This is, in my opinion, pretty badass.

Figure 5-6: Inspecting an object while at a breakpoint

Figure 5-7: Inspecting an object’s contents in memory

Figure 5-8: Examining the current state of a variable with the Quick Look button. In this case, you’re looking at the _statusBar of the UIApplication delegate window, which Xcode will display as an actual image.
Manipulating Variables and Properties
You can do more than just view the contents of variables and objects from lldb. For example, let’s try breaking on the same line used to test the frame variable command back in Listing 5-2.
[coder encodeObject:[_myTextView text] forKey:@"UnsavedText"];
When the debugger reaches this line, imagine you want to examine the contents of UITextView’s text attribute and change its value before the program continues. You can do this with the expr command, using traditional Objective-C syntax, as follows:
(lldb) po [_myTextView text]
$0 = 0x08154cb0 Foo
(lldb) expr (void)[_myTextView setText:@"Bar"]
(lldb) po [_myTextView text]
$1 = 0x0806b2e0 Bar
(lldb) cont
When execution resumes, the value of that text box in the UI should have changed. Because lldb doesn’t know the return type of a method called in this way, you have to specify the type using (void) with the expr command. Similarly, if you were calling something that returned an int, you’d need to explicitly cast to that type instead. For simple assignment operations, like myInteger = 666 or similar, as opposed to method calls, simply enter expr and the assignment as one command.
NOTE
When using lldb from the command line in Xcode, the GUI will autocomplete object method names, giving you a brief description and their return type. See Figure 5-9 for an example.
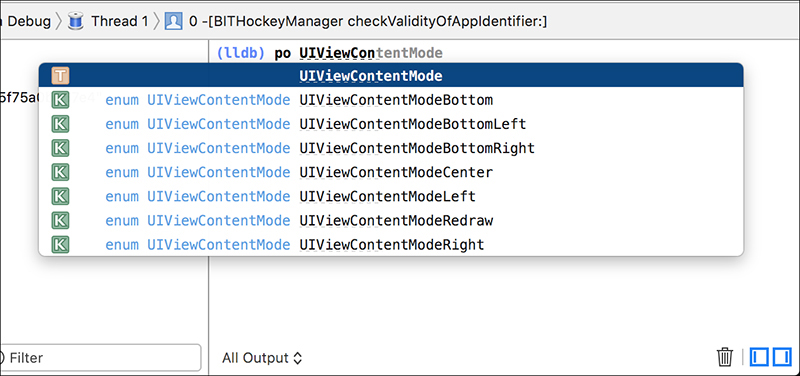
Figure 5-9: Nifty lldb method name completion in Xcode
Keep in mind that you’re not limited to manipulating objects that are declared in your code. You can also manipulate framework classes.
(lldb) expr (void)[[UIPasteboard generalPasteboard] setString:@"my string"]
(lldb) po [[UIPasteboard generalPasteboard] string]
$5 = 0x071c6e50 my string
For this kind of interactive manipulation and interrogation, I often find it useful to set a breakpoint on didReceiveMemoryWarning in the application delegate because this method will be present in every application. When I want to inspect the program’s state while running it in the iOS Simulator, I select Hardware → Simulate Memory Warning. Once I’ve done my twiddling, I simply continue the application with cont. You can also do this from the Xcode UI with the Pause Execution button.
Breakpoint Actions
Breakpoint actions are not well-documented but are quite useful. They allow you to create breakpoints that trigger only under certain conditions, and they can perform complex actions when these breakpoints are hit. You can set them up to automatically resume execution after performing these actions or even have them trigger only after a line is hit a certain number of times. Logging and using speech synthesis to present program information are the simplest actions you can set for a breakpoint, but you can also interrogate objects, read and manipulate variables, and so forth. Basically, breakpoint actions can do anything you can do from the lldb command line, plus a few other niceties.
Let’s walk through creating a breakpoint action one step at a time.
Create a breakpoint by clicking in the breakpoint gutter.
CTRL-click the breakpoint and select Edit Breakpoint.
Click Add Action.
Check the Automatically continue after evaluating box.
For the simplest type of breakpoint action, simply select the Log message action. Here, you can print simple messages, along with the breakpoint name and hit count (see Figure 5-10). You can ignore the expression option because it’s not terribly straightforward to use.
After adding a simple log message, you can click the + button to add another action. This time, select Debugger Command.
Here, you can enter basic lldb expressions—most commonly, using the po command to print the description of an object. See Figure 5-11 for an example.
Figure 5-10: Using a breakpoint action to do a simple log entry. In this example, you’ll log a message, along with the number of times the breakpoint has been hit, using the %H placeholder.

Figure 5-11: In addition to simply logging, you can execute an arbitrary lldb command. In this case, you’ll use the po command to print the description of the object returned by the path method.
Optionally, add a breakpoint condition to specify when the actions you’ve defined are executed (Figure 5-12).
Figure 5-12: Two actions and a breakpoint condition. For the condition, you’ll ensure that the length of the path is not zero before executing the breakpoint action, specifying the return value (BOOL).

Try following these steps until you feel comfortable using breakpoint actions, and then move on to the next section for some specific ways to apply lldb in a security context.
Using lldb for Security Analysis
These are all useful tricks, but how do you put them together to find new security issues or test security assertions? Let’s take a look at a couple scenarios where using the debugger can help you nail down more concrete issues.
Fault Injection
Say you have an application that uses a custom binary network protocol to marshal data between the client and a remote server. This can make it difficult to intercept and modify data with an off-the-shelf proxy, but you’d like to determine whether malformed data in certain parameters could cause a program to crash. You can also manipulate data to make future testing easier.
Since you can change data, you might want to replace, for example, a randomly generated key with one of your choosing. You can do that from within the debugger, as shown in Listing 5-4. This results in data being encrypted with a known key of your choosing, rather than a potentially unprintable blob. The following example modifies the app’s crypto key before it gets saved to the Keychain so that further communication uses a different key:
➊ (lldb) frame var
(Class) self = SimpleKeychainWrapper
(SEL) _cmd = "addToKeychain:forService:"
(NSString *) identifier = 0x00005be4 @"com.isecpartners.CryptoKey"
(NSString *) service = 0x00005bf4 @"com.isecpartners.NSCoder+Crypto"
(NSMutableDictionary *) dictionary = 0x08b292f0 6 key/value pairs
(NSMutableData *) item = 0x08b2cee0
(OSStatus) status = 1
➋ (lldb) po item
<9aab766a 260bb165 57675f04 fdb982d3 d73365df 5fd4b05f 3c078f7b b6484b7d>
➌ (lldb) po dictionary
{
acct = <636f6d2e 69736563 70617274 6e657273 2e437279 70746f4b 6579>;
class = genp;
gena = <636f6d2e 69736563 70617274 6e657273 2e437279 70746f4b 6579>;
pdmn = aku;
svce = "com.isecpartners.NSCoder+Crypto";
"v_Data" = <9aab766a 260bb165 57675f04 fdb982d3 d73365df 5fd4b05f 3c078f7b
b6484b7d>;
}
➍ (lldb) expr (void)[dictionary setObject:@"mykey" forKey:(__bridge id)kSecValueData
];
➎ (lldb) po dictionary
{
acct = <636f6d2e 69736563 70617274 6e657273 2e437279 70746f4b 6579>;
class = genp;
gena = <636f6d2e 69736563 70617274 6e657273 2e437279 70746f4b 6579>;
pdmn = aku;
svce = "com.isecpartners.NSCoder+Crypto";
"v_Data" = mykey;
}
Listing 5-4: Inspecting and changing object values in memory
At ➊, the code prints the variables of the current frame, noting the arguments sent to the addToKeychain:forService: selector. The key this example is interested in is stored in the item argument and added to a dictionary. Inspecting these (➋ and ➌) reveals the value of the key. The code then alters the Keychain dictionary using the expr command ➍. At ➎, the program verifies that the new NSString is now the current value of the key.
Tracing Data
If you have an application that encrypts data with a master password, it may be useful to examine that data before it gets encrypted. It may not always be immediately obvious that data will hit the encryption routine by default. Consider Listing 5-5:
➊ (lldb) frame variable
(CCCryptHelper *const) self = 0x07534b40
➋ (SEL) _cmd = "encrypt:"
➌ (NSString *) data = 0x0000c0ec @"PasswordManager"
(NSData *) encData = 0x07534b40 0 byte
(lldb) frame select
frame #0: 0x00006790 PasswordManager `-[CCCryptHelper encrypt:](self=0x07534b40,
_cmd=0x00009b1e, data=0x0000c0ec) + 48 at CCCryptHelper.m:82
80 - (NSData *)encrypt:(NSString *)data {
-> 81 NSData *encData = [self AES128EncryptData:[data dataUsingEncoding: NS
UTF8StringEncoding]
82 withKey:masterPassword];
Listing 5-5: Examining frame variables with lldb
If you break on the encrypt: selector ➋, you can examine the local variables using the frame variable command ➊. Notice that the output shows both data and encData. The former ➌ is the interesting bit in this example, because that’s the data that will be encrypted and returned by the routine. This tracing technique can also be used to examine and manipulate data to be sent over the wire, before it hits the encryption routines.
Examining Core Frameworks
lldb is also useful for digging in to the weird quirks of Apple’s APIs—I recommend you use it when you’re confused by an API’s behavior. For instance, when looking into NSURLCache, I noticed the behavior in Listing 5-6:
(lldb) expr (int)[[NSURLCache sharedURLCache] currentMemoryUsage]
(int) $0 = 158445
(lldb) expr (int)[[NSURLCache sharedURLCache] currentDiskUsage]
(int) $1 = 98304
➊ (lldb) expr (void)[[NSURLCache sharedURLCache] removeAllCachedResponses]
(lldb) expr (int)[[NSURLCache sharedURLCache] currentMemoryUsage]
(int) $3 = 0
(lldb) expr (int)[[NSURLCache sharedURLCache] currentDiskUsage]
➋ (int) $4 = 98304
Listing 5-6: Some curious behavior of the NSURLCache API
Here, even though I called the removeAllCachedResponses method ➊, the current disk usage is still 98304 bytes ➋. Alas, it appears that clearing the cache is useless. Fear not—you’ll see some solutions to this problem in Chapter 9. In the meantime, you may want to play around with some of the internals yourself. This can help you figure out some of the workings of the iOS platform and give you deeper insight into how your application is behaving.
Closing Thoughts
All of these debugging and inspection techniques can be useful when trying to debug your own application or understand a new codebase quickly. However, you may not always have access to the source code of the product you’re working with. In these cases, you’ll want to know some basic black-box testing techniques, which I will cover in Chapter 6.