Format and use table content
</objective> <objective>Make tables look the way you want
</objective> <objective>Work with cells, rows, and columns to make your information shine
</objective> </feature>Tables, along with charts, which we will explore in Chapter 4, “Using Charts,” are mainstays of presentation. After all, a table can be a great way to show your audience members information and help them understand some concept or idea you are trying to get across.
The good news is that you won’t have to spend a lot of sweat and tears with tables in Keynote. As with most things in Keynote, the software does most of the hard work for you so that you can focus on your presentation’s content. In this chapter you’ll learn how to create, customize, and manage tables in presentations.
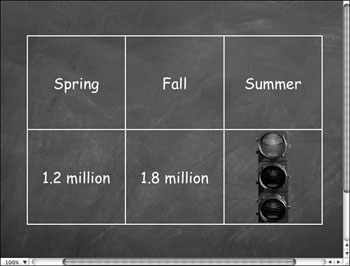
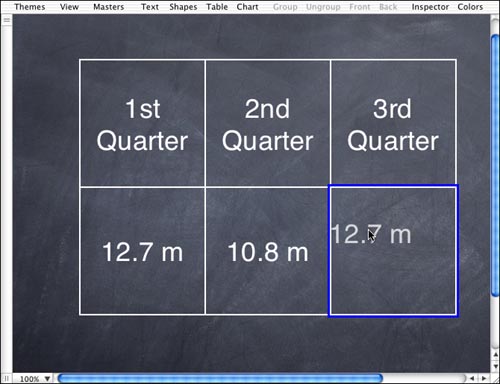
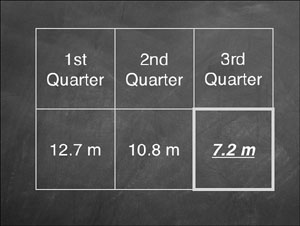
Okay, maybe tables aren’t like flashy graphics or cool multimedia that will dazzle your audience, but let’s also face the facts: Depending on the kind of presentation you are tackling, tables can be very helpful in a number of ways. The purpose of a table is to display information to your audience. The table gives the audience members an organized, systematic look at some content you are presenting, and in reality, content presented as a table is easier than text information for audience members to remember later because it gives what might be boring content a visual impact. For example, take a look at the table in Figure 3.1.

This table takes a simple three-column and two-row approach that gives sales figures for different periods of the year. The table is very basic in nature, but it makes otherwise bland information more interesting and easy to understand. You could jazz this table up a bit by using more colors and even marking the low period (summer) in red or using a graphic, which you’ll see how to do later in this chapter.
When should you use a table? Here are some quick tips to remember:
Use tables to present numbers and figures—. The table format naturally lends itself to numbers and figures and keeps audience members from getting lost in a jumble of numeric information. If you use numbers and figures in a presentation, you should think in terms of tables.
Use tables to show contrasting information—. Tables work great when you have different pieces of information that fit together or contrast in some way. The table format helps show relationships between pieces of data in a memorable way.
Use tables to show time line issues—. If you are talking about different periods of the year or even periods of different years, you can use a table to show the information. Tables can help audience members establish a mental time line that gives greater meaning to information.
Can you overuse tables? Sure. As with any presentation element, you should question yourself if you have table after table in your presentation. Use tables when needed, but use them sparingly, or they start to lose their impact. Keep it simple, keep it clear, and make sure the table has a solid purpose before using it in your presentation.
You can create a new table on a slide by following these steps:
Click the New button to create a new slide.
Click the Masters button on the toolbar and choose the Blank master.
Click the Table icon on the Keynote toolbar or select Edit, Place, Table.
The table appears on the slide canvas, and the Table Inspector opens, as shown in Figure 3.2. Notice that, by default, Keynote creates a 3×3 table.

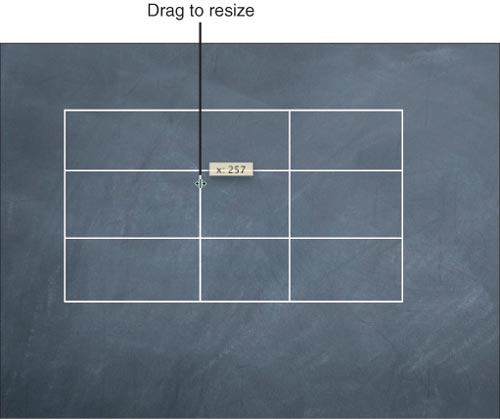
You can resize the table by using the selection handles. Simply drag them to shrink, enlarge, or resize the table in any fashion that you want (see Figure 3.3). You can also move the entire table around by positioning your mouse anywhere on the table (except the selection handles) and dragging.

You can easily move around in a table in a few different ways, depending on what you want to do. First of all, keep in mind that you can select the entire table by clicking outside the table and then clicking the table one time. This allows you to resize the table and move it around as described in the previous section.
You can also move around in the individual cells within the table. Here’s how:
Click outside the table and then click the table to select it.
Click the desired cell. Yellow highlight appears around the cell’s border so that you know the cell is selected.
When a cell is selected, press the arrow keys on your keyboard to move from cell to cell.

You can also select cell borders and adjust them as you like. Just select the cell and then click the desired border. This action highlights the border so you can drag it as needed to change your table, as shown in Figure 3.4.
Tables are designed to hold information, primarily text that describes the content of the table. After all, it is data that is on display—the table is essentially an organizational method that makes the data easier to read and understand. Therefore, you need to enter text in a table, make it fit, and make it look the way you want it to look (and in a way that makes it easy to read).
First things first: You can easily put text on a table by selecting an individual cell. Just click the cell to highlight it and then use your keyboard to enter the text you want (see Figure 3.5).

As with any other text, you can change the font, color, and style of table text. By default, the text you type in a table adheres to the text style used in the template you have selected. But that text might not work as well in a table as it does in other cases, so you might have to change it.
To change your text, do the following:
Click inside the cell that contains the text you want to change and then drag over the text, holding down the mouse to select it.
Select Format, Font, Show Fonts to open the standard Fonts dialog box, where you can select a font family, a typeface, and a size.
Use the Action drop-down menu in the Fonts dialog box to make any desired font changes. See Chapter 2, “Working with Text,” for additional details about the Action drop-down menu.
Of course, you need to use some common sense when you are working with fonts and tables. You want the information to be very clear and quickly readable. For example, take a look at Figures 3.6 and 3.7.

Figures 3.6 and 3.7 use Helvetica, which is a standard Mac font, and Party LET, which is the font most often used for fun text. Obviously, Helvetica is much easier to read, and that’s what you want. Table data is not the place to get creative with font styles. As you create tables and enter text, keep the following points in mind:
Use clear, easy-to-read fonts, colors, and styles—. If you are going to err, err on the side of plainness. You want the table easy to read (and quick to read as well). Audience members should not have to work to read the table text.
Keep it very short—. A couple words in a cell is best. Table text is not the place to wax poetic, so keep it extremely short and informative.
Don’t overcrowd tables with cells and text—. Remember that a table should show relationships between pieces of information, but your audience should not have to study your table in order to comprehend your intended meaning.
You can easily manage the alignment of text by using the Table Inspector. Here’s how:
Click the Inspector button on the toolbar or select View, Show Inspector. The Table Inspector appears.
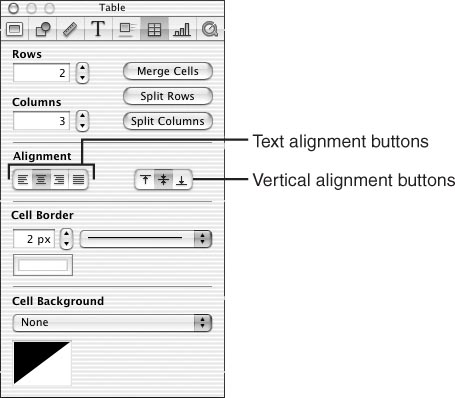
Click the Table button on the Table Inspector.
As shown in Figure 3.8, you have the option to manage the alignment of the text within your table. The first four buttons allow you to left-justify, center, right-justify, or simply justify, which distributes text evenly. Select a cell that contains text and click the alignment option you want. Keep in mind that center alignment (which is the default) often looks the best.
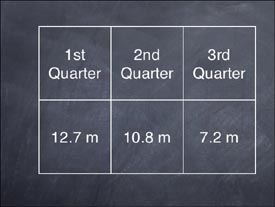
To manage the vertical alignment of text within the cell, use the vertical alignment buttons on the Text Inspector to align text to the top of the cell, the center of the cell, or the bottom of the cell. Again, the center option is the default and most often looks the best. Figure 3.9 shows three columns. The first column has the text aligned to the top of the cell, the middle column has the text aligned to the center of the cell, and the last column has the text aligned to the bottom of the cell.

As with other things in Keynote, you can return to these options and change them at any time.
Before we move on, there are a couple quick text options I want to mention that will make your work easier. First, keep in mind that you can work with individual cells of text, multiple selected cells, or an entire table. To make a change, such as a font or alignment change, to the text within a certain cell, just select the cell. If you want to change several cells at the same time, hold down the ![]() key on your keyboard and select the cells. You can then change the font or alignment of these cells all at the same time. Finally, you do the same thing by simply selecting the entire table. Just click outside the table to make sure none of the cells are selected and then click the table one time to select it. You can then use the Fonts dialog box to change all the fonts, or you can use the Text Inspector to change the alignment of all the text.
key on your keyboard and select the cells. You can then change the font or alignment of these cells all at the same time. Finally, you do the same thing by simply selecting the entire table. Just click outside the table to make sure none of the cells are selected and then click the table one time to select it. You can then use the Fonts dialog box to change all the fonts, or you can use the Text Inspector to change the alignment of all the text.
One final tip I would like to point out concerns dragging text. Let’s say you are creating a table that has the same text in several cells, which is common in the case of numeric values. In this case, you can simply copy and paste text between cells. Using the mouse, you simply select the desired values and choose Edit, Copy. Then you position the cursor where you want to paste the text or numbers and choose Edit, Paste.
If you type text in a cell and then decide that you want to move the text, you can simply drag the text to the desired cell and drop it there, as shown Figure 3.10. Just select the cell and drag the text from the selected cell to the new cell where you want the text to reside.
You can use the Table Inspector to quickly create simple tables that contain the number of rows and columns you need. You can also use the Table Inspector to create more advanced tables that take advantage of splitting and merging cells so that the table meets your needs.
To adjust cells as needed, you once again use the Table Inspector. Just click the Inspector button on the toolbar and then choose the Table option at the top of the Inspector.
Caution

You can make tables that are as complex as you want. However, keep in mind that your audience has to be able to interpret your tables. When your audience members look at a table, it should make perfect sense quickly and easily. A table that has a conglomeration of complicated cells often is not readily clear and requires a bit of study. So, once again, err on the side of simplicity and make sure that each table is easy to understand.
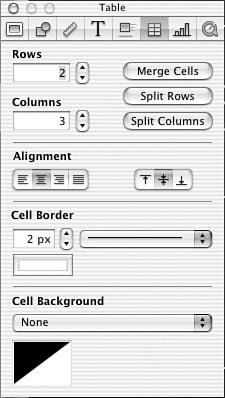
In the first part of the Table Inspector, you can choose the number of rows and columns that you might want, as shown in Figure 3.11. Just click the spinner arrows next to the Rows and Columns fields to increase or decrease the number of rows and columns in the table. The table will automatically adjust to accommodate your change.
Tip
Of course, you can quickly run out of table room on a slide, so you’ll have to hone your table down a bit if it is getting too large or consider subdividing the presentation information into two tables on different Keynote slides.
You can use the Table Inspector to merge cells, split rows, and split columns. First of all, you might not like the default cell construction Keynote gives you, or you might need larger cells than normal. No problem. By using the Table Inspector, you can merge cells together so that they become one. Here’s how:
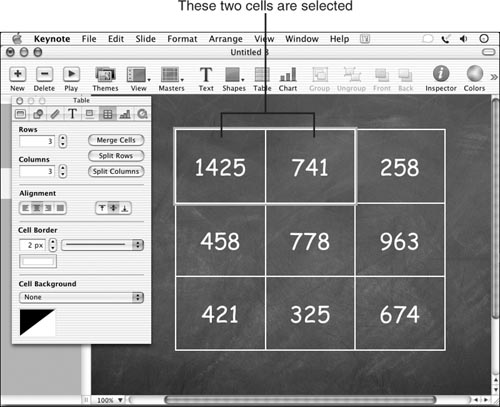
Select two or more adjacent cells by holding down the Shift key on your keyboard and clicking the cells (see Figure 3.12).
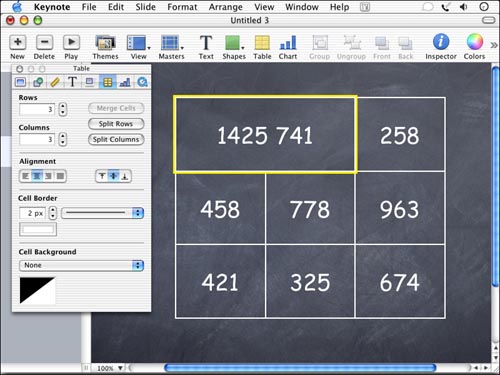
Click the Merge Cells button in the Table Inspector to merge the cells together (see Figure 3.13).
Just as you can merge rows or columns, you can also split them. You might use this feature when you need to subdivide data so that it is easier to read. Follow these steps:
To split a row, column, or cell, select it with your mouse. If you need to select multiple cells, hold down the Shift key and click them.
On the Table Inspector, click either the Split Rows button or the Split Columns button, as needed. Essentially, the Split Rows button creates a horizontal split in the cell, and the Split Columns button creates a vertical split.
You can easily change the borders of individual cells or of a whole table by using the Cell Border section of the Table Inspector. To change the thickness of a table or cell border, follow these steps:
Click the table once to select the whole table or click the individual cell whose border you want to adjust.
Click the Inspector button on the toolbar and then click the Table button at the top of the Inspector.
Click the up and down spinner arrows next to the Cell Border field to increase or decrease the thickness of the border. Alternatively, you can click the pop-up menu next to the Cell Border field and choose a line thickness from the list. Your changes are automatically applied to the table so you can see the effect right away.
If you don’t like the look, just make additional changes on the Table Inspector, or you can select Edit, Undo to undo your changes.
Adjusting borders has a few helpful uses, such as
You can easily change the overall look of a table by simply adjusting all the cell borders and colors. As you can see in Figure 3.14, just a slight increase in cell border thickness can make the table look a bit stronger.
You can call attention to individual cells by making a cell’s border a bit stronger than the borders of other cells. This works well when you use additional styles with your text, such as boldface, as you can see in Figure 3.15.

You can also change the color of a cell or table border:
Click the table once to select the whole table or click the individual cell whose border you want to adjust.
Tip

If you start to change a cell border, ask yourself why you’re doing it. There is a danger with any software to do things simply because you can rather than for any particular need. Always take a step back and look critically at your table to make sure you have a good reason for the change you are making.
Click the Inspector button on the toolbar and then click the Table button at the top of the Inspector.
Click the color box just below the Cell Border field in the Table Inspector. The Colors dialog box opens, as shown in Figure 3.16.
Use the option buttons across the top of the Colors dialog box to select a method of picking a color. For example, Figure 3.16 uses a spectrum to find a new color. Simply locate the color you want and click it to apply it to your table.
You can adjust the opacity of the table border color by using the Opacity slider. When set to a lower number, the Opacity setting allows some of the background color to bleed through the border color, giving it a somewhat transparent look. You can set it to a higher number to achieve a more solid-colored border.
Click the Close button in the upper-left corner of the Colors dialog box when you are finished.

Again, feel free to customize the color in any way you like, but make sure the color you choose matches the rest of your slide colors and simply looks good. Remember: You want the data in the table, not the table border, to get the attention.
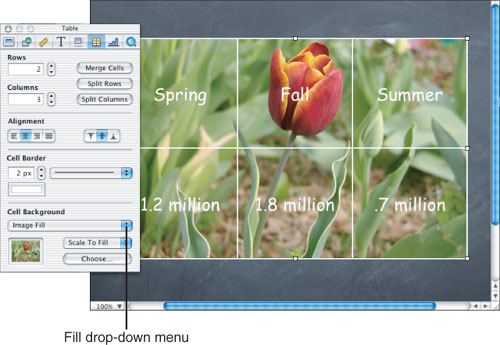
You are not stuck with the default theme background coming through your table. If you like, and if your slide looks good with the option, you can fill the table background by using the Cell Background feature, which is also found in the Table Inspector. This option works great because it can make your table stand out a bit and you can use contrasting colors against other slide elements. You can even use an image to fill the background if you like. For example, in Figure 3.17, I have used the Table Inspector to add an image fill, and I have scaled the image to fill the entire table, simply by clicking a few drop-down menu options. It’s that easy!
Tip
You can apply background fills to individual cells, a row, a column, or an entire table. Simply select the entire table or individual rows, columns, or cells before applying the background fill.
Interested? I thought so! Here’s how you do it:
Select the table.
Click the Inspector button on the toolbar and then click the Table Inspector option.
On the Table Inspector, click the Cell Background drop-down menu and choose an option. You can apply a color fill, a gradient fill (which uses two contrasting colors that blend into each other), or an image fill. Depending on the option you selected, additional selection options appear under on the Table Inspector so that you can select your color, gradient, or image.
Make a selection from the options that appear under on the Table Inspector, and it will be applied to your table.
Certainly, text works great in tables, but what if you want to put an image or a picture in one of the cells within a table? For example, let’s say that you have some sales numbers, and for a quarter of the year that is not finished, you want to place an image that shows the prospective outcome rather than a number guess. No matter what you want to do, you can put pictures and images in table cells, and Keynote does all the scaling and formatting for you, which is really nice.
To put a graphic in a table, you need to return to the Table Inspector. Select the cell in question on your table, and then under Cell Background on the Table Inspector, drag the image to the image well, or just click Choose to locate the image on your Mac.
Choose the Scale to Fill option, and the image is scaled to fit inside the cell, as you can see in Figure 3.18. It’s simple and easy! At this point, the image is a part of your table, and if you move the table around, the image will stay in the cell and remain formatted correctly.