
Chapter 17. Debugging and Troubleshooting
Troubleshooting ColdFusion Applications
As with any development tool, sooner or later you’re going to find yourself debugging or troubleshooting a ColdFusion application problem. Many elements have to work seamlessly for a ColdFusion application to function correctly. The key to isolating and correcting problems is an understanding of such things as ColdFusion, data sources, SQL syntax, URL syntax, and your Web server—and more important, how these all work with each other.
If the prospect of debugging application errors sounds daunting, don’t panic. ColdFusion has powerful built-in debugging and error-reporting features. These capabilities, coupled with logical and systematic evaluation of trouble spots, will let you diagnose and correct all sorts of problems.
This chapter teaches you how to use the ColdFusion debugging tools and introduces techniques that will help you quickly locate the source of a problem. More importantly, because an ounce of prevention is worth a pound of cure, we introduce guidelines and techniques that help prevent common errors from occurring in the first place.
Note
This chapter does not discuss the ColdFusion 9 interactive step debugger. See Chapter 45, “Using the Debugger,” online, for more information about this powerful new tool for understanding and debugging ColdFusion applications. The chapter also does not focus on ColdFusion server configuration problems; this topic is beyond the introductory scope of Volume 1.
Understanding What Can Go Wrong
As an application developer, sooner or later you are going to have to diagnose, or debug, a ColdFusion application problem. Because ColdFusion relies on so many other software components to work its magic, there are a lot of places where things can go wrong.
This chapter makes the following assumptions:
• You are familiar with basic ColdFusion concepts.
• You understand how ColdFusion uses data sources for all database interaction.
• You are familiar with basic SQL syntax and use.
• You know how to use the ColdFusion Administrator.
• You are comfortable using Adobe ColdFusion Builder.
If you aren’t familiar with any of these topics, I strongly recommend you read the chapters about them before proceeding.
→ See Chapter 1, “Introducing ColdFusion,” for more information on how ColdFusion works and how all the pieces fit together to create a complete application.
→ See Chapter 2, “Accessing the ColdFusion Administrator,” to learn how to enable debugging output using the ColdFusion Administrator.
→ See Chapter 5, “Reviewing the Databases,” for a detailed explanation of databases, tables, rows, columns, keys, and other database-related terms.
→ See Chapter 6, “Introducing SQL,” for more information about data sources and how ColdFusion uses them for all database interaction.
Almost all ColdFusion programming errors fall into one of the following categories:
• Web server configuration problems
• Database errors
• SQL statement syntax or logic errors
• CFML and HTML syntax errors
• Other common page processing problems
Let’s look at each of these potential problem areas.
Debugging Web Server Configuration Problems
You should almost never encounter problems caused by Web server misconfiguration during routine, day-to-day operations. These types of problems almost always occur either during the initial ColdFusion setup or while testing ColdFusion for the first time. After ColdFusion is installed and configured correctly, it will generally stay that way.
The only exception to this is the possibility of an error telling you that ColdFusion isn’t running. Obviously, ColdFusion must be running to process templates. Steps to verify that the server is running, and to start it if it isn’t, differ based on your operating system:
• If you’re running ColdFusion under Microsoft Windows, you should run the Services applet. It will show whether the service is running and will enable you to start it if it isn’t.
• If you’re running ColdFusion under Linux, Solaris, or Mac OS, use the ps command (or ps –ef|grep cfusion) to list running processes to see whether ColdFusion is running.
Tip
Windows services can be started automatically every time the system is restarted. The service Startup option must be set to Automatic for a service to start automatically. This setting is turned on by the ColdFusion installation procedure and typically should be left on at all times. If the service doesn’t automatically start, check these options.
Tip
If your operating system features a mechanism by which to automatically start services or daemons upon system restart, use it.
One other situation worth noting is when you are prompted to save a file every time you request a ColdFusion page. If this is the case, one of two things is happening:
• ColdFusion isn’t installed correctly on the Web server.
• You are accessing URLs locally (using the browser File > Open option) instead of via the Web server.
Debugging Database Errors
Many kinds of errors can occur in database processing stemming from problems in the way that either ColdFusion or the database server is configured.
ColdFusion relies on database drivers (JDBC) for all its database interaction. You will receive database driver error messages when ColdFusion can’t communicate with the appropriate driver or when the driver can’t communicate with the database.
Database driver error messages are usually generated by the driver, not by ColdFusion, with ColdFusion displaying whatever error message it has received from the database driver. Unfortunately these error messages are often cryptic or even misleading.
Database driver error messages vary from driver to driver, so it would be pointless to list all the possible error messages here. Instead, we will look at the more common symptoms and how to fix the problems that cause them.
Tip
You can use the ColdFusion Administrator to verify that a data source is correctly configured.
Receiving the Data Source Not Found Error Message
ColdFusion communicates with databases via database drivers. If the database driver reports that the database could not be found, check the following:
• Make sure you have created the data source.
• Verify that the data source name is spelled correctly. Data source names are not case sensitive, so you don’t have to worry about that.
Receiving Login or Permission Errors When Trying to Access a Data Source
Database systems typically require you to log on to a database before you can access it. When setting up a data source, you generally must specify the login name and password the driver should use to gain access (whether you’re working in the ColdFusion Administrator or using the <cfquery> tag’s UserName and Password attributes).
If you create the data source in the ColdFusion Administrator, your settings will be verified when you submit the form to add the data source. Any problems will cause an error message to appear. If you specify the login credentials in the <cfquery> tag, any such errors will be displayed in a runtime error when the page is executed.
The following steps will help you locate the source of this problem:
• Verify that the login name and password are spelled correctly. (You won’t be able to see the password in the ColdFusion Administrator—only asterisks are displayed in the password field.)
• On some database systems, passwords are case sensitive. Be sure that you haven’t left the Caps Lock key on by mistake.
• Verify that the name and password you are using does indeed have access to the database to which you are trying to connect. You can do this using a client application that came with your database system.
• Verify that the login being used actually has rights to the specific tables and views you are using and to the specific statements (SELECT, INSERT, and so on). Many DBMSs enable administrators to grant or deny users rights to specific objects and specific operations on specific objects.
Tip
When you’re testing security- and rights-related problems, be sure you test using the same login and password as the ones used in the data source definition.
Receiving Table Name Error Messages
After verifying that the data source name is correct, you still may get errors because of the table name. Some database servers, such as Microsoft SQL Server, are case sensitive with regard to table names. In addition, in some cases you must provide a fully qualified table name. You can do this in two ways:
• Explicitly provide the fully qualified table name whenever it is passed to a SQL statement. Fully qualified table names are usually made up of three parts, separated by periods. The first is the name of the schema or database containing the table; the second is the owner name (possibly dbo); and the third is the actual table name itself.
• Some database drivers, such as the Microsoft SQL Server driver, let you specify a default database name to be used if none is explicitly provided. If this option is set, its value is used whenever a fully qualified name isn’t provided.
Tip
If your database driver lets you specify a default database name, use that feature. You can then write fewer and simpler hard-coded SQL statements.
Debugging SQL Statement or Logic Errors
Debugging SQL statements is one of the two types of troubleshooting you may spend much of your debugging time doing (the other is debugging ColdFusion syntax errors, which we’ll get to next). You will find yourself debugging SQL statements if you run into either of these situations:
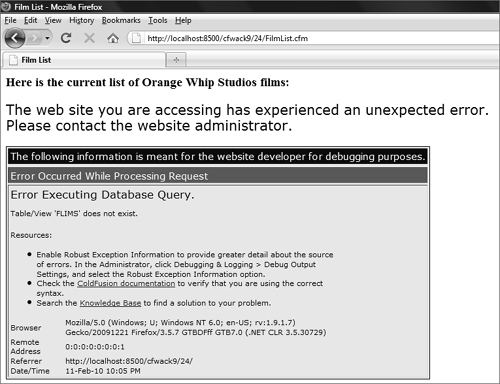
• ColdFusion reports SQL syntax errors. Figure 17.1, for example, is an error caused by misspelling a table name in a SQL statement. If you see only partial debug output, as shown in Figure 17.2, access the ColdFusion Administrator and turn on the Enable Robust Exception Information option on the Debug Output Settings screen. (While this setting is very helpful in development, it is generally inappropriate to enable this setting in production environments, in which sharing the details for errors can expose sensitive information about your files, databases, and other configuration details.)
Figure 17.1 ColdFusion displays SQL error messages as reported by the database driver.
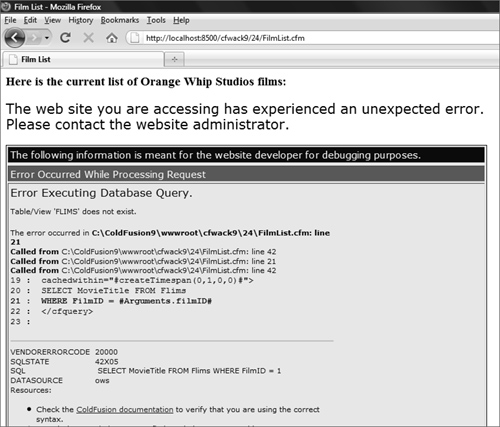
Figure 17.2 During development, be sure that Enable Robust Exception Information is turned on in the ColdFusion Administrator, or you won’t see complete debug output.
• No syntax errors are reported, but the specified SQL statement didn’t achieve the expected results.
Obviously, a prerequisite to debugging SQL statements is a good working knowledge of the SQL language. I’m assuming you are already familiar with the basic SQL statements and are comfortable using them.
→ See Chapter 7, “SQL Data Manipulation,” for information about basic SQL statements and examples of their uses.
The keys to successfully debugging SQL statements are as follows:
• Isolate the problem. Debugging SQL statements inside ColdFusion templates can be tricky, especially when creating dynamic SQL statements. See the section “Viewing Dynamically Generated SQL” later in this chapter for help on viewing the SQL generated at runtime. Try executing the same statement from within another database client, replacing dynamic parameters with fixed values if appropriate.
• The big difference between ColdFusion SQL statements and statements entered in any other database client is the use of ColdFusion variables. If you are using ColdFusion variables in your statement, verify that you are enclosing them in quotation marks when necessary (if the column expects a string value). If a number is expected, the variable must not be enclosed in quotation marks.
Note
Many databases do not support double quotation marks, but instead expect single quotation marks.
• Look at the bigger picture. Dynamic SQL statements are one of ColdFusion’s most powerful features, but this power comes at a price. When you create a dynamic SQL statement, you are effectively relinquishing direct control over the statement itself and are allowing it to be changed based on other conditions. This means that the code for a single ColdFusion query can be used to generate an infinite number of queries. Because some of these queries might work and others might not, debugging dynamic SQL requires that you be able to determine exactly what the dynamically created SQL statement looks like. Again, ColdFusion makes this an easy task, as you will see later in this chapter in the section “Viewing Dynamically Generated SQL.”
• Break complex SQL statements into smaller, simpler statements. If you are debugging a query that contains subqueries, verify that the subqueries properly work independently of the outer query.
Caution
Be careful not to omit number signs (#) around the variable names in your SQL code. Consider the following SQL statement:
DELETE Actors
WHERE ActorID=ActorID
The code is supposed to delete a specific actor: the one whose ID is specified in ActorID. But because the number signs were omitted, instead of passing the actor ID, the name of the actor ID column is passed. The result? Every row in the Actors table is deleted instead of just the one—all because of missing number signs.
Here is an even more correct statement, also including the number signs:
DELETE Actors
WHERE ActorID=<cfqueryparam value="#url.stateid#" cfsqltype="CF_SQL_NUMERIC">
This statement ensures that only numeric values are passed to the SQL statement.
Incidentally, this WHERE clause illustrates why you should always test WHERE clauses in a SELECT statement before using them in a DELETE or UPDATE statement.
Whenever a SQL syntax error occurs, ColdFusion displays the SQL statement it submitted (if you selected Enable Robust Exception Information in the Administrator debug output settings). The fully constructed statement is displayed if your SQL statement was constructed dynamically. The variable name values are displayed.
Note
If you ever encounter strange database driver error messages about mismatched data types or incorrect numbers of parameters, check to see if you have mistyped any table or column names and that you have single quotation marks where necessary. More often than not, that is what causes that error.
Tip
If you’re using ColdFusion Builder, you can completely avoid typos in table and column names by using the RDS Dataview drag-and-drop support. Open RDS Dataview (Window > Show View > RDS Dataview) and select (or configure) your server, select the desired data source, and expand the tables to find the table and column you need. You can then click the table or column name and drag it to the editor window, where it will be inserted when you release the mouse key.
Viewing Dynamically Generated SQL
As discussed earlier in this chapter, a common challenge in debugging SQL problems in ColdFusion is identifying the SQL statement generated dynamically within a <cfquery> tag, because any valid CFML can be used to create any valid SQL. Fortunately, there are several solutions, some new in recent releases.
Perhaps the most traditional approach is to use the ColdFusion debugging information, which can be enabled in the ColdFusion Administrator. The Debug Output Settings page contains a check box labeled Database Activity, and during development, you can enable this option to display the full SQL statement and data source name (and with the Enable Robust Exception Information option, this information is displayed in any database-related error messages). The debugging output options are discussed further in the section “ColdFusion Debugging Output Options” later in this chapter.
Note
Newer options have become available since ColdFusion MX 7, and these can be of particular value when you cannot enable debugging. ColdFusion MX 7 added a new Result attribute for <cfquery> (and other tags), which enables you to name a variable whose value will be a structure containing metadata about the tag after its execution. In the case of a <cfquery> tag, one of the resulting keys is SQL, which holds the dynamically generated SQL.
ColdFusion 8 also added, on the data source definition screen (under Advanced Settings), a Log Activity option, which you can use to name a log file to which ColdFusion will write the details of all database calls for that data source.
Debugging CFML and HTML Syntax Errors
Debugging of syntax errors, whether in CFML or HTML, is another type of troubleshooting you’ll find yourself doing. Thankfully, CFML syntax errors are among the easiest bugs to find.
ColdFusion syntax errors are usually one of the following:
• Mismatched number signs (#) or quotation marks
• Mismatched begin and end tags; a <cfif> without a matching </cfif>, for example
• Incorrectly nested tags
• A tag with a missing or incorrectly spelled attribute
• Missing quotation marks around tag attributes
• Incorrect use of tags
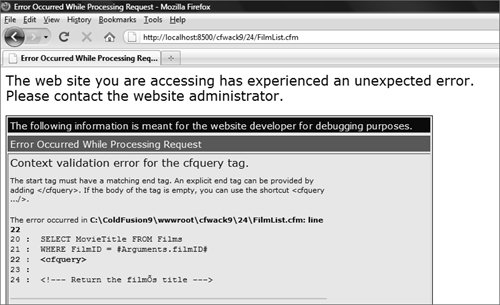
If any of these errors occur, ColdFusion generates a descriptive error message, as shown in Figure 17.3. The error message lists the problematic code (and a few lines before and after it) and identifies exactly what the problem is.
Figure 17.3 ColdFusion generates descriptive error messages when syntax errors occur.
Caution
If your template contains HTML forms, frames, or tables, you might have trouble viewing generated error messages. If an error occurs in the middle of a table, for example, that table will never be terminated, and there’s no way to know how the browser will attempt to render the partial table. If the table isn’t rendered and displayed properly, you won’t see the error message.
Tip
If you think an error has occurred but no error message is displayed, you can view the source in the browser. The generated source will contain any error messages that were included in the Web page but not displayed.
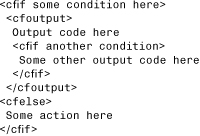
One of the most common CFML or HTML errors is missing or mismatched tags. Indenting your code, as shown in the following, is a good way to ensure that all tags are correctly matched:
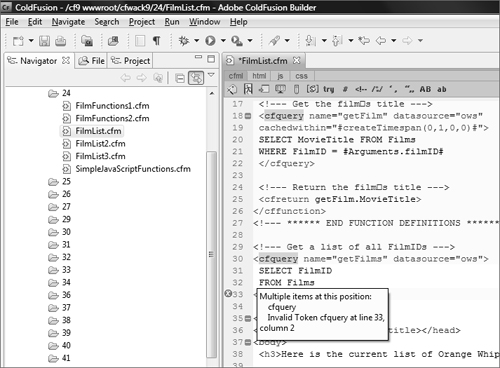
ColdFusion Builder users can take advantage of the available features designed to help avoid common tag mismatching problems. For instance, as you type code, the editor automatically checks for coding syntax errors and reports them with a red X to the left of the line in error. If you roll the mouse over that red X, a pop-up message offers more details. Figure 17.4 shows the error message for the same closing cfquery tag without the needed slash shown in Figure 17.3.
Figure 17.4 ColdFusion Builder offers built-in error checking as you type CFML (and other) code.
→ For more information about ColdFusion Builder, see Chapter 3, “Introducing ColdFusion Builder.”
Debugging Other Common Page Processing Problems
Besides syntactical problems, which can be detected and resolved with the help of ColdFusion Builder, several problems can occur that are more typically logical errors, ranging from problems with variables to problems with the way that HTML is processed in the browser or that browser input is processed in CFML.
Inspecting CFML Variable Contents During Processing
Sometimes problems throw no errors at all when you run the template. This can occur when your code is syntactically valid, but a logic problem exists somewhere. Aside from using the interactive debugger (which is discussed in Chapter 45), the primary way to locate this type of bug is to inspect variable contents during processing. Several ways to do this are available:
• Embed variable display code as necessary in your page, dumping the contents of variables to the screen (or to HTML comments you can view using View Source in your browser).
• The <cfdump> tag (introduced in Chapter 8, “The Basics of CFML”) can display the contents of any variable, even complex variables, and can be used to aid debugging when necessary (and as of ColdFusion 8, this dump output can be directed to a log file or the ColdFusion console).
• The <cflog> tag can display the contents of any variable, writing its output to a log file.
• The <cftrace> tag can display the contents of any variable, and its operation can be enabled and disabled via the Administrator, as discussed later in this chapter, in the section “Using Tracing.”
• By displaying variable contents, you usually can determine what sort of processing is being performed by various code blocks at any point during page processing.
Tip
You can use <cfabort> anywhere in the middle of your template to force ColdFusion to halt further processing. You can move the <cfabort> tag farther down the template as you verify that lines of code work.
Tip
During development, when you find yourself alternating between needing debugging information and not needing it, you can enclose debug code in <cfif IsDebugMode()> and </cfif>. This way, your debug output will be processed only if debugging output is enabled in the ColdFusion Administrator.
Debugging Code When Images Aren’t Displayed
If image files (and other files) aren’t displayed when you reference them from HTML you generate within ColdFusion, the problem may be path related. If you’re using relative paths (and you generally should be), be sure that the path being sent to the browser is valid. Having too many or too few periods and slashes in the path is a common problem.
Tip
Most browsers let you check image paths (constructing full URLs from relative paths in your code) by right-clicking (Windows) or Control-clicking (Mac) the image and viewing the properties.
Debugging Code When URL Variables Aren’t Processed
Chapter 10, “Creating Data-Driven Pages,” discusses how to pass data on URLs. Parameters you pass on a URL may not be processed by ColdFusion, even though you see them present in the URL. URLs and URL parameters can be finicky, so abide by the following rules:
• URLs can have only one question mark character in them. The question mark separates the URL itself from the query string (the URL parameters).
• Each additional URL parameter must be separated by an ampersand (&).
• URLs should not contain spaces or other special characters. Older browsers may stop processing the URL at the space or special character. If you are generating URLs dynamically based on table column data, be sure to trim any spaces from those values. If you must use spaces, replace them with plus signs. You can use the ColdFusion URLEncodedFormat() function to convert text to URL-safe text.
Tip
ColdFusion debug output, discussed in the following section, lists all URL parameters passed to your page. This is an invaluable debugging tool.
Debugging Form Problems
Chapter 12, “ColdFusion Forms,” introduced the use of forms for processing user input. A number of problems can occur when processing forms.
For instance, submitting a form with the wrong method can cause an error. Web browsers submit data to Web servers in either of two ways, with GET or POST, and the submission method is specified in the <form> or <cfform> method attribute. As a rule, forms should always be submitted to ColdFusion using the POST method, but note that the default method for <form> is GET, so if you omit or misspell method="POST", ColdFusion may be incapable of processing your form correctly.
You may occasionally get a variable is undefined error message when referring to form fields in the action template. A common problem is the absence of form variables for radio buttons, check boxes, and list boxes if they aren’t selected by the user. It’s important to remember this when referring to form fields in an action template. If you refer to a check box without first checking for its existence, an error will occur.
The solution is always to check for the existence of any form fields (or for variables that may not exist) before using them, by using the isdefined function. Alternatively, you can use the <CFPARAM> tag to assign default values to variables, thereby ensuring that they always exist. (This discussion also applies to the detection and handling of undefined URL variables.)
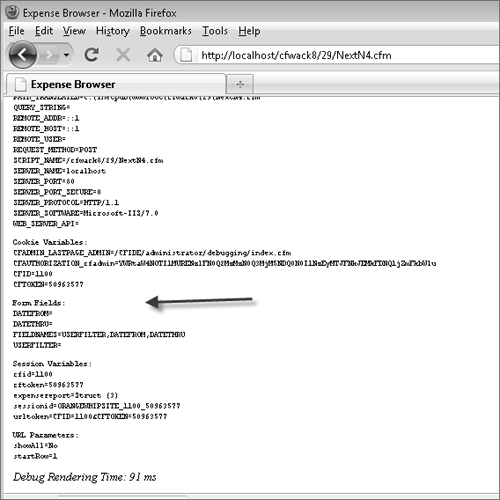
How can you check which form fields were actually submitted and what their values are? Enable ColdFusion debugging (as explained shortly); then any time you submit a form, its action page will contain a debugging output section that will describe the submitted form fields. This is shown in Figure 17.5. A variable named FORM.FIELDNAMES contains a comma-delimited list of all the submitted fields, and the Form Fields section lists all the submitted fields and their values. You can also dump the contents of the FORM scope from within code using <cfdump var="#form#">, which may be useful if debugging output is not enabled.
Figure 17.5 ColdFusion displays form-specific debugging information if debugging is enabled.
Besides the problem of a form field perhaps not existing, you may have situations in which the fields exist but the corresponding form variables in CFML don’t match what you expect. Here are some other problems to watch for in your form definition:
• Be sure all form fields have names (used to create a variable in ColdFusion).
• Be sure related check boxes or radio buttons have the same name (unless using Flash Forms, in which case check boxes must be uniquely named).
• Be sure form field names are specified within double quotation marks.
• Be sure form field names have no spaces or other special characters in them.
• Be sure that all quotation marks around attribute values match.
ColdFusion Debugging Output Options
Previous sections of this chapter have discussed the use of ColdFusion debugging output. This section discusses the debugging output options, which are enabled or disabled via the ColdFusion Administrator, as explained in Chapter 2, in the section “Enabling Debugging.”
Tip
You can restrict the display of debugging information to specific IP addresses. If you enable debugging, you should use this feature to prevent debugging screens from being displayed to your site’s visitors.
Caution
At a minimum, the local host IP address (127.0.0.1) should be specified. If no IP address is in the list, debugging information will be sent to anyone who browses any ColdFusion page.
Tip
A long-time problem for ColdFusion developers has been getting their administrators to let them access the Administrator so that they can change options such as those discussed in this section. As of ColdFusion 8, an administrator can define username and password combinations to permit individuals to access the Administrator. Using this capability plus the Sandbox Security feature (in ColdFusion Enterprise), debugging can be restricted further, to one or more applications on a server. See Chapter 55, “Creating Server Sandboxes,” in Adobe ColdFusion 9 Web Application Construction Kit Volume 3: Advanced Application Development, for more information about the new per-user admin configuration and sandbox security.
ColdFusion supports two debugging modes. They both provide the same basic functionality, but with different interfaces.
Classic Debugging
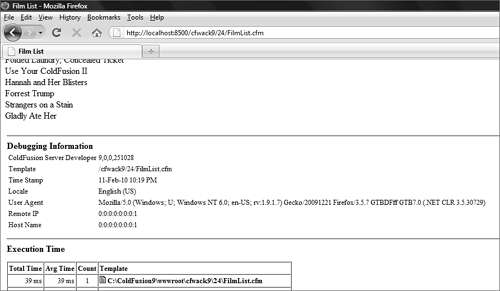
The classic debugging interface appends debugging information to the end of any generated Web pages, as shown in Figure 17.6. The advantage of this format is that it doesn’t use any complex client-side technology, so it’s safer to use on a wide variety of browsers.
Figure 17.6 ColdFusion can append debugging information to any generated Web page.
To select this option, which is the default upon installation, select classic.cfm as the debug format in the ColdFusion Administrator.
Note
This is known as the classic format because it’s the format supported in ColdFusion since the very first versions of the product.
Dockable Debugging
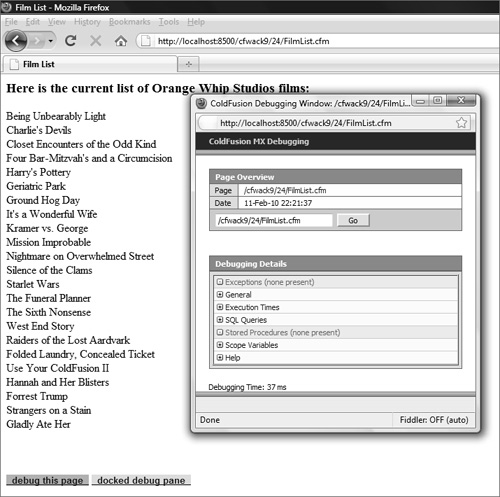
ColdFusion also features a powerful DHTML-based debugging interface. As seen in Figure 17.7, debug information is displayed in a tree control in a separate pop-up window, or docked to the output itself (by clicking the Docked Debug Pane link, shown at the bottom of Figure 17.7). The advantage of this dockable format (aside from a much cleaner and easier-to-use interface) is that the debug output doesn’t interfere with the page itself.
Figure 17.7 ColdFusion debug output can be displayed in a pop-up DHTML-based window.
To select this option, select dockable.cfm as the debug format in the ColdFusion Administrator.
Using Debugging Options
Regardless of how the debugging information is accessed (through any of the options just listed) you’ll have access to the same information:
• Execution time, so you can locate poorly performing code
• Database activity, so you can determine exactly what was passed to the database drivers (after any dynamic processing), what was returned, and how long this processing took
• Tracing information (explained below)
• Variables and their values
As you move from page to page within your application, the debug output will provide insight into what’s actually going on within your code.
Note
The exact information displayed in debug output is managed by options in the ColdFusion Administrator, discussed in Chapter 2.
Caution
While this debugging information is valuable, it does incur some overhead, even noticeable in development for some complex applications. It is especially recommended that you disable it in a production environment. Though a Debugging IP Addresses option is available (offered as the next link in the Administrator navigational toolbar), that feature simply controls who sees the debugging output; the overhead is still incurred on each page execution by all users.
Using Tracing
The ColdFusion Administrator debugging output contains a wealth of information, but you may on occasion also want to generate your own debug output. For example, you may want to
• Check the values of variables within a loop.
• Determine which code path or branch (perhaps in a series of <cfif> statements) is being followed.
• Inspect SESSION or other variables.
• Check for the presence of expected URL parameters or FORM fields.
• Display the number of rows retrieved by a query.
• Check the timing of a block of code.
This kind of information is useful in debugging logic problems—those annoying situations where code is valid syntactically, but some logic flaw (or unexpected situation) is preventing it from functioning as expected.
We previously discussed the <cfdump> tag, which by default displays its output in the generated output of the page. If you instead want to insert your own information within the automated debug output, you can use the <cftrace> tag, which embeds trace information on the page. The <cftrace> tag takes a series of attributes (all optional) that let you dump variable contents, display text (dynamic or static), abort processing, and more.
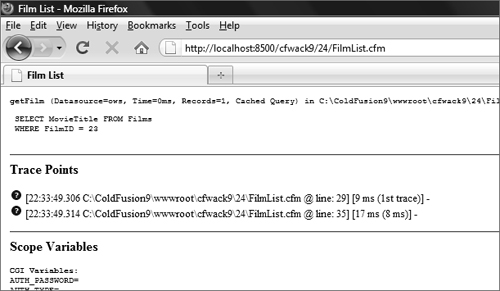
The simplest use of <cftrace> is to place a pair of the tags around a block of code; the generated output will then report the amount of time required to get to each trace and the difference in the amount of time between this operation and each subsequent one. Figure 17.8 shows the result of placing a pair of <cftrace> tags around a cfoutput loop. Note that the generated trace output is included with the standard debug output (if that option is enabled in the ColdFusion Administrator; see the Tracing Information option on the Debug Output Settings page).
Figure 17.8 Trace output (generated using <CFTRACE>) is included with debug output.
You can also use <cftrace> to display additional diagnostic data, using the text attribute. Simply embed such <cftrace> tags at strategic locations in your code. For example, if you’re trying to figure out why variables are being set to specific values, use <cftrace> statements at the top of the page, before and after any statements that could set variable values (or that could call code that may set variable values).
To output simple text use, the following <cftrace> syntax:
<cftrace text="Just before the cfinclude">
To display variable values, you could use the following:
<cftrace text="firstname at top of page" var="firstname">
Note that the <cftrace> tag writes its output both to the debugging output and to a cftrace.log file (in the ColdFusion logs directory). You can also cause it to display its output at the point where the tag is executed, using the Inline="yes" attribute.
Also note that tracing can be enabled and disabled on the Debug Output Settings page of the ColdFusion Administrator, so that you can leave the tags in your source code even in production. They will not generate any output or use any resources if the tracing information option in the Administrator is disabled.
Additional <cftrace> attributes allow for message categorization and prioritization, but the two examples here are usually all you need. By embedding <cftrace> blocks in your code you’ll get a clear and systematic view into what happened, when, and why.
Code Timing
Another challenge in solving problems with ColdFusion code entails understanding how long some tag or section of code takes to execute. Fortunately, ColdFusion offers several tools to help identify code timing:
• GetTickCount()
• <cftrace>
• <cftimer>
• cfquery.executiontime
• Result attribute
• Server monitor profiling feature
One of the oldest ways to identify code timing is to use the getTickcount() function, which returns a number of milliseconds since a point in the past. This function can be used to compare the count of milliseconds at one point to the count at a later point.
However, it can be simpler to use a similar, built-in feature of the <cftrace> tag. When this tag executes, it displays the elapsed time since a previous <cftrace> tag was executed. You can surround a code block you want to time with <cftrace> tags.
ColdFusion also has a tag devoted to code timing: <cftimer>. You wrap it around code to be timed, and it offers additional features that are different from (and some the same as) <cftrace>.
If you want to know how long a given <cfquery> tag took to execute, note that the available variable, cfquery.executiontime, holds the number of milliseconds. That shows the value for the last query executed, but as of ColdFusion 7, you can use the available Result attribute on any query, returning a structure that includes an executiontime value with the same timing information for that specific query (and disabling cfquery.executiontime).
Finally, the ColdFusion Enterprise server monitor includes profiling functionality that can show the time taken to execute each tag in an application. The server monitor is discussed in Chapter 47, “Monitoring System Performance,” in Volume 3.
Using the ColdFusion Log Files
ColdFusion logs all warnings and errors to log files, which aids you and Adobe Technical Support in troubleshooting problems. ColdFusion log files are created when the ColdFusion service starts. You can delete these log files if they get too large, or move them to another directory for processing. If you do move or delete the log files, ColdFusion creates new ones automatically.
Most of the ColdFusion log files are plain-text, comma-delimited files. You can import these files into a database or spreadsheet application of your choice for analysis.
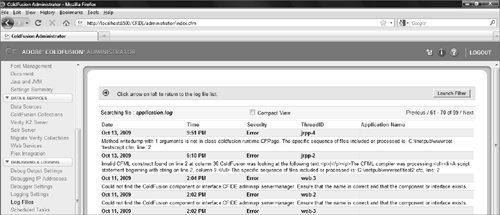
The ColdFusion Administrator Log Files page lists available log files (see Figure 17.9) and includes a sophisticated log file viewer that enables you to browse (see Figure 17.10), search, and analyze log file data as necessary.
Figure 17.9 The ColdFusion Administrator lists all available log files.
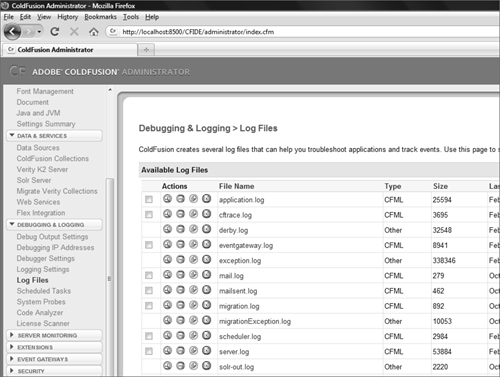
Figure 17.10 The Log Viewer supports browsing through log file entries.
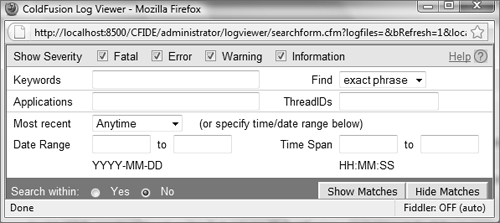
More sophisticated analysis filtering is supported (see Figure 17.11), allowing you to include or exclude filter conditions to locate exactly the logged messages you need. This is particularly useful on very busy systems, where multiple requests could be logging messages at the same time. Being able to filter by thread ID and time ranges helps find logging needles in the log file haystack.
Figure 17.11 Use the Log Viewer Filter window to search for specific log file entries.
Additionally, ColdFusion Builder adds a ColdFusion Tailview log viewer that permits access to and display of the log files from within the editor.
ColdFusion creates several log files. Some of the important ones are
• application.log: Contains generated CFML errors, syntax errors, and other runtime error conditions and messages.
• cftrace.log: Contains entries made using the <cftrace> tag.
• eventgateway.log: Contains errors and status messages related to the Event Gateway engine.
• exception.log: Contains Java exceptions thrown when errors occur.
• flash.log: Contains errors generated during Flash generation.
• mail.log: Contains errors generated while sending mail.
• server.log: Contains information about ColdFusion itself, including server stop and start times.
In addition to the standard log files, certain logs can be enabled based on ColdFusion Administrator settings (such as mailsent.log and scheduler.log), and specific operations (such as restoring an archive) can create their own log files.
As a rule, you should monitor and browse log files regularly, as these often contain the first indication of problems occurring. For added convenience, the log file viewer in the ColdFusion Administrator allows filtering, sorting, downloading for further analysis and archiving.
Tip
Some errors are browser related. If you’re having a hard time reproducing reported error messages, try to determine which version of which browser the user was running and on which platform. You may have run into browser bugs (some versions of popular browsers are very buggy). To help you find these problems, the log files list any identification information provided by a browser, along with the error message.
ColdFusion offers still more logs, which many miss since they are not listed on the ColdFusion Administrator Log Files page. Sometimes called the runtime or JRun logs, these can often provide vital additional information, especially regarding problems with ColdFusion itself.
While the logs discussed previously in this section typically are found in the [coldfusion]logs directory, these other logs typically are found in the [coldfusion]
untimelogs directory. They may have names like coldfusion-out.log and coldfusion-event.log. (In the Multiserver form of ColdFusion deployment, these logs are instead found in the [jrun4]logs directory.)
Preventing Problems
As mentioned earlier, the best approach to troubleshooting ColdFusion problems (and indeed any development problems) is to prevent them from occurring in the first place.
Bugs are inevitable. As the size of an application grows, so does the likelihood of a bug being introduced. As an application developer, you need to have two goals in mind:
• Develop bug-free code.
• In the event that your code isn’t bug-free, make sure it’s easy to debug.
As an application developer myself, I know that these are lofty goals. The reality is that application development almost always takes longer than planned, and sacrifices have to be made if release dates are to be met. Code quality is usually the first thing that gets sacrificed.
Sooner or later these sacrifices will come back to haunt you. Then come the long debugging sessions, rapid code fixes, software upgrades, and possibly even data conversion. Then, because the rapidly patched code often introduces bugs of its own, the whole cycle starts again.
Although there is no surefire way of preventing all bugs, some guidelines and coding practices can both help prevent many of them and make finding them easier when they do occur. Here are my 10 Commandments of ColdFusion Development:
1. Plan Before You Code. We’ve all done it, and probably more than once. ColdFusion makes it so easy to start coding that you’re often tempted to start projects by firing up an editor and creating CFM files. That’s a bad thing indeed. Nothing is more harmful to your development efforts than failing to plan properly. You should be spending more time planning than coding—and I don’t mean planning your IPO and subsequent retirement. Planning involves thinking through every aspect of your application, from database design to UI considerations, from resource management to schedules and deliverables, and from feature lists with implementation details to language and presentation. You’d never build a house without detailed blueprints (well, you might try, but you’d never get the necessary permits to start work), and building an application is no different. I’m constantly amazed by the number of applications I’m asked to look at that have no supporting documentation. And these aren’t just from small development shops; I’m talking about some of the largest and most respected corporations. Scalability problems? I wouldn’t doubt it. I’d actually be amazed if such an application ever did scale. You can’t expect scalability from an application that grew in spite of its developers. Nor can you expect it to be bug free, manageable, or delivered on time. Yes, I know that detailed planning takes time, time none of us have. But in the long run you’ll come out ahead.
2. Organize Your Application. An extension of planning your application is organizing it (along with any other applications). Applications are made up of lots of little bits and pieces, and keeping them organized is imperative. This includes directory structures and determining where common files should go, moving images to their own directory (or server), breaking long files into smaller, more manageable (and more reusable) ones (including CFCs), and even ensuring consistent organization among different applications. Going back to the prior commandment, Plan Before You Code, all organization should be documented in detail as part of that plan. You should also consider using ColdFusion frameworks such as Fusebox, Model-Glue, and Mach-II to help you structure your applications, especially if you work in a large team or have multiple developers performing maintenance on a project over time.
3. Set Coding Standards. This is an interesting one, and one I get asked about often. Adobe hasn’t published formal recommendations on coding standards, nor in my opinion should they. Adobe’s job is to create killer tools and products for developers, and our job is to use them however works best for us. I don’t believe that a single set of coding standards would work for all developers. At the same time, I don’t believe any developer should be writing code that doesn’t adhere to some standard—any standard. Coding standards include everything from file-naming and directory-naming conventions to variable-naming conventions, to code organization and ordering within your source, to error handling, to componentization, and much more. For example, if all variables that contain dates begin with dt, then references to a variable named dtOrderDate become self-explanatory. The purpose of coding standards is to ensure some level of consistency in your code. Whether it’s to allow other developers to understand and work with your code, or simply so that you’ll know what you did (and why) six months down the line, coding standards provide a mechanism to create code that describes and explains itself. There is no right or wrong coding standard, as long as one is used. However, you can use the ColdFusion MX Coding Guidelines, created for internal Adobe use but available publicly (http://livedocs.adobe.com/wtg/public/coding_standards/contents.html), as a starting point. Note that these guidelines have not been updated since ColdFusion 7.
4. Comment Your Code. This is an obvious one, but apparently few of us have the time to pay attention to the obvious. So, I’ll say it once again: All code must be commented. (For the record, I’d fire an employee on the spot for turning in code that wasn’t commented; that’s how serious an offense I believe this one to be.) Every source code file needs a descriptive header listing a description, the author information, the creation date, a chronological list of changes, any dependencies and assumptions, and any other relevant information. In addition, every conditional statement, every loop, every set of variable assignments, and every include or component reference must be commented with a simple statement explaining what is being done and why. It’s a pain, I know. But the next time you (or anyone else) have to work with the code, you’ll appreciate the effort immeasurably. And you might even be able to safely make code changes without breaking things in the process.
5. Never Make Changes on a Live Server. This is another obvious one, but one worth stating anyway. All development and testing should occur on servers established for just that purpose. Yes, this means you’ll need additional hardware, but the cost of a new box is nothing compared to the cost of bringing down your application because that little change wasn’t as little as you expected. And ColdFusion is available free for development, so each developer can have his or her own copy. Write your code, test it, debug it as necessary, deploy it to a testing server, test it some more, and test it some more, and then finally deploy it to your live production server. And don’t repeat this process too often. Again, don’t edit the code directly on the production server. Instead of uploading even slightly changed versions of your application every day, collect the changes, test them some more, and deploy them monthly, or weekly, or whenever works best for you. The key here is that your production server is sacred; don’t touch it at all unless you have to—and the less frequently, the better. Nothing is ever as minor and as isolated as it seems, and there is no change worth crashing a server over.
6. Functionality First, Then Features. This is yet another obvious one, and a common beginner’s mistake. Yes, writing fancy code or using DHTML menu-generation code (or Ajax or Flash Forms features) is far more fun than writing or using data-entry validation routines (especially server side), but validation routines are typically far more important to the success and reliability of your application. Concentrate on creating a complete working application; then pretty it up as necessary. Do so and increase the chance that you’ll finish on schedule for a change. The final result might not be as cool as you’d like, but there is something to be said for an application that actually works, even an uncool one. Furthermore, (as explained in the next commandment) debugging logic problems is difficult when the code is cluttered with fancy formatting and features.
7. Build and Test Incrementally. Testing and debugging complete applications is difficult. The bigger an application is, the more components are used, and the more developers working on a project, the harder debugging and testing is. When you develop core components of your application, test them. Write little test routines, create stubs to return hard-coded values, or use smoke-and-mirrors as necessary, but however you do it, do it. Every component you write must have its own test utility. Various CFML unit testing frameworks, such as CFUnit (http://cfunit.sourceforge.net/) and CFC-Unit (http://www.cfcunit.org/cfcunit/) are available. Feel free to use these if they help, or create your own. Obviously, you’ll have to test your complete application when you’re finished and some problems won’t come to light until then, but the more you can test code blocks in isolation, the better.
8. Never Reinvent the Wheel, and Plan Not To. This is one I have written about extensively. Write code with reuse in mind, and reuse code whenever possible. When designing your code, put in the extra time up front to ensure it isn’t hard-coded or highly task specific unless it absolutely has to be. The benefits? Being able to reuse existing code shortens your development time. You stand a far greater chance of creating bug-free code when you use components that have already been used and tested. Plus, if you do make subsequent fixes and corrections, all code that uses the improved components benefit. This has a lot of benefits and no downside whatsoever.
9. Use All the Tools at Your Disposal, Not Just ColdFusion. ColdFusion applications usually aren’t stand-alone entities. They rely on database servers, mail servers, etc. In addition, ColdFusion can leverage Web Services, Java, Flex, Ajax, Flash Remoting, LiveCycle Data Services, COM, .NET, CORBA, C/C++ code, and more. Use these tools, as many as necessary, and always try to select the best one for a specific job. The best ColdFusion applications aren’t the ones written purely in ColdFusion; they are the ones that leverage the best technologies for the job, all held together by ColdFusion.
10. Implement Version Control and Source Code Tracking. Source code will change, and changes are dangerous. As your applications grow, so does the need for tracking changes and source code control. Select a version control package that works for you, and use it. Key features to look for are the ability to lock files (so no one else edits a file while you edit it—if that does happen, someone’s changes will be lost) or merge concurrent changes, the ability to view change history (what changed, by whom, and when), the ability to roll back complete applications (so that when the latest upgrade bombs you can easily roll back an entire application to a prior known state), the ability to create and check file dependencies (so you’ll know what other code is affected by changes you make), and reporting. In addition, if you can integrate the product with ColdFusion Builder, that’s even better. The bottom line: I don’t care which product you use, just use one.
Tip
Until you implement a version-control mechanism, at least use the ColdFusion Builder Local History feature. You can right-click a file in the Navigator (project) view (or right-click in the editor while viewing a file opened from a project) and choose Compare With > Local History. This feature lets you see previous revisions of the file, though only up to a limit of days and amounts set in Window > Preferences > General > Workspace > Local History.
→ Chapter 11, “The Basics of Structured Development,” teaches the basics of code reuse and how to create your own components.