
10. Creating Tables
Lesson overview
In this lesson, you’ll learn how to do the following:
Convert text to a table, import tables from other applications, and create tables from scratch.
Change the number of rows and columns in a table.
Rearrange rows and columns.
Adjust row and column sizes.
Format tables with strokes and fills.
Specify repeating header rows for long tables.
Place graphics in table cells.
Create and apply table and cell styles.

This lesson will take about 45 minutes to complete. To get the lesson files used in this chapter, download them from the web page for this book at adobepress.com/InDesignCIB2023. For more information, see “Accessing the lesson files and Web Edition” in the Getting Started section at the beginning of this book.

With Adobe InDesign, you can easily create tables, convert text to tables, and import tables from other applications. Rich formatting options—including headers, footers, and alternating row and column patterns—can be saved as table styles and cell styles.
Getting started
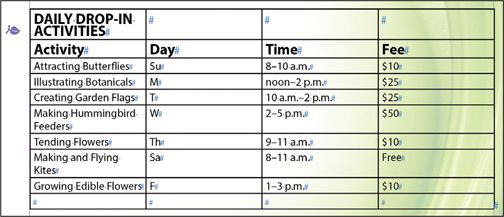
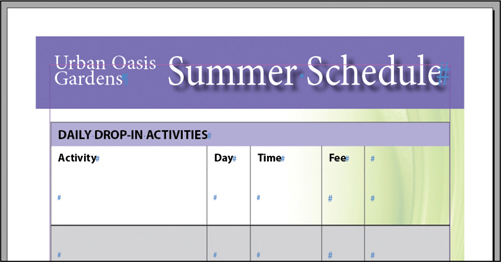
In this lesson, you’ll work on a fictional botanic gardens activity flyer designed to be attractive, easy to use, and easy to revise. You’ll convert text to a table and then format the table using options in the Table menu and various panels. The table will include header rows that repeat when the table flows across multiple pages. Finally, you will create a table style and a cell style so that you can apply formatting quickly and consistently to other tables.
To ensure that the preferences and default settings of your InDesign program match those used in this lesson, move the InDesign Defaults file to a different folder following the procedure in “Saving and restoring the InDesign Defaults file” on pages 3–4.
 Note
NoteIf you have not already downloaded the project files for this lesson to your computer from your Account page, make sure to do so now. See “Getting Started” at the beginning of the book.
Start InDesign.
The InDesign Start screen displays. Click Open at the left. (If the Start screen does not display, choose File > Open from the InDesign menu bar.)
Open the 10_Start.indd file in the Lesson10 folder, located inside the Lessons folder within the InDesignCIB folder on your hard drive.
Choose File > Save As, rename the file 10_Tables.indd, and save it in the Lesson10 folder.
To ensure that the panels and menu commands match those used in this lesson, choose Window > Workspace > [Advanced], and then choose Window > Workspace > Reset Advanced.
NoteTo better view the interface onscreen or in print, the screen captures in this book reflect the Medium Light interface rather than the default setting of Medium Dark. In addition, some screen captures illustrate User Interface Scaling for a closer look at interface elements. You can modify interface settings in Preferences.
If you want to see what the finished document looks like, open the 10_End.indd file in the same folder. You can leave this document open to act as a guide as you work.

Working with tables
InDesign tables are grids of individual cells set in vertical columns and horizontal rows. To create a table, you can convert existing text into a table, insert a new table at an insertion point in text (which anchors the table in the text), create a new freestanding table, or import a table from another application (such as Microsoft Excel).
You will use the Type tool to edit and format tables. Controls for formatting tables are in the Tables menu, Tables panel, Properties panel, and Control panel. Throughout this lesson, you will experiment with different options for selecting table elements and modifying tables. Once you become accustomed to working with tables, you can use the options that work best for you.
Converting text to a table
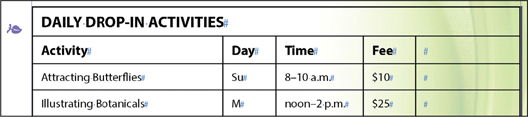
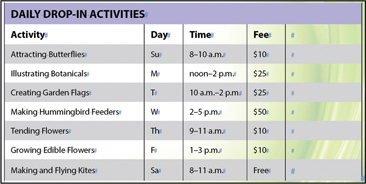
Often, the text for a table already exists in the form of tab-delimited text, in which the columns of information are separated by tab characters and the rows of information are separated by paragraph returns. In this case, the InDesign document was received from the botanic gardens in its current tab-delimited state. You will select this text and convert it to a table.
Choose View > Actual Size and scroll as necessary to better see the text.
NoteAs you work through this lesson, change the zoom level to suit your screen size and vision.
Using the Type tool (
 ), click in the text frame starting with the words “DAILY DROP-IN ACTIVITIES.” Choose Edit > Select All.
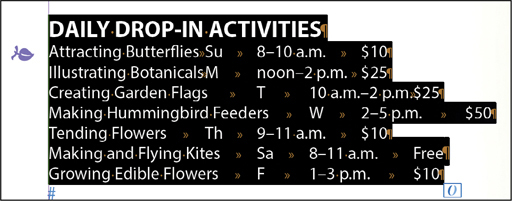
Choose Table > Convert Text To Table.
NoteIf you do not see the paragraph returns, tabs, and spaces, choose Type > Show Hidden Characters.
In the Convert Text To Table dialog, you will indicate how the selected text is currently separated. Because Hidden Characters (Type menu) is selected, you can see that the columns of information are separated by tabs (
 ) and that the rows are separated by paragraph returns (
 ).
).From the Column Separator menu, choose Tab. From the Row Separator menu, choose Paragraph.
Confirm that Table Style is set to [No Table Style], and then click OK.
 Tip
TipMicrosoft Word users often align columns onscreen with tabs, including entering multiple tabs between columns of data. While this may visually align the text in the Word document, it will result in extra columns and data in the wrong place. Take a look at the tab-delimited text before converting it to a table. If you spot instances of two tabs (
) in a row, you can delete the second tab or use Find/Change to search for two instances of a tab and replace them with one tab.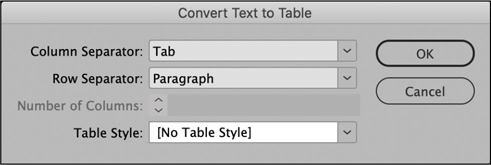
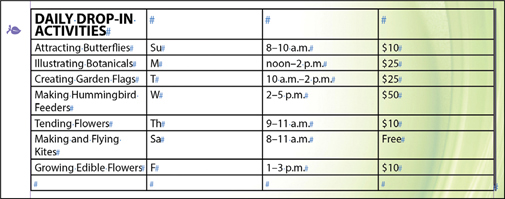
The new table is automatically anchored in the frame that contained the text.
Choose File > Save.
Changing rows and columns
Even when you start with source data from a client, you will often need to make changes such as adding a few rows, rearranging text, and editing content to complete the table. Once a table is created, you can easily add rows and columns, delete rows and columns, merge cells, rearrange rows, adjust row height and column width, and specify text inset for cells. In this section, you will complete the table content so that you know its size before you start formatting it.
Adding and deleting rows
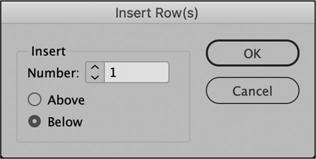
You can add rows above or below a selected row. The controls for adding and deleting columns work the same as for adding and deleting rows. Here, you will add a row to the top of the table to contain the column descriptions.
Using the Type tool (
), click in the first row of the table, which starts with “DAILY,” to activate a cell. You can click in any cell.Choose Table > Insert > Row.
In the Insert Row(s) dialog, type 1 in the Number field, and click Below. Click OK to add the row.
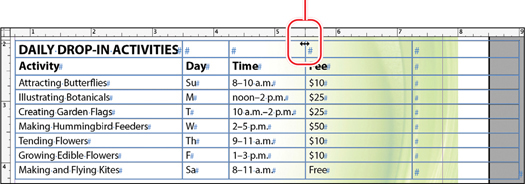
Click in the first new cell and type Activity. To add column heads to the remaining cells, click with the Type tool in each empty cell, or press the Tab key to navigate from cell to cell. Type the following text in each cell, as shown:
Second cell: Day
Third cell: Time
Fourth cell: Fee
Using the Type tool, click in the first cell of the second row, and then drag to the right to select all cells in the row with the new column headings.
Choose Type > Paragraph Styles. If necessary, click the arrow next to the Table Styles group to open it.
Click Table Column Heads in the Paragraph Styles panel. Choose Type > Paragraph Styles to close the panel.

Click in the cell containing the word “Fee” to activate the cell.
You will insert a column to the right of this column to contain images.
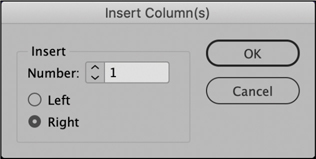
Choose Table > Insert > Column.
In the Insert Column(s) dialog, type 1 in the Number field, and click Right. Click OK to add the column.
The table is now wider than the frame and the page; you will resolve that later.

Choose File > Save.
Deleting rows
You can delete selected rows and columns. Here, you will delete the blank row at the bottom of the table.
![]() Tip
Tip
To activate a row or column to delete, click in it. To select multiple rows to delete, position the Type tool on the left edge of the table until the arrow displays; then drag to select the rows. To select multiple columns to delete, position the Type tool on the top edge of the table until the arrow displays; then drag to select the columns.
Using the Type tool (
), move the pointer over the left edge of the last row of the table until it appears as a horizontal arrow ( ). Click to select the row.
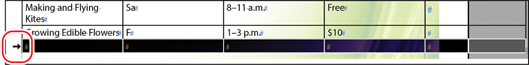
Choose Table > Delete > Row.
Choose Edit > Deslect All, and then choose File > Save.
Rearranging rows and columns
While working on a table, you may find that information works better in a different order, or you may discover a mistake. In that case, you can select and drag rows or columns to a new location. The rows in this table are in day-of-the-week order, but the Friday row is in the wrong location.
![]() Tip
Tip
To drag and drop rows or columns, you must select the entire row or column. To drag a copy of a row or column to a new position, press Alt (Windows) or Option (macOS) while dragging.
Locate the last row of the table, which starts with the word “Growing”.
Using the Type tool (
), move the pointer over the left edge of the “Growing” row until it appears as a horizontal arrow ().Click to select the row, and then release the mouse button.
The row is selected so that you can drag it up or down within the table.
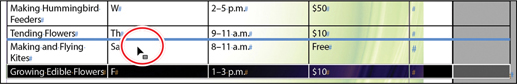
Click and hold in the selected row, and then drag the “Growing Edible Flowers” row up and drop it just under the “Tending Flowers” row. A bold blue line indicates where the row will be inserted.
Choose Edit > Deselect All, and then choose File > Save.
Adjusting column widths, row heights, and text placement
Columns and rows, and the way text fits within them, often need fine-tuning according to the content and the design. By default, table cells expand vertically to fit their content—so if you keep typing within a cell, it gets taller. You can, however, specify a fixed row height or column width. Or you can have InDesign create columns or rows of equal size within the table.
In this exercise, you will manually adjust the column widths, and then you will modify how the text fits within the cells.
Adjust the zoom as necessary to view the table.
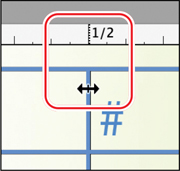
Using the Type tool (
), point at a vertical divider between any two columns. When the double-arrow icon ( ) displays, drag to the left or right to resize the column.
Choose Edit > Undo. Experiment with resizing columns and rows a few more times to get a feel for the tool. Choose Edit > Undo after each move. As you drag, keep an eye on the horizontal and vertical rulers on the document window.
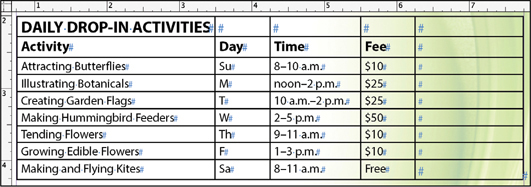
Place the final columns by dragging the right edge of each column, using the horizontal ruler at the top of the window as a guide.
TipIf you want columns of the same width, rows of the same height, or both, use the Table > Distribute Columns Evenly or Table > Distribute Rows Evenly commands.
Activity column: 3.5“
Day column: 4.25“
Time column: 5.5“
Fee column: 6.25“
Blank image column: 7.75“
TipAfter you manually adjust the column widths, they are more suited to the content in each column.
A guide on the horizontal ruler indicates the placement of the right edge of the column.
Now that the column widths better fit the text, you will add a little space around the text in the cells. In this case, you will change the entire table, but you can modify selected cells only.
Choose Window > Type & Tables > Table to open the Table panel.
Click anywhere in the table, and choose Table > Select > Table.
Confirm that Make All Settings The Same (
 ) is selected to increase the inset on all four edges of each cell. Type .125 in inside the Top Cell Inset field (
 ), and press Enter (Windows) or Return (macOS). Tip
You can click the arrows (
 ) next to any field to increase or decrease its value.
With the table still selected, click Align Center (
 ) in the Table panel.
This centers the text vertically within each cell.
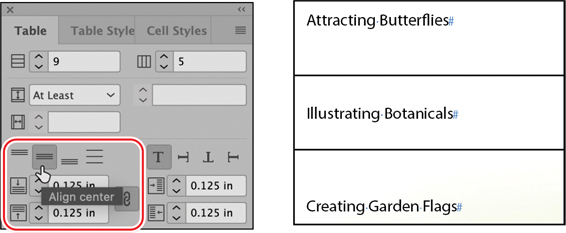
See the three cell alignment options at right: Align Top, Align Center, and Align Bottom.
Click anywhere in the table to deselect the cells. Drag the Table panel to the dock so you can see more of the page.
Choose File > Save.
Merging cells
You can merge adjacent selected cells to produce a single cell. Here, you will merge the cells in the top row so that the header “DAILY DROP-IN ACTIVITIES” spans the table.
Choose View > Fit Page In Window or adjust the zoom level for comfortable viewing.
Using the Type tool (
), click in the first cell of the first row, and then drag to select all the cells in the row.Choose Table > Merge Cells. Click the pasteboard to deselect the table.
TipThe Properties and Control panels both have a Merge Cells icon (
 ) for easy access.
Choose File > Save.
Importing tables
Placing tables from Word or Excel
InDesign can import tables from other applications, including Microsoft Word and Microsoft Excel. To import a table, follow these steps:
![]() Note
Note
Importing a table is not part of completing the lesson document. If you want to experiment with importing a table, you can try it with your own Excel or Word file.
Using the Type tool (
), click to place an insertion point in a text frame.Choose File > Place.
In the lower-left corner of the Place dialog, select Show Import Options.
Select a Word file (.doc or .docx) that contains a table, or select an Excel file (.xls or .xlsx).
Click Open.
Use the Import Options dialog to specify how to handle the formatting in Word tables. For Excel files, you can specify what worksheet and cell range to import along with how to handle the formatting.
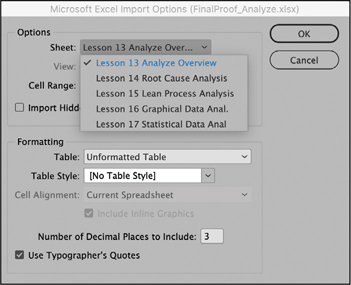
The Import Options dialog for specifying the spreadsheet, cells, and formatting to import.
Linking to tables
When you place a table, you can create a link to the external file. Then, if you update the Word or Excel file, you can easily update that information in the InDesign document. To link to imported tables, follow these steps:
![]() Note
Note
For tables to retain their InDesign-applied formatting when an imported file is updated, all cells in the InDesign table must be formatted with table and cell styles. Header and footer rows must be reapplied when updating a link.
Choose Edit > Preferences > File Handling (Windows) or InDesign > Preferences > File Handling (macOS).
In the Links section, select Create Links When Placing Text And Spreadsheet Files, and then click OK.
If the data in the source file changes, use the Links panel to update the table in the InDesign document.
Formatting a table
Formatting a table with a border and cell strokes helps separate the information. The border is a stroke that lies outside the entire table. Cell strokes are lines within the table that set the individual cells apart from each other. InDesign includes many easy-to-use formatting options for tables. You can use these options to make tables attractive and help them convey information to readers. In this section, you will specify fills and strokes for the table.
Adding a fill pattern
To achieve effects such as shading every other row, InDesign provides fill patterns for both rows and columns. You can specify where the pattern starts, which allows you to exclude any header rows. As you add, delete, and move rows and columns, the pattern updates automatically. You will add a fill to every other row in this table.
Using the Type tool (
), click anywhere in the table to activate it.Choose Table > Table Options > Alternating Fills.
From the Alternating Pattern menu, choose Every Other Row. Leave the default settings for the remaining options.
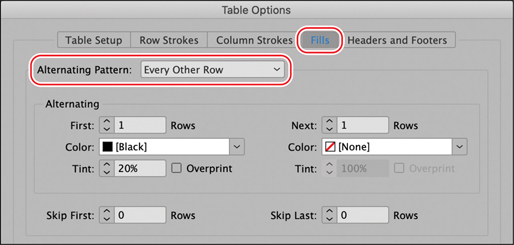
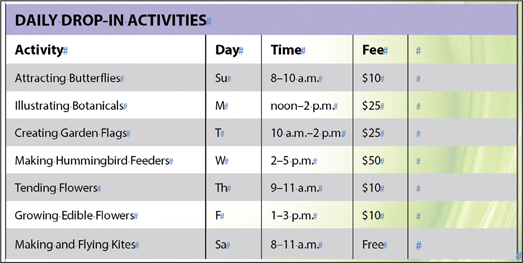
Click OK. Every other row now has a gray background.
Choose File > Save.
Applying a fill color to cells
An entire table can have a fill color, and each cell can have its own fill color. Using the Type tool, you can drag to select any contiguous cells to apply a fill color. In this section, you will apply a fill color to the header row.
Using the Type tool (
), move the pointer over the left edge of the “DAILY DROP-IN ACTIVITIES” row until it appears as a horizontal arrow (). Click to select the row.Choose Window > Color > Swatches.
Select the Fill box (
 ) in the Swatches panel, and then click the Purple-Cool swatch. Tip
You can use the Fill box on the Control panel to apply color to cells as well.
Drag the Tint slider to 50%, and then choose Edit > Deselect All to view the colors.

Choose Window > Color > Swatches to close the Swatches panel, and then choose File > Save.
Editing cell strokes
Cell strokes are the lines around individual cells. You can remove or change the stroke for selected cells or for the entire table. In this section, you will remove the horizontal strokes because the alternating pattern provides enough delineation.
Using the Type tool (
), click anywhere in the table, and then choose Table > Select > Table.Locate the proxy preview (
 ) in the center of the Control panel (at the top of the screen).
Each horizontal and vertical line in the proxy represents a row stroke, column stroke, or border stroke. You can click the lines to toggle the selection on (blue) or off (black). Toggling a line to the on position selects that particular stroke for formatting.
Click all three horizontal lines in the proxy to select them. Ensure that all horizontal lines (and no vertical lines) are selected (toggled on) on the proxy. The selected lines are blue.
Type 0 in the Control panel’s Stroke field. Press Enter or Return.
Click all three vertical lines in the proxy to select them. Deselect the horizontal lines.
Select 0.5 pt from the Stroke menu on the Control panel.
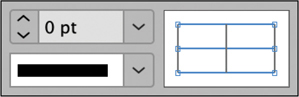
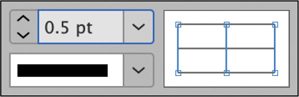
Specifying no (0) stroke for the horizontal lines (left) and 0.5 pt stroke for vertical lines (right). Note the selected strokes on the proxy are blue.
Choose Edit > Deselect All to see the results.
Choose File > Save.
Adding table borders
A table border is a stroke around the entire table. As with other strokes, you can customize the border’s width, style, color, and more. In this section, you will apply a border to the table.
Using the Type tool (
), click anywhere in the table.Choose Table > Select > Table.
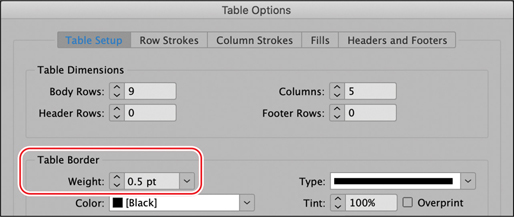
Choose Table > Table Options > Table Setup. This opens the Table Options dialog and displays the Table Setup tab.
On the Table Setup tab, in the Table Border section, choose 0.5 pt from the Weight menu.
Click OK, and then choose Edit > Deselect All.
Choose View > Screen Mode > Preview to see the results of your formatting.
Choose View > Screen Mode > Normal, and then choose File > Save.
Adding graphics to table cells
You can use InDesign to create effective tables that combine text, photographs, and illustrations. By default, table cells are essentially small text frames, but you can convert a text cell to a graphic cell. At that point, the cell essentially functions as a graphics frame whose dimensions are governed by the table. In this exercise, you will add photos to some of the course descriptions.
![]() Tip
Tip
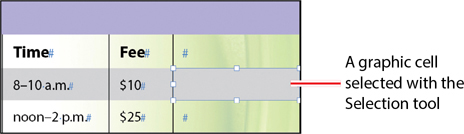
To format a cell or convert a cell’s content, you must first select the cell. To select a graphic cell with the Type tool, drag across the graphic cell.
Converting cells to graphic cells
First, you will convert a selected cell to a graphic cell using the Table menu and the Table panel. Later, you will see how to automatically convert a cell to a graphic cell by placing an image.
Using the Type tool (
), click inside the far-right cell of the table’s first body row (the “Attracting Butterflies” row).Choose Table > Select > Cell to select the cell.
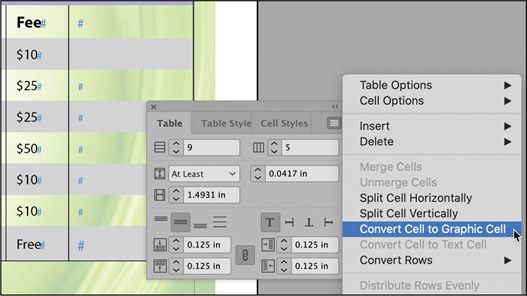
With the cell selected, choose Table > Convert Cell To Graphic Cell.
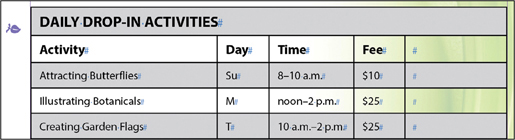
Click inside the far-right cell in the third body row (the row describing “Creating Garden Flags”) to select it.
TipYou can convert a text cell to a graphic cell simply by placing an image in it. However, if you are creating a template that indicates where images should be placed, it would be helpful to the template users to convert the cells to graphic cells.
If necessary, choose Window > Type & Tables > Table to display the Table panel.
Choose Convert Cell To Graphic Cell from the Table panel menu.
Placing images in graphic cells
Now, you will place images in the two cells converted to graphic cells. You will then automatically convert two text cells to graphic cells as you place images.
Using the Selection tool (
 ), select the new graphic cell in the “Attracting Butterflies” row. Note
If necessary, select Show Import Options in the Place dialog.
Choose File > Place. In the lower-left corner of the Place dialog, select Replace Selected Item if necessary.
Navigate to the Lesson10 folder, select the Butterfly.jpg file, and then click Open.
To fit the cell to the image, choose Object > Fitting > Fit Frame To Content.
TipUse options in the Object > Fitting menu, such as Fit Content Proportionally, to adjust the image size and placement within the cell.

Select the new graphic cell in the “Creating Garden Flags” row.
Choose File > Place. In the Place dialog, select the GardenFlag.jpg file in the Lesson10 folder, and click Open.
To fit the cell to the image, use the keyboard shortcut for Fit Frame To Content: Ctrl+Alt+C (Windows) or Command+Option+C (macOS).
Choose File > Place. In the Place dialog, select the WateringCan.jpg file. Then, Ctrl-click (Windows) or Command-click (macOS) the Kite.jpg file to load the pointer with both the WateringCan.jpg and Kite.jpg files. Click Open.
Click the loaded graphics icon (
 ) in the last cell of the “Making and Flying Kites” row. Note
If you place the wrong image in a cell, choose Edit > Undo and try again.
Click the loaded graphics icon in the last cell of the “Tending Flowers” row.
Using the Selection tool, click the image of the watering can and fit the cell to the image using the keyboard shortcut in step 7 or the Object > Fitting > Fit Frame To Content command. Repeat the process for the kite image.

Choose Edit > Deselect All, and then choose File > Save.
Adjusting the row heights
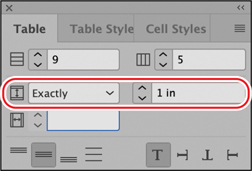
The images are 1 inch in height, so you will now make all the table body rows 1 inch high.
If necessary, choose Window > Type & Tables > Table to open the Table panel.
NoteAs you work through this exercise, remember to change the zoom level to suit your screen size and vision.
Using the Type tool (
), move the pointer over the left edge of the first body row (starting with “Attracting Butterflies”) until it appears as a horizontal arrow ().Drag from the first table body row, starting with “Attracting Butterflies,” to the last table row, ending with “Free”.
With the table body rows selected, choose Exactly from the Row Height menu in the Table panel. Then, type 1 in inside the Row Height field to the right of the menu. Press Enter or Return.
Choose Edit > Deselect All to see the results.
Choose File > Save.

Anchoring graphics in table cells
You can have both text and graphics in a cell by anchoring images in the text. In this exercise, you will place a leaf icon next to the classes that are held off-campus.
![]() Tip
Tip
Objects that are anchored in text will flow with the text as it’s edited and reformatted.
Zoom to see the leaf icon in the left margin of the left page.
Using the Selection tool (
), select the leaf icon immediately to the left of the header row.
Choose Edit > Cut.
Select the Type tool (
), or double-click inside the table to automatically switch to the Type tool.In the second body row of the table, click immediately after “Illustrating Botanicals” and type a space.
Choose Edit > Paste.

Click the Type tool after “Making and Flying Kites,” type a space, and then choose Edit > Paste.
Choose File > Save.
Creating a header row
A table’s name and the column headings are often formatted to stand out from the rest of the table. To do this, you can select and format the cells that contain the header information. This header information may need to repeat if the table flows across multiple pages. With InDesign, you can specify header and footer rows that repeat when a table continues to the next column, frame, or page. Here, you will select the first two rows of the table and specify them as header rows that repeat.
![]() Tip
Tip
When you edit text in a header row, the text is automatically updated in other instances of the header row. You can edit the text in the table’s original header row only; other instances of the header are locked.
Choose View > Fit Page In Window or adjust the zoom to your comfort level.
Using the Type tool (
), move the pointer over the left edge of the first row until it appears as a horizontal arrow ().Click to select the entire first row, and then drag to include the second row. You will have selected “DAILY” through “Fee.”

With the two rows still selected, choose Table > Convert Rows > To Header.
Click the Type tool in the last row of the table.
Choose Table > Insert > Row.
In the Insert Row(s) dialog, type 4 in the Number field, and click Below. Click OK to add the rows.
Choose Layout > Next Page to view the table on page 2. Notice that the continuation of the table has the same header rows.
NoteYou can use these new blank rows to practice typing text in cells. Remember to use the Type tool, press Tab to jump to the next cell, and press Shift+Tab to go back to the previous cell.
Choose Layout > Previous Page to return to page 1, and then choose File > Save.
Creating and applying table and cell styles
To quickly and consistently apply formatting to tables, you can create table styles and cell styles. A table style applies to the entire table, whereas cell styles can be applied to selected cells, rows, and columns. Here, you will create a table style and a cell style so that you can quickly apply the formatting in other tables.
Creating table and cell styles
In this exercise, you will create a table style for the basic table formatting and a cell style for the header rows. Rather than specify formatting for the styles, you will simply create styles based on the formatting of the table.
Using the Type tool (
), click anywhere in the table on page 1. TipThe Table panel is grouped with the Table Styles and Cell Styles panels by default.
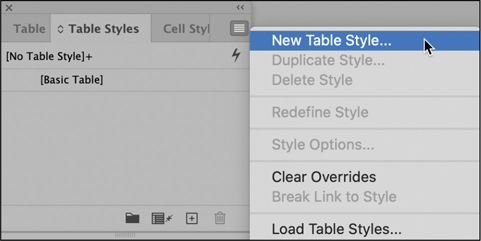
Choose Window > Styles > Table Styles, and then choose New Table Style from the panel menu.
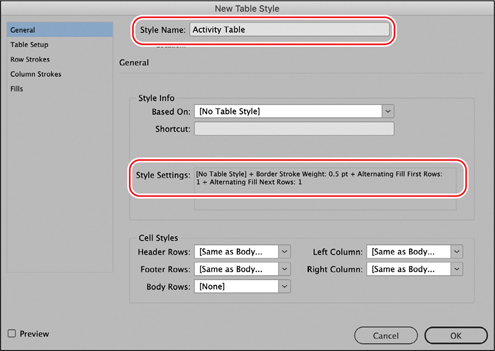
Name the style Activity Table in the Style Name field. Notice that all the table formatting you applied is listed in the Style Settings area.
Click OK. The new style appears in the Table Styles panel.
Using the Type tool, click in the first row of the table, which says “DAILY DROP-IN ACTIVITIES.”
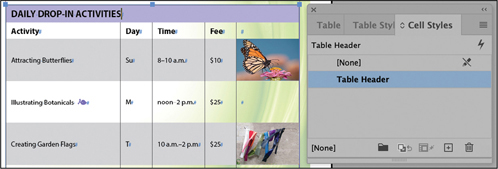
Choose Window > Styles > Cell Styles, and then click Create New Style (
 ) at the bottom of the panel.
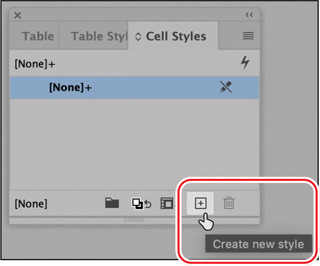
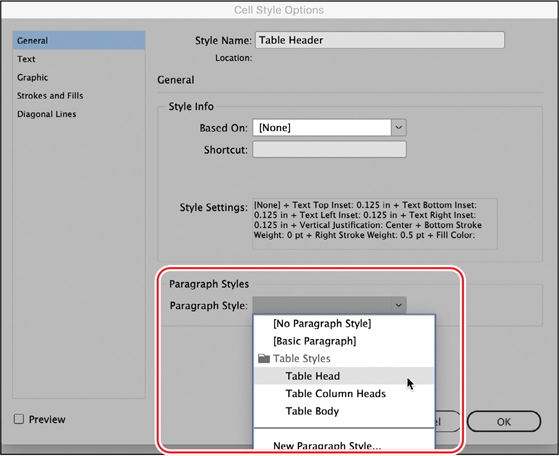
Double-click the new Cell Style 1 to open the Cell Style Options dialog. Name the style Table Header in the Style Name field.
You will now specify a different paragraph style for the text in cells with the Table Header style applied.
From the Paragraph Style menu, select Table Head. This is the paragraph style already applied to the text in the header rows.
TipTo automate formatting, you can specify a paragraph style for header rows within a table style.
Click OK.
Choose File > Save.
Applying table and cell styles
Now, you will apply the styles to the table. To make global changes to table formatting later, you can simply edit the table or cell styles.
Using the Type tool (
), click anywhere in the table.Click the Activity Table style in the Table Styles panel.
Using the Type tool, click in the first header row of the table. Choose Table > Select > Row to select the row.
In the Cell Styles panel, note that the Table Header style is applied. To apply a style, you simply click its name.
As a final step, you’ll preview the flyer in its current state. If you were going to complete this flyer, you might enter data into the table cells in the blank rows on page 2 and add more rows as necessary.
Choose Edit > Deselect All, and then choose View > Fit Page In Window.
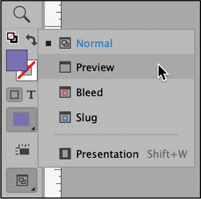
Select Preview from the Screen Mode button at the bottom of the Tools panel, and then press Tab to close all panels.
Choose File > Save.
Congratulations! You have now completed this lesson.
Exploring on your own
Now that you’re skilled in the basics of working with tables in InDesign, you can experiment with creating a new, freestanding table.
Navigate to the bottom of page 2.
TipIf you click the table creation pointer between column guides on the page, the new table will span the width of the column.
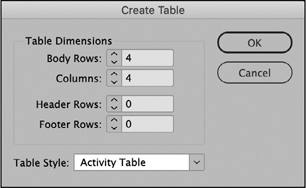
Choose Table > Create Table, and enter the number of rows and columns you want. Select an option from the Table Style menu, if you prefer. Click OK.
Drag the table creation pointer (
 ) anywhere on the page. When you release the mouse button, InDesign creates a table that matches the dimensions of the rectangle you draw.

Using the Type tool (
), click the insertion point in the first cell and then type. Use the arrow keys on the keyboard to navigate among the cells.To convert the table back to text, select it and choose Table > Convert Table To Text. By default, tabs separate what were previously columns and paragraph breaks into separate rows; you can also modify these options.
Review questions
1 What are the advantages of creating InDesign tables rather than creating the look with rules, frames, tabs, and the like?
2 How can you ensure that a table’s title and column headings repeat if a table continues on multiple pages?
3 What tool is used most frequently when you work with tables?
4 How can you put graphics in table cells?
Review answers
1 Tables give you much more flexibility and are far easier to format. In a table, text can wrap within a cell, so you don’t have to add extra lines to accommodate cells that contain a lot of text. Also, you can assign styles to selected cells, rows, and columns—including character styles and even paragraph styles—because each cell functions like a separate text frame.
2 Select the heading rows you want to repeat and then choose Table > Convert Rows > To Header. You can also repeat footer rows using Table > Convert Rows > To Footer.
3 The Type tool must be selected to work with a table. You can use other tools to work with the graphics within table cells, but to work with the table itself, such as selecting rows or columns, inserting text or graphics, adjusting table dimensions, and so forth, you use the Type tool.
4 You can select a cell with the Type tool, select Table > Convert Cell To Graphic Cell, and then use File > Place to import a graphic. If you simply select a cell and import a graphic through File > Place, the cell is converted automatically to a graphic cell. Another way to add a graphic to a cell is to anchor one in the text inside the cell.