CHAPTER 2
Straight-Lin Chart
The first indicator we establish is a simple, straight-line chart. Those familiar with Compound Stock Earnings (CSE) trading techniques are very accustomed to looking at charts and analyzing them. The function of the simple straight-line chart remains the same: We use it to identify the current cycle of the stock and the position in the current cycle and to see the regular and inverted bias V.
A line chart presents a graphic image (albeit limited) of where the price of a stock has traveled over a given time period. The closing prices are often seen as the most important ones to track. We follow closing prices to enter and exit positions and to apply all CSE management rules. All line charts will produce Vs. The challenge for any trader tracking a line chart is validating the V. All of the technical indicators we study have been applied, tested, and back-tested to validate the V. We therefore will be able to determine whether a V is true or false.
Validating the V is the single most important skill that traders must learn. Mastery of this skill will improve your timing when entering new positions and tethered slingshots (TSSs). It will also increase your patience and allow you to gain added confidence with your decisions. Your ability to master validating the V is based solely on your ability to understand several very important and simple technical indicators.
The chart in Figure 2.1 shows the simple line chart as it travels, creating Vs, or changes, in closing prices. Trading covered calls is very forgiving. It is not necessary to know the exact place or time to enter a new position, just a general area of when to enter it. Obviously the more control that we have over patience and timing, the more profitable our trades will be. Ideally we want to BTO (buy to open) new positions at point 1 and STC (sell to close) at point 2 (see Figure 2.1). This position is a perfect example of a 10-cent rule trailing stop.
FIGURE 2.1 RRBG—The Line Chart

And how do we know that?
The daily movement of the tic up or down is an emotional event. It is the result of news or events around the world related to fear, greed, and other emotions.
The interpretation of these events has a direct effect on the market. The daily global premarket reports cause the major markets in America to move either up or down.
Technical charting indicators are the only way to track this movement to create a visual graphic so traders can determine the probability of cycle direction.
■ Straight-Line Charting/Parallel Channels
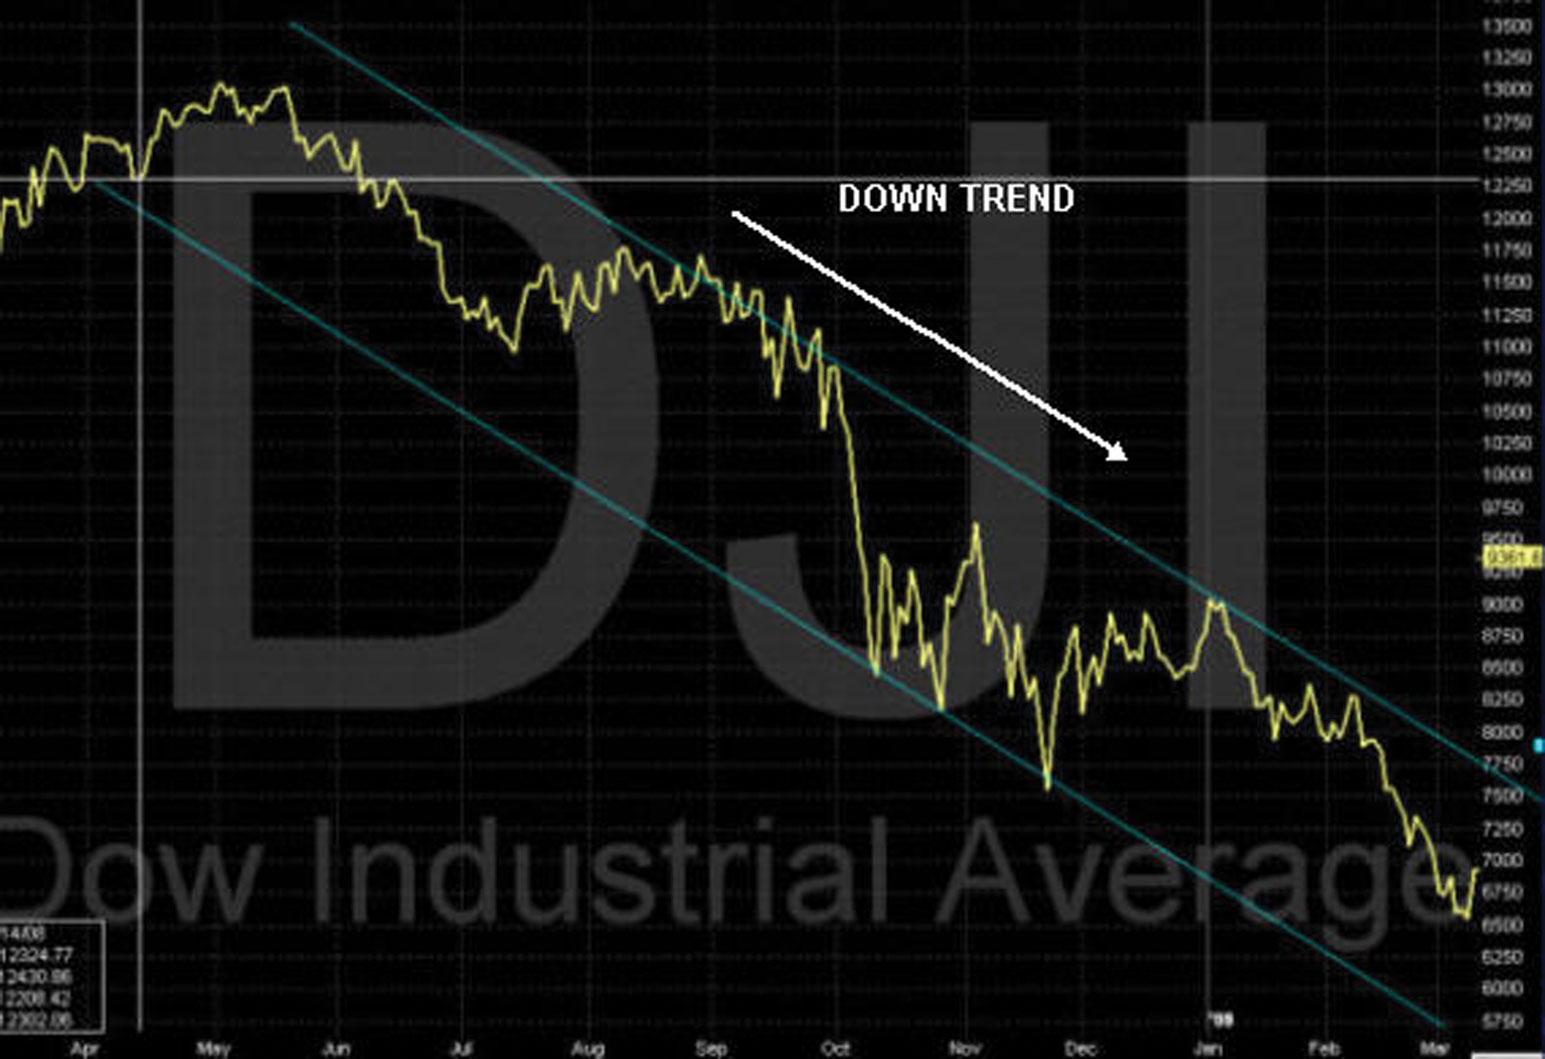
Straight-line charts, which are made up of support and resistance lines, are drawn to determine the direction of a trend with the expectation that a trend line will define cycles (see Figure 2.2). The challenge for all traders is to determine the approximate lower 25 percent or the upper 75 percent of the cycle. This technique can be accurate if the trader can identify the trend line early in its path, and if the trend will remain in that path.
FIGURE 2.2 DJI—Parallel Channels
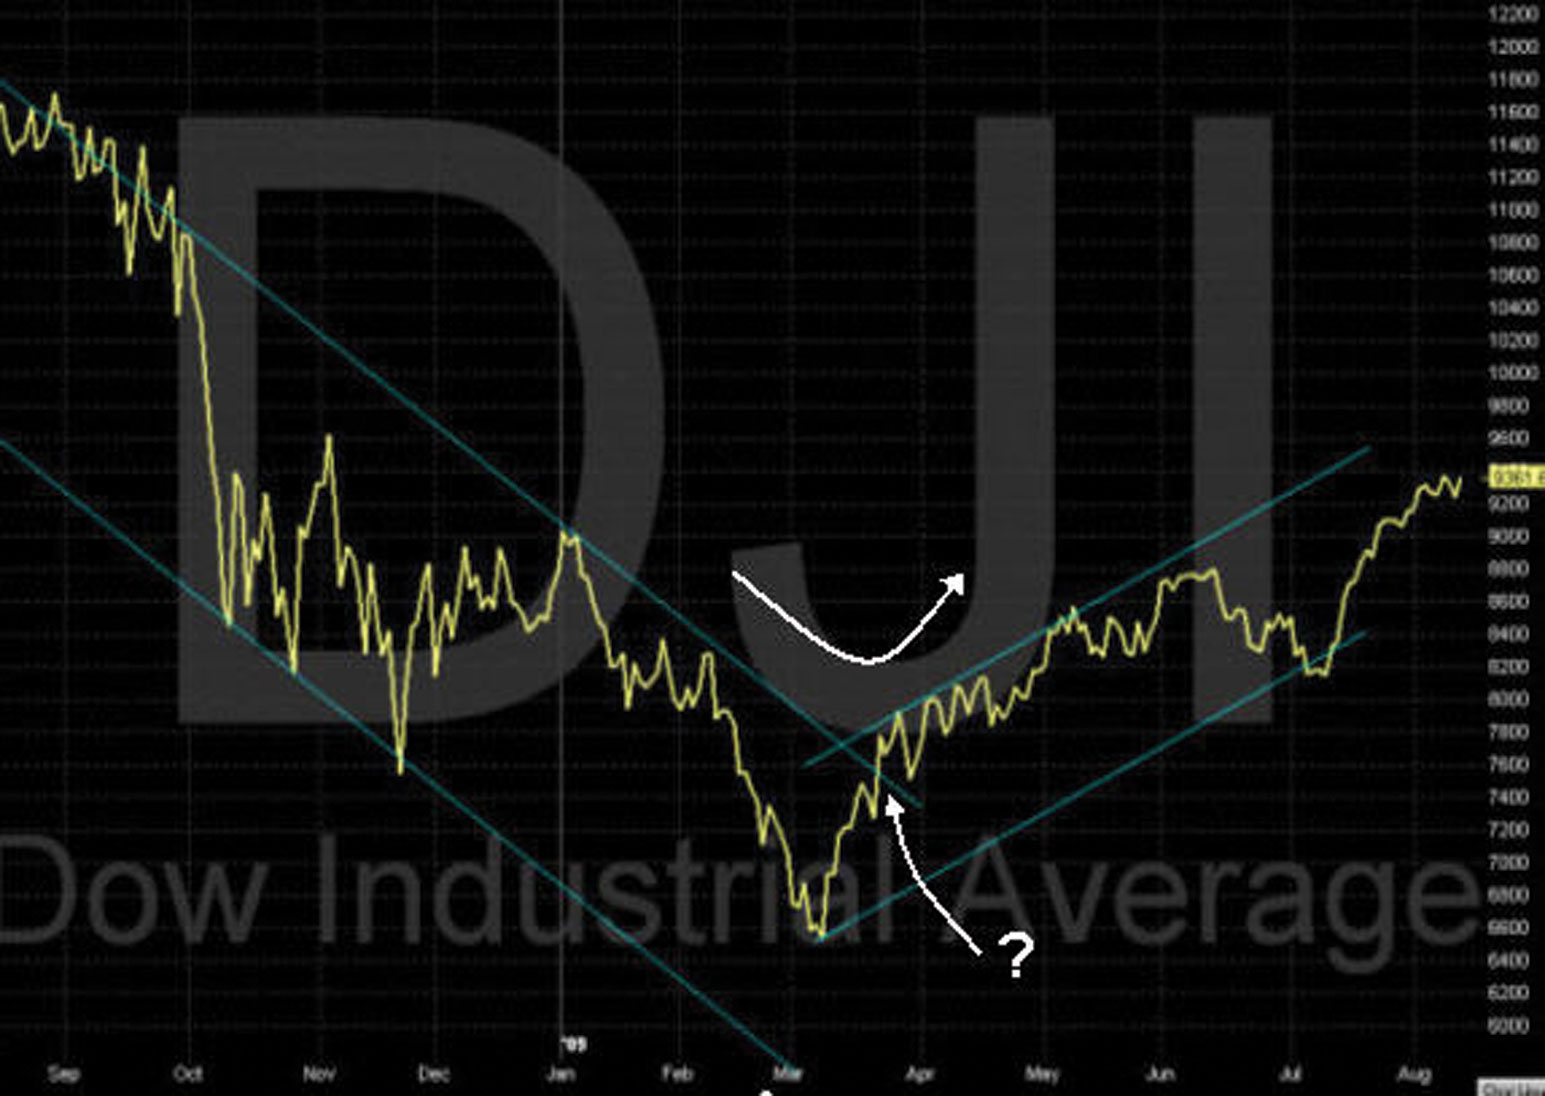
The challenge, however, is to identify a cycle that is about to bend or change the trend line, as in mid-March. The result is a cycle where the tic breaks through resistance undetected by straight-line charting (see Figure 2.3). Advanced Charting addresses this problem by identifying the change in cycle direction before it happens.
FIGURE 2.3 DJI—Parallel Channel Challenge