CHAPTER 10
RS: Advanced Charting Relative Strength Indicator
The relative strength (RS) indicator was presented at the 2010 Compound Stock Earnings Masters Seminar, It was tested and back-tested for months with hundreds of stocks prior to that presentation.
Earlier in this book, we reviewed and discussed four phases of a cycle: birth, momentum, exhaustion, and death. Understanding these four phases and correct chart interpretation increases the probability of correct entry and exits of trades.
Advanced Charting is continually searching and testing indicators to improve its accuracy. The strength or weakness of a stock relative to the overall market is an important indicator of market direction and momentum.
If the indices are moving lower or down, but the stock you are interested in trading is holding steady or moving up, ask yourself: Does this stock have strength? If indices are moving higher or up, but the stock you are interested in trading is holding steady or moving downward, ask yourself: Does this stock have weakness?
The movement of the indices up or down with your stock moving against that direction or in the opposite direction is valuable data to apply to your trading.
Relative strength compares one thing to something else. RS is dependent on something else for significance. It is a measurement of a price cycle that indicates how a stock is performing relative to other stocks in its industry. The calculation divides a stock’s price performance by the price performance of an appropriate index for the same time period. With the exception of RUT, the Russell 2000 Index, all indices mirror each other as they cycle up and down. Advanced charting RS uses one index as its comparison index, but the index may change according to market conditions.
Advanced Charting relative strength uses a new methodology of its application as opposed to that previously found in earlier versions of Advanced Charting in order to identifying strength and momentum. RS combined with the advanced charting indicators provides an extremely powerful method of seeing the strength or weakness of any stock.
The momentum phase is an extremely important phase in the life cycle of a stock. This phase is where most profit is realized with the highest returns possible. Let’s review momentum with relative strength.
What Is Momentum?
Relative Strength
■ Comparing the Relative Strengths
Here we look at the different relative strengths and compare each type.
Relative Strength: AAP—Upward-Cycling M1
See Figure 10.1.
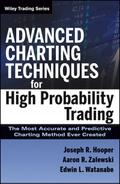
FIGURE 10.1 Chart 1 AAP—Upward-Cycling M1
The AAP chart example clearly shows relative strength as the RS red line drops lower and M1 and the price tic move higher. This indicates strength against a falling index.
If pre-market is a green or an up market day, the probabilities are very high that this stock will explode into momentum because of the relative strength it has held for weeks and months. It will respond like a loaded spring waiting to be released.
Relative Strength: SA—Horizontal-Moving M1
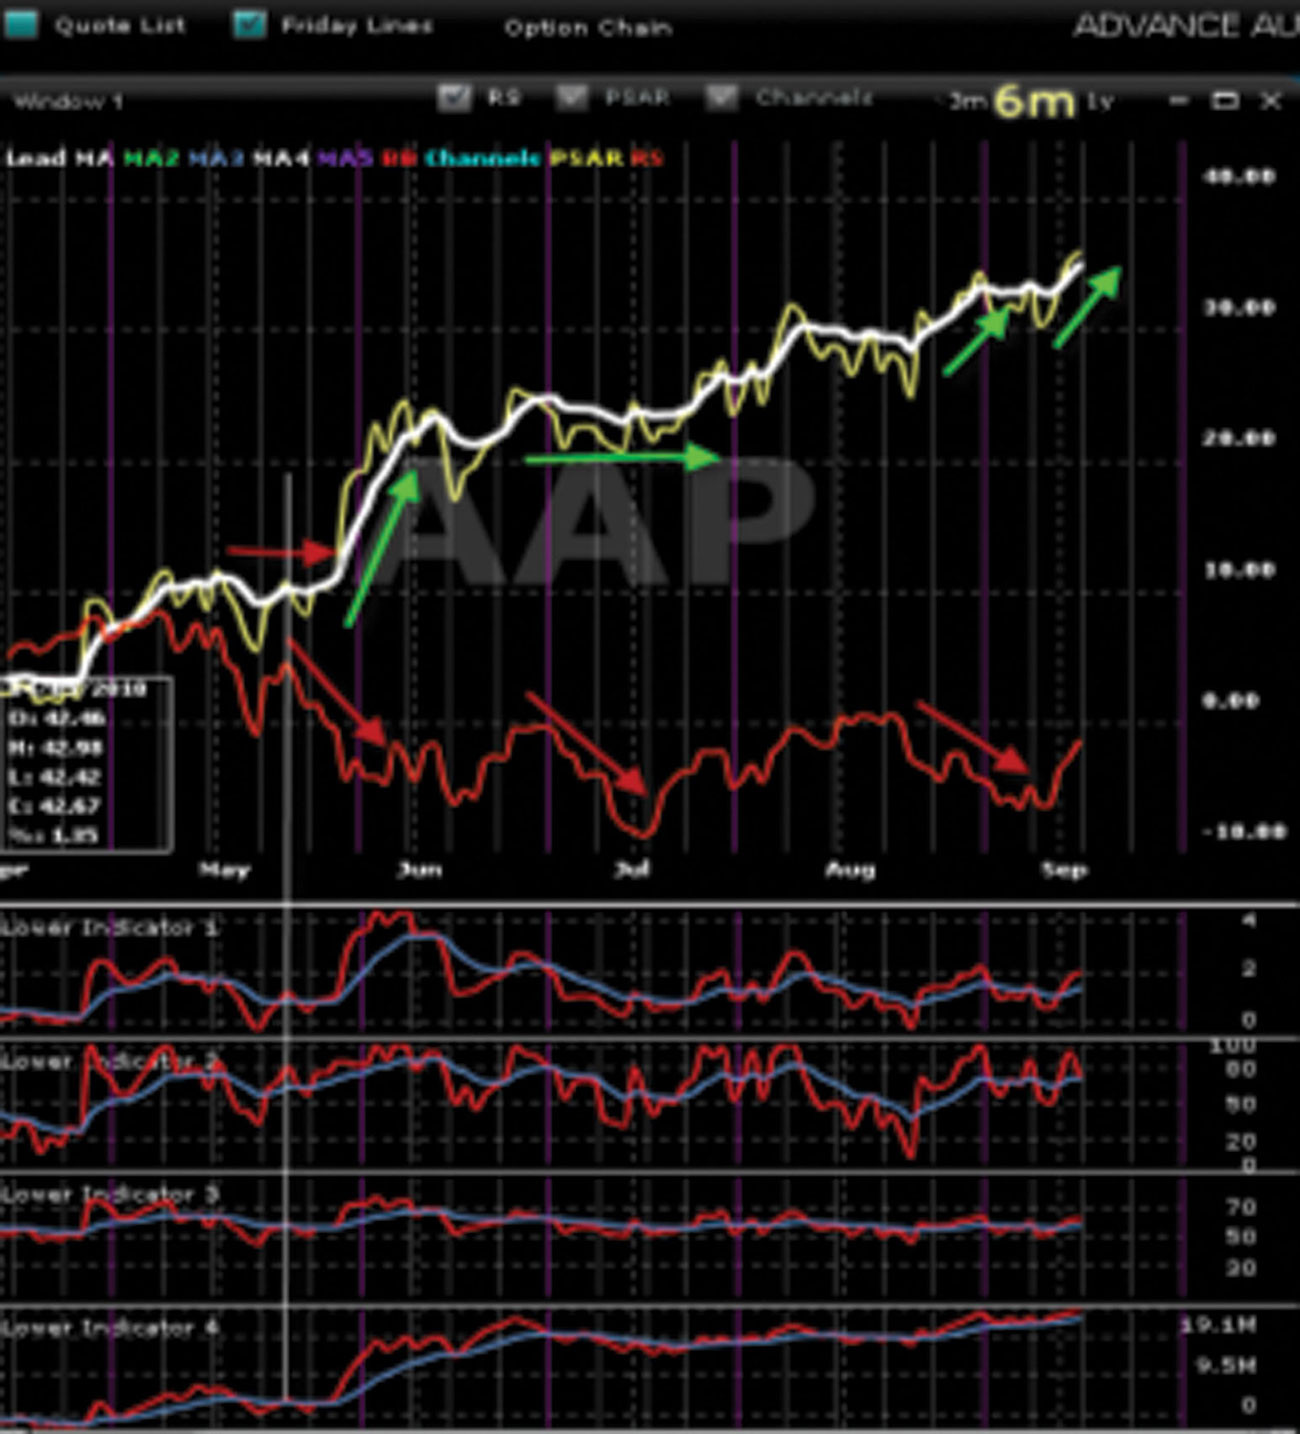
See Figure 10.2 Note that in July, the RS red line moves horizontally as M1 and the price tic move downward. This is relative weakness.
FIGURE 10.2 Chart 2 SA—Horizontal-Moving M1
Relative strength is very obvious on the chart of AAP. RS can also be used with stocks that have a flat or horizontal-moving M1.
You can see from the chart in Figure 10.2 how the red RS indicator moves horizontally and M1 and the price tic also move horizontally, mirroring the direction of the cycles. Even though there isn’t a lot of upward momentum present, small upward momentum cycles, as seen in mid-August and the end of October, still are obvious and can be traded by more aggressive and experienced traders.
Relative Strength: SA—Downward-Moving M1
See Figure 10.3.
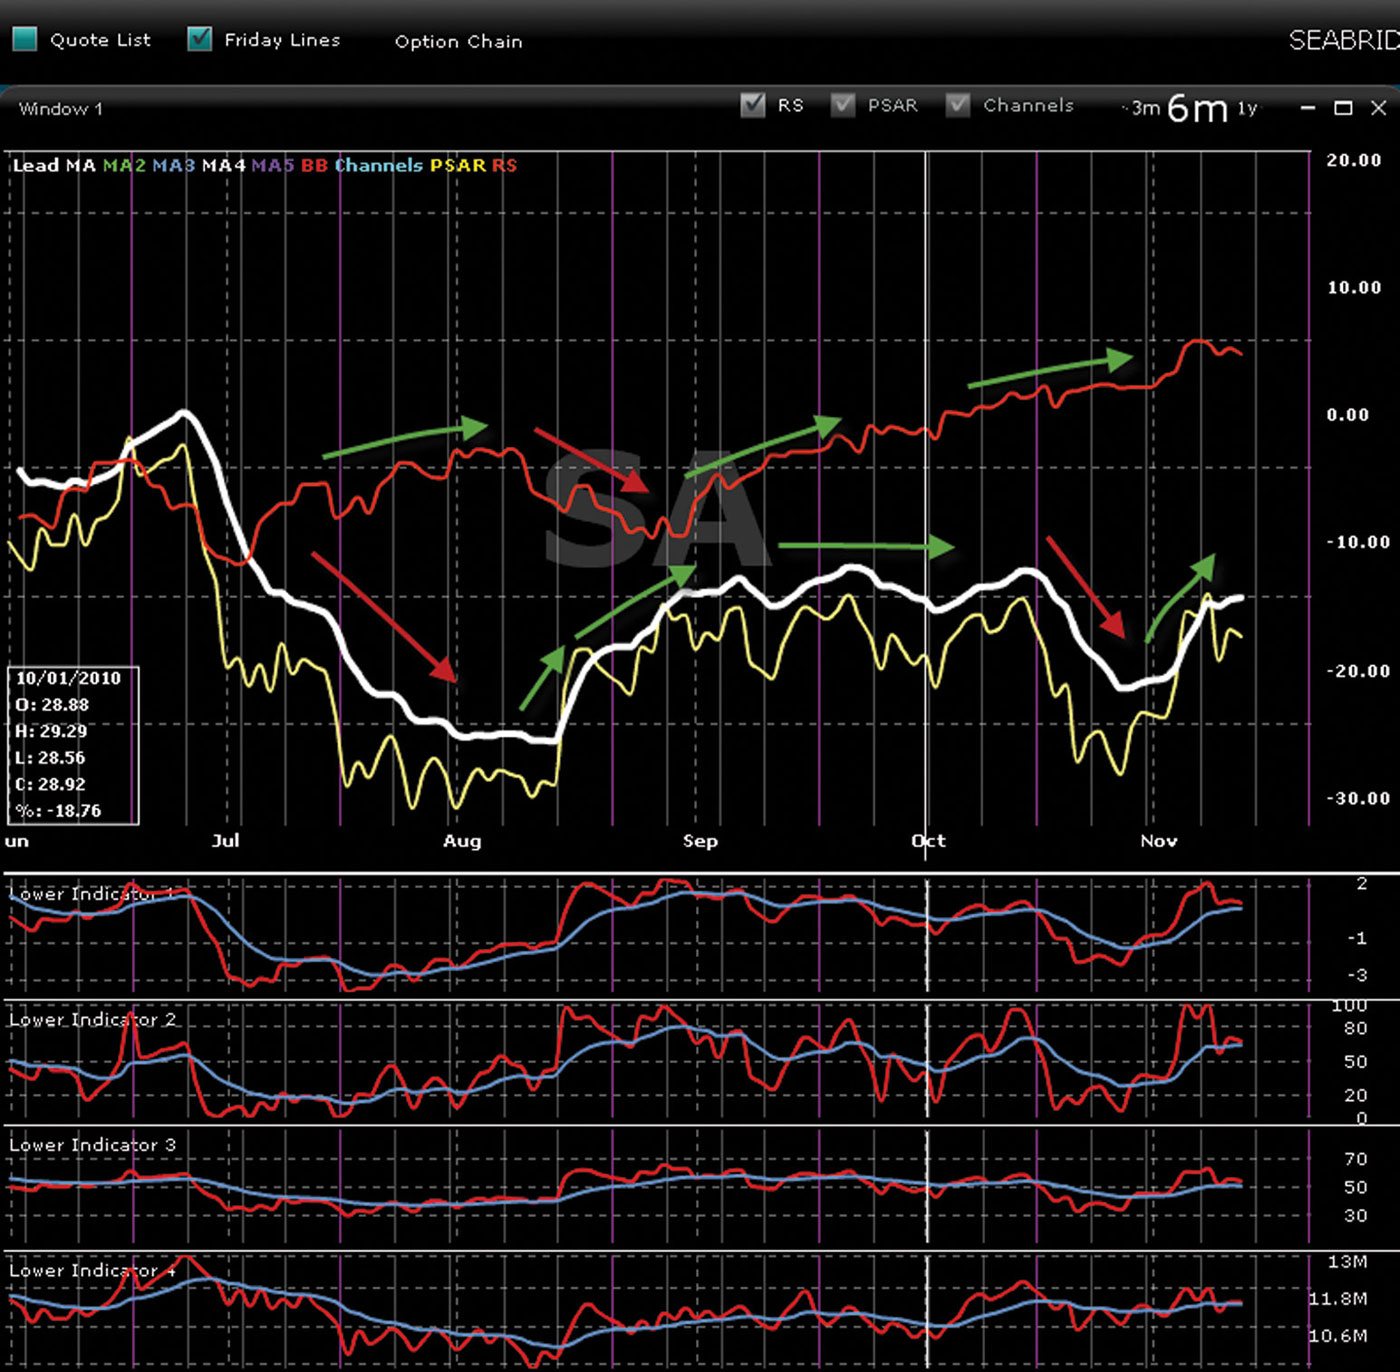
FIGURE 10.3 Relative Strength: SA—Downward-Moving M1
Relative weakness is very obvious on the chart of LHB. Note that M1 and the price tic are moving downward and spreading away from the red RS indicator. This is relative weakness. For covered calls, LEAPS or momentum trades, relative weakness stocks should be avoided because repeating downward cycles are evident and probably will continue.
■ Conclusion
Mastery of these advanced technical analysis tools, as with any new technique, may take several months of implementation during live trading.
Once you have gained confidence in these indicators, you will be able to trust what the charts are telling you and act accordingly. Once you gain trust in these indicators, you will stop second-guessing your trading decisions and will trade with confidence and greater precision.
In time, you will no longer look at these indicators separately but together, and they will immediately give you a very clear indication of probable future price direction.
Attend many seminars. Each time you do, you will be exposed to more charting subtleties, which will improve your mastery of advanced charting.
It’s all in the charts.