CHAPTER 1
Introduction to Advanced Charting
Advanced Charting techniques have historically not been a part of the Compound Stock Earnings (CSE) method. Rather, the focus of the CSE method has been to understand simple bias in stock price direction and to act accordingly. To understand bias, we assess the stock’s price cycle (the current movement of the stock price within a parallel range) and the position of the stock within that cycle.
When a stock is high in its current cycle, the bias is down. When a stock is low in the current cycle, the bias is up. To understand this bias, a simple straight-line, or open-high-low-close (OHLC) chart is used. This method of understanding simple bias has been applied, and proven successful, for years using the CSE covered call, LEAPS, and credit spread techniques.
The reason simple charting methods can be used successfully with the CSE covered calls, LEAPS, and credit spread techniques is that the techniques are based on probability. In a speculative stock or options trade, if the speculator picks the direction of the stock incorrectly, a loss on the position will be realized. In the CSE covered call methodology, if the assumed bias is incorrect, a loss is not generated. Rather, another management technique can be used to provide a solution. Therefore, when using the CSE covered call technique, an incorrect assumption of stock price direction does not result in the investor losing money; rather, it results in the investor needing to apply a management technique to rectify the situation. This is an important distinction between speculative trading and the CSE covered call/LEAPS techniques.
■ Why Use Charting?
Speculators have developed technical charting indicators due to the critical need to be correct in picking the direction of a stock—picking the stock price direction correctly is the only way speculators can profit from a trade. While that critical need is not present when using the CSE trading methods, increased accuracy in understanding bias leads to an increase in efficiency and returns when using the CSE techniques.
Technical chartists attempt to anticipate the direction of the next price tic and ultimately the direction of the cycle of the stock or index. Will the tic move up or down, and how long will it continue? Some call this speculation: attempting to judge the direction of the next move. Let there be no mistake. It is speculation, but it is based on probability. All trading is speculation because the movement of the price tic is an emotional event driven by fear and greed. It is impossible to know what global news event will happen to drive the markets up or down. But it is possible to know the probabilities of movement of the price tic by using Advanced Charting.
The reality is… all about probabilities. What are the probabilities that tomorrow the price tic will move in this direction? What are the probabilities that there is momentum in this cycle? What are the probabilities that this next cycle will be long, short, or flat?
Traders should be aware of these questions, even when trading conservatively following the CSE rules of traditional covered calls, LEAPS, or credit spreads. Charting might help traders to see into the future with a certain degree of accuracy to be proactive. Charting will improve traders’ timing to enter and exit positions. But charting will not make us more profitable unless we can master it and understand precisely what the indicators are forecasting for us.
Advanced Charting’s indicators have been modified, reformulated, and redefined with specific rules to follow as we analyze the 18 indicators as explained throughout this book. That is the difference between Advanced Charting and all other charting programs. Advanced Charting indicators are to be analyzed in a specific order of importance.
Advanced Charting is simplified from most charting techniques so the learning curve is rapid. Traders can master Advanced Charting quickly. This book will help you master charting with amazing results.
Advanced Charting Techniques for High Probability Returns will increase your understanding of cycle direction and bias, which will lead to:
Improving efficiency in these four areas by using Advanced Charting techniques, can show a conservative increase of returns by 1 to 2 percent per month for covered calls, dramatically more for LEAPS, and substantial and consistent returns with credit spreads. As such, Advanced Charting techniques are not indispensable to the CSE covered call/LEAPS/credit spread investor, yet they result in increasing efficiency and returns. For those experienced with our CSE techniques, this knowledge is significant, as marginal increases in monthly returns lead to a dramatically higher compounding of an account over the long term.
This book outlines Advanced Charting techniques that can be successfully applied to the various CSE techniques. The rules and management techniques of CSE remain the same. What changes is when to execute those rules and management techniques on a particular position based on these advanced charting techniques.
Any technical charting is useless if we cannot master it. We must master the ability to interpret what the indicators are forecasting for us. In this book, Advanced Charting indicators are reformulated with new definitions and a methodology of interpretation. These indicators are constantly being back-tested and tweaked to track the changes in cycles relative to market trends.
Attempting to apply default (standard) technical indicators and their definitions with Advanced Charting will complicate and hinder the ability to understand and use the method effectively.
Technical charting is a subjective and complicated field, but with Advanced Charting, we apply logic and practical common sense to the analytical process of understanding cycles and trends through chart pattern recognition. Once you have mastered Advanced Charting, you can trade anything with a higher degree of accuracy.
The momentum phase of the movement or cycle of a stock is the most profitable and important phase in the life cycle of a stock. Being able to identify this phase is not critical when trading covered calls, LEAPS, or credit spreads; however, being able to identify this phase will greatly improve profits.
Mastery of Advanced Charting eliminates position management of most trades once entered. This means that you have mastered the timing to enter, exit, and wait on the charts. You will be able to identify the four phases of a cycle: birth, momentum, exhaustion, and death.
■ Advanced Charting Techniques
Over 175 technical indicators have been created by traders, mathematicians, and chartists over the years. These technical indicators are never used alone but are applied in various combinations. The sole purpose of using technical indicators is to aid in determining the probabilities of the future direction of a given security.
If we tested and tried various combinations of technical indicators, we could create over 4 million various combinations. Trying to find the correct marriage between technical indicators, like trying to find the holy grail, has been an ongoing exercise of technical traders for years, and will continue for many decades to come. To arrive at the perfect technical indicator marriage, we must first define exactly what results we want to find with these indicators. The technical indicators presented in this book have been applied successfully to the CSE technique for years. Additionally, as with other CSE techniques, CSE will continue to test and back-test these indicators to fine-tune them to a perfect marriage over time.
Advanced Charting Features
Those familiar with the CSE Covered Call Toolbox know that it is constantly being improved with new features and new tools. And the Advanced Charting tool is itself an ongoing process of improvement and development.
It is important to note that the Advanced Charting system is designed to address one simple question: Is the V true or false? After reading this book, you will realize how simple this question is but how important it is to have an answer.
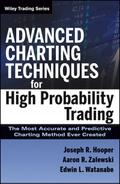
The chart of SDS in Figure 1.1 shows all the charting features turned on, including the trader’s portfolio. The pivot point indicator for the RIMM chart in Figure 1.2 is not shown but has an on/off feature for either standard or modified candles that we review later. We review the functionality of all of the toolbox features later in this book.
FIGURE 1.1 SDS Charting Features
■ Validating the V
Those familiar with the CSE techniques are aware that position entry and management techniques are executed based on the formation of a bias V on the line chart. When a stock is in the upper 25 percent of the price cycle and makes a regular V on the chart, bias is up. When a stock is in the lower 25 percent of the price cycle and makes an inverted V on the line chart, bias is down. However, on occasions, the bias V proves to be false, and the stock price moves in the opposite direction of the one that was assumed. The entire focus of this book is to validate the V. By validating the V, traders dramatically reduce the incidence of the assumed bias being incorrect.
The goal of this book is to teach a simple, easy-to-learn, but highly accurate method of determining the future direction, momentum, and duration of a given stock and applying CSE management rules using these technical indicators.
■ Advanced Charting Upper and Lower Indicators
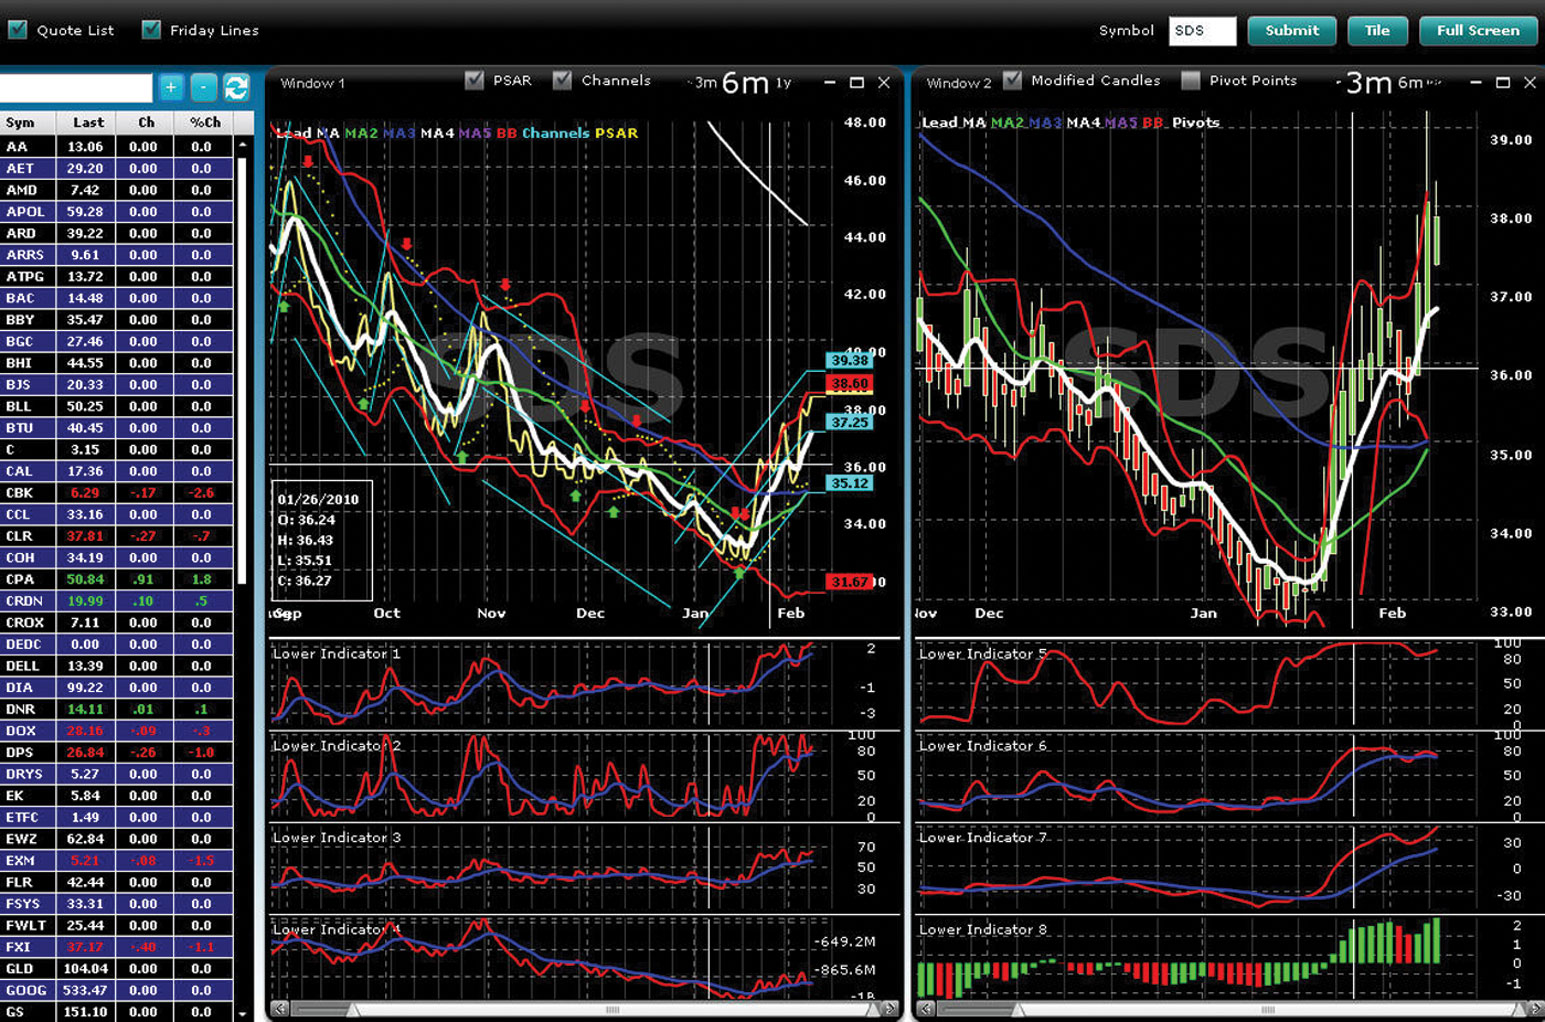
The RIMM chart in Figure 1.2 shows all Advanced Charting technical indicators. We will take this chart apart and explain throughout this book, step by step, what each indicator means and how each line works in relation to the other indicators. Chart reading is all about graphic similarities and pattern recognition.
FIGURE 1.2 RIMM Advanced Charting Tool Indicator
This book is easy to read and understand. Only a few complicated terms are used in explaining how these technical indicators work. It is not necessary to understand how these technical indicators are calculated or the formulas used to create them. It is important only to master how to interpret charting similarities of the indicators and learn to trust exactly what they are forecasting.