
Chapter 3
Streamlining Project Management
How should we monitor agile teams’ overall progress during an iteration?
What patterns should scrum masters be watching for in the project management tools Scrum provides?
How might we adapt agile for remote team members?
When an agile method unleashes a highly product development team, questions regarding project management will come immediately to mind. Fortunately, because the Scrum method utilized for agile data warehousing requires surprisingly few project management mechanisms, the work of keeping a team on track becomes streamlined greatly. This streamlined approach relies on a pair of simple tracking artifacts, a few best practices regarding sprint lengths and record keeping, and a few adaptations when teams become distributed geographically. The combination preserves Scrum’s many strengths, including velocity and responsiveness to the customer.
When agile teams begin delivering at pace, stakeholders will want frequent project status information. At the highest level, the user demo step that occurs at the end of every construction iteration provides a detailed snapshot of the project’s progress every few weeks. The cumulative project backlog—where all stories will be marked accepted, rejected, under development, or waiting—can quickly bring stakeholders up to date at the user story level. However, many stakeholders, including the team itself, will be reassured far more frequently that the iteration is on track. They will all want a daily status revealing whether the team will meet its current iteration goals by the end of the given time box.
Scrum provides daily status information using two key coordination tools: task board and burndown chart. These two artifacts will be readily intelligible to the reader, for they build upon notions introduced in the previous chapter, such as user stories, story points, and task cards. The task board allows everyone to see team progress at a task card level. The burndown chart allows a team to view its aggregate progress across all the stories on the iteration backlog. With these coordination tools displayed prominently in the team room, business and information technology (IT) stakeholders can discover for themselves what the team will deliver when the iteration concludes, and project managers can learn of sprint progress directly without burdening the team with status meetings. For development team members, the task board and burndown chart minimize the time and effort developers must spend on communicating outwardly. These tracking tools also allow them to assign and coordinate labor tasks among themselves without needing a project manager to control the work room.
Scrum’s coordination tools therefore streamline project management for all parties. They work well in their generic form for both dashboarding projects and data integration initiatives. Because they are fundamental to the success of self-organized teams, the reader will need to be familiar with them before we begin customizing other portions of Scrum to better support data integration projects. Presenting these tools also provides the opportunity to resolve three common challenges in managing agile teams with streamlined techniques: what to do when a team is running behind, deciding whether to track actual hours spent on tasks, and how to incorporate geographically remote teammates.
Highly transparent task boards
As detailed in the previous chapter, an agile iteration begins with a day of planning, involving both a story conference and a task planning session. The story conference identifies a few story cards that will serve as the iteration’s backlog of work to be done. The task cards are derived from the story cards and enumerate the individual steps developers need to complete in order to turn a given story into a small working piece of the overall application. During an iteration, these cards constitute a rich set of information that could be used to visualize and track team progress toward their goals of each sprint, if only they could be displayed conveniently. The task board answers exactly that need, arranging the cards in a matrix where developers and project stakeholders alike can instantly get an overall impression of progress and look easily into the detailed situation at hand.
The task board is simplistic in its format, but offers a high level of visibility of project progress to stakeholders within and outside the team, making it an essential to display in the project room. At its simplest, the task board is a large wall onto which index cards representing user stories and developer tasks can be pinned. By “large,” we mean perhaps an entire wall of a project room. Eight feet tall by 12 feet wide would not be too big, even for a team working with palm-sized index cards. The story and task cards placed on the task board are called “cards” because Scrum was first defined as a paper-based system using a cork board to track team activities. In practice, these cards will be sticky notes for teams tracking progress using whiteboards or some type of screen object for teams employing an agile coordination software package.
Figure 3.1 depicts a generic task board. The column names are appropriate for a team employing plain-vanilla Scrum, but are often adapted by project teams as they customize the method for their particular work styles. For each iteration, story cards are placed on the task board, using a column running down the left side. The story cards are placed on the board in priority order so that the most important work can always be found at the top of the board. To the right of this vertical line of story cards are several columns dedicated to identifying the status of the associated task cards as the team works upon them: Tasks Waiting, Tests Written, Under Development, Waiting Validation, and Ready to Demo. Many teams draw a horizontal swim lane across the task board for each story. The story cards will remain fixed to the left-most column as they simply define the swim lanes. As the work of the iteration is completed, the task cards will move steadily toward the right, hopefully all landing in the “Ready to Demo” column by the time the sprint’s demo day arrives.
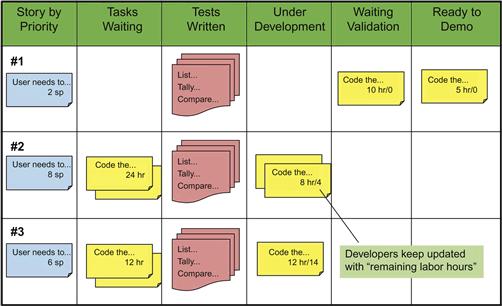
Figure 3.1 Simplified representation of a Scrum task board in midsprint.
The task board enables self-organized teams greatly. When one of the team’s software developers needs work to do, he finds it for himself directly from the task board. Because the story cards define the swim lanes in priority order, he need only identify the task card closest to the top of the Task Waiting column for which he has the skills to complete. By placing his initials on the card, he lets the entire team know who will be working on the task.
Following the principles of test-driven development, the developer then authors the validation scripts for the deliverables he is about to create. He pins that test package into the Tests Written column so that a peer can later find it and then moves the task card into Under Development. When the coding is complete, he can move the card to the Waiting Validation column, at which point a teammate can volunteer to perform with him the validation described in the test package deposited early in the Test Written column. When both the developer and the teammate are satisfied that the task passes validation criteria, the developer can advance the task card to the Ready to Demo column.
As product owner, the team’s business partner has been encouraged to watch the cards arriving in the Ready to Demo column. When all task cards for a given story have arrived in this final column, it signals that the team believes that the story card defining the swim lane has delivered and the new functionality should be present in the current build of the application. As practiced by many Scrum teams, the product owner can and should at this time ask for a demo of that story right away. Consistent with agile’s notion of fail fast and fix quickly, this pattern provides developers with as much time as possible to fix any defects that appear. This practice will work fine for dashboarding and reporting projects, as the application will be pulling from ready-to-consume information that exists in a warehouse or file system somewhere upstream.
Data integration projects often cannot manage miditeration demonstrations, however, so they must adapt this part of the Scrum cycle somewhat. Business partners can only evaluate extract, transform, and load (ETL) modules by reviewing data they place in database structures. Some business partners require full volume data in the target database tables before they will accept a story involving data transforms. If that information set is large, a full load may well take a day or more before it is complete and the team’s deliverables can be demonstrated. Teams working with large data sets rarely have the resources for each developer to load a separate target schema as he programs his module. These teams adopt instead a data load strategy that invests in a full volume target load only at the end of the iteration. Because they must share a single target schema for data that take days to load, the developers will have only enough time during each short iteration to perform a demo load once. They will have to work with a small sliver of data in their sandboxes while performing unit development. Integration testing will have to be executed against a subset of full-volume data that is small enough to allow this level of validation to finish overnight. A few days before the user demo, however, the developers will have to stop programming, assemble a final build, and invoke the ETL for a multiday run. If the developers get the timing right, this full-volume load will end just before the user demo takes place.
Because full-volume data sets are so difficult to work with, teams confronting large data volumes will be able to afford only a single end-of-iteration load. Consequently, they will only be able to provide a single end-of-iteration user demo. On the task board, task cards will accumulate in the last ready-to-demo column until they are all evaluated for acceptance by the product owner on the last day of iteration.
Task boards amplify project quality
As shown previously, quality assurance is built into the very structure of the task board. It demands that each module passes through three separate validation points for both functional and technical qualities: (1) the developer must write the tests before coding, (2) another team member must execute these tests for the units delivered, and (3) the product owner ensures each unit meets business needs as part of the user demo. By placing these validation activities on the task board, Scrum incorporates quality assurance into the process of development far more thoroughly than traditional methods.
Traditional IT professionals often paint agile projects as anarchic coding frenzies that pay too little attention to quality assurance. To the contrary, the task board’s structure ensures that testing occurs throughout the iteration and consequently throughout the entire project. Waterfall, however, clumps most of its testing toward the end of the construction phase, where it often gets squeezed down to only a few days if upstream phases run long. With this contrast, it is easy to see why agile projects in practice deliver far more trouble-free code than traditional efforts, despite the fact that they allow the developers to build applications much faster.
Task boards naturally integrate team efforts
Not surprisingly, the task board with its prominent place on the project room wall provides a natural focus for the team. In fact, the best place to convene the daily stand-up meetings is with developers gathered before the task board. If all the tasks cards are moving steadily across the board toward the Ready to Demo column, the product owner can simply say “Yay, team! You’re making progress.” Clumps of cards indicating slow spots will be easy to spot on the board, and in that case the product owner can easily point to the problem area and ask “Why doesn’t this story have more cards in Waiting Validation by now? Is there any confusion over requirement that’s slowing you down? Are you guys really going to get this feature finished by demo day?” The task board thereby helps keep the business partner engaged in the process and the developers motivated to deliver.
The task board also becomes the primary resource for managing dependencies. Traditional project managers often do not believe that self-organized teams can figure out all the predecessor and successor relationships between tasks for themselves. Typically, these doubts indicated that they are overlooking several factors. First, agile teams rarely start with a blank page, especially on data warehousing projects. The discovery and elaboration phase of most company’s release cycles provides a high-level architecture that the agile team can utilize to effectively identify and sequence the major modules it must build. Second, the agile iteration keeps the scope of work small—to the point where it is humanly possible for a team of 6 to 10 software professionals to understand the interconnections between the affected components without needing a project manager to assemble a detailed project plan. Third, the task board spreads all the task cards for an iteration upon a surface, enabling the developers who are wrestling with a complex dependency to point at the cards involved, place colored dots or pins upon them, and write notes on the back of each one. The task board empowers them to see the problem and collectively reason about its solution in real time.
The scrum master can use the task board to accelerate daily check-ins. Daily stand-up meetings often start to run too long when developers go into details about what they are doing and why they are having trouble instead of answering Scrum’s three simple questions. In this situation, the scrum master can convene the stand-up in front of the task board and ask each developer to speak only to the cards. “What I did yesterday” is answered by pointing to the one or two cards a developer moved the day before. “What I will do today” becomes simply the cards he will be advancing soon and to what columns. Details concerning the hold-ups can be reduced to “I’ve found a dependency between these two cards, and I need to meet with our systems analyst to clear it up.”
Product owners also benefit from the transparency that the task board brings to the formerly obscured coding portion of the software development process. If he pays some attention during the task planning session on the first day of the sprint, he will recognize many of the task cards that appear later on the task board. Once he learns to read the board, he will no longer need to wait for a project manager’s summary because he can always derive a notion of sprint progress directly from the task cards. He can compile his own status reports for the executive stakeholders, and at the next stand-up meeting he can ask questions about any pattern on the board that causes him concern. The task board makes the entire software development process transparent to the product owner, who appreciates the knowledge it provides because he must answer frequently to others for funds the project is consuming.
All told, agile’s simple task board gives developers the visibility and motivation they need to pull together all the complicated threads of a sprint into a complete delivery. By making slow spots and dependencies more visible, it brings complications that threaten the project to the surface promptly and gives everyone a forum to reason about their resolution before the challenge can affect the team’s delivery velocity.
Scrum masters must monitor the task board
Scrum masters must watch for a few developer behaviors that can needlessly impede the progress of task cards across the task board. Let us start with the practice where task boards accumulate dozens of task cards stuck in Under Development with only 1 or 2 hours left on them. Developers cannot bring themselves to close out the cards because they are not quite “done.” However, leaving these cards in suspended animation threatens the delivery of the entire sprint because there are other cards waiting for them to complete.
These stalled cards can indicate a few situations, all them needing to be resolved quickly. First, a given card could actually contain more than one task, and it is the last little task within it that is stalled. A common example would be “code the customer dimension ETL.” The engineer working on this card might have defined this work to require the module to be not just unit tested but fully integration tested before it can be called done. This card will then end up stuck in the Under Development column until somebody loads and runs a full integration suite, which may not occur until the last day or two of the sprint. To keep the cards moving, the scrum master needs to encourage the team to carefully define tasks to be as atomic as possible, without dependencies. In our example, a simple solution would be to split the task cards into two. The verb on the first would be “code,” and the verb on the second would be “integration test.”
Coders might also be leaving cards at 1 or 2 hours to go because a feature might still be needed. Agile projects work with much of the design kept in teammates’ minds, with details provided in real time to their colleagues as needed. In this context, designs are fluid and any developer can rightly believe another feature for his current module is probably coming. He may have even heard a conversation between the product owner and the data architect that makes him sure it will arrive very soon. Unfortunately, the sprint begins to stall while he waits for this requirement to appear. The scrum master should guide the coders to close off tasks once all “actionable feature requests” have been addressed. They can always create a new “add a further feature” task card if an additional requirement is defined later.
Beyond task cards stuck with an hour or two to go, the scrum master might also notice that tasks cards for high-priority stories never advance, whereas those tied to the least important stories of the sprint are making great headway. There are many possible explanations for this. The coders do not consider those tasks as truly necessary but are unwilling to say so or else those tasks represent chores and boring features so the developers are all leaving them to someone else to take on. Also likely is because no one really comprehended the design requirements for those cards during the task conference, they have all chosen to work instead on tasks they understand well.
In these situations, the scrum master truly earns his keep. He must actively inquire about why the cards are stalled, arrange an after-scrum meeting if needed, and facilitate the discussion until the root cause of the delay has been identified and someone has volunteered to resolve it.
Burndown charts reveal the team aggregate progress
The task board, with its swim lanes and its moving task cards, certainly makes it easy for any stakeholder to glean a task-by-task notion of the developers’ progress throughout the sprint. The details are all there; however, the big picture is not yet visible. The product owner, the developers, and all interested stakeholders still lack a means of understanding at a glance whether the work of the entire sprint is on track and whether a full iteration’s worth of work will be delivered by demo day.
To answer this need, agile provides the burndown chart. It displays a daily total of the remaining labor for all task cards on the task board. Because this number should be steadily trending toward zero, the burndown chart provides a single-glance notion of the status of the iteration. Moreover, any sudden change in the day-to-day trend provides the team with a far more sensitive detections of problems than the task board can offer.
Figure 3.2 depicts a typical burndown chart as it would appear at the end of an iteration. As each developer wraps up his work for the day, he needs to stop by the task board to update the task cards he is working on with a current estimate of “labor hours to go” before the task is complete. These numbers can be called the remaining labor estimates. Before the next day’s stand-up meeting, the scrum master can total up these remaining labor estimates to derive the team’s total current forecast of work still in the iteration backlog. This tally becomes the next “burndown bar” added to the chart, representing the team’s total labor hours to go before all the stories in the iteration are delivered as promised.
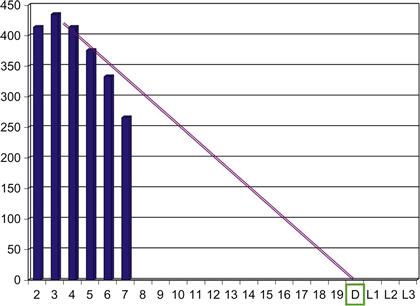
Figure 3.2 Typical agile burndown chart with a perfect line.
A closer inspection of Figure 3.2 reveals that the first “burndown bar” is drawn for Day 2 of the iteration. This makes sense, as Day 1 of each sprint is dedicated to iteration planning, not development work. One will also note that Figure 3.2 has room for bars up to Day 19 for the 4-week time box it represents and then a day labeled “D” for “demo.” If the burndown chart does hit zero on the day of the demo as planned, then all task cards will be in the Ready to Demo column and the user demo will present all stories as done. Some burndowns have a few slots listed after the demo day to represent situations where the team extends the iteration a bit. In Figure 3.2, these slots are labeled L1 through L3 to represent “late” days. There will be more to say about extending iterations a little later.
Scrum masters often fit their burndown charts with a “perfect line” to show where each day’s burndown bar should be if the team was to smoothly work off the task cards and hit zero by the end of the sprint. This line is drawn from the top of Day 2’s starting tally (the iteration’s beginning labor estimate) to zero on demo day. If daily tallies rise above the perfect line, then the team is falling behind. Below the perfect line means that the team is running ahead of schedule. Because the developers double-estimated the upcoming labor during sprint planning, the sprint should contain reasonable work, making the perfect line a reasonable day-to-day objective.
Detecting trouble with burndown charts
Burndown charts are very good at revealing problems, as shown in Figure 3.3, which has been taken from an actual project that the author led in the late 2000 s. In this snapshot, the scrum master has drawn a trend line that focuses on the 4 days just completed in the middle of the sprint. Drawing such a trend line is more of an art than a science. In this example, the scrum master based the line on the bars for Days 7 and 11 in order to highlight his suspicion that the team was losing traction during this portion of the sprint. With that line drawn, the developers could see easily that they would have no hope of delivering all the stories by demo day if the trend continued. Corrective action was clearly needed.
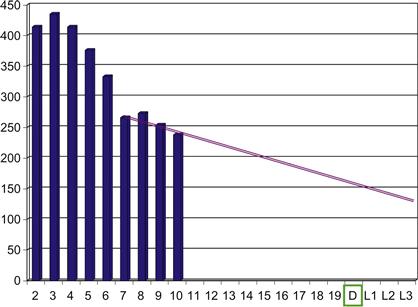
Figure 3.3 Midsprint burndown chart showing trouble.
In this case, the developers conferenced together after the morning stand-up meeting to discuss the forces driving the scrum master’s trend line awry. They discovered that one programmer was tackling a Type 2 slowly changing dimension with insufficient training on the ETL tool they were using. He was working without a good coding pattern in mind, and his remaining labor estimates were actually going up day after day as problems with his trial-and-error approach began compounding. With this situation now clearly brought to light, the team was able to reassign the work between them and pull the burndown chart’s remaining labor bars back toward the perfect line shown in Figure 3.4.
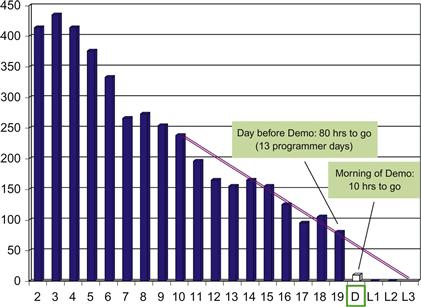
Figure 3.4 End-of-sprint burndown chart showing a delivery gap.
This particular case study eventually highlighted the burndown chart’s amazing ability to inspire developers to work to their highest potential. The day before the demo was a Friday, and on that morning the burndown chart showed that approximately 13 programmer days of work remained in the iteration—well beyond what the team of five developers could complete in the one remaining day. The scrum master’s trend line showed that the team was either going to have to leave some user stories undelivered or extend the sprint by 3 days, as suggested by Figure 3.4. However, when the team convened for the user demo on the following Monday, the scrum master’s tally of remaining labor on the task cards totaled only 10 hours, as depicted by the last burndown bar in Figure 3.4.
The product owner was able to test drive the new build and accept all the stories that morning, despite the fact that the team was so far from finished just the work day before. Clearly something extraordinary happened. The developers had taken a good look at the burndown chart on Friday and realized that the choice was between keeping the promises they had made to their business partners during sprint planning or looking like amateurs who cannot be counted on. They may well have also recognized that the product owner reports to sponsors after every iteration and that such reports can easily impact later funding decisions. Due to either of these motivations, the burndown chart had inspired them to put in some extra effort over the weekend and deliver all the promised user stories. No scrum master or project manager had to coax them to do so.
This dynamic is, in fact, a major reason why estimates by agile teams repeatedly prove to be far more accurate than those provided by waterfall teams. Guided by the trend lines drawn on the burndown charts, the developers make those estimates come true. Sometimes they must put in extra effort. Just as often, they swarm in the face of a delivery shortfall to figure out how to reduce the hours the remaining tasks will require.
Of course, project leadership must always consider whether a team in this situation has actually cut some important corners in order to meet the deadline. Such shortcuts can create hidden defects in the code or architecture that everyone will come to regret. This possibility underscores the need for teams to put in place strong quality assurance procedures, as discussed in the section on task boards earlier and as explored in detail in the second volume of this two-book set.
Developers are not the burndown chart’s victims
While the developers in this case history unfortunately lost their weekend, they are not without recourse to keep that situation from occurring again. The intent of agile methods is to not find ways to make developers work nights and weekends. In fact, one of the principles attached to the Agile Manifesto clearly states that the goal is to help teams find their “sustainable pace” of delivery. No one benefits if agile runs the team into the ground with overwork, leading the developers to seek employment elsewhere.
So if teammates end up working nights and weekends, what can they do to prevent that from happening again? Fundamentally, such an outcome is a function of poor estimating and/or insufficient work methods. The developers need to bring up these topics during the iteration retrospective and have a candid conversation about the forces that have led them to overcommit or underperform. There are at least a dozen aspects of the software development process where they could try correcting the problem with new techniques—from their story point references and programming patterns to their detailed design process and their definition of done. The sprint retrospective affords them the time needed to examine that complex process in detail and find where it needs to be modified.
If the overtime work arose simply from under estimating the difficulty of the work, then the developers should spend a moment during the sprint retrospective to identify a more realistic capacity number to employ during the next iteration planning sessions. As presented in the previous chapter, the team capacity states the amount of work that the developers plan to commit to in the coming iteration. It is tied most closely to the team’s velocity, which is the amount of work they managed to deliver during the previous iteration.
Teams that decide to lower their capacity number in the face of too much overtime will need to socialize this adjusted number with key stakeholders. In particular, the product owner and project architect need to understand the new value because it will impact the project’s forecasted duration and cost. The necessary revision to the project forecast may well require management to rebalance their expectations concerning the key project parameters of cost, delivery date, and scope. Such adjustments are never made cheerfully. However, if the developers fail to realistically set their capacity when the iterations prove to be too much work, they will have only themselves to blame if they must work long hours regularly. Luckily, as discussed next, the burndown chart offers the team an easily interpreted, graphical means of communicating what their velocity truly is, providing them with the compelling evidence they will need to justify their actions when adopting a new capacity.
Calculating velocity from burndown charts
As introduced in the previous chapter, much of agile project management revolves around the notion of team velocity, which can be measured in two ways: story points and task labor hours. Scrum masters derive a team’s story point velocity from a tally of user stories accepted and rejected during the user demo. As shown in a later chapter, teams can use their story point velocity to build a “current estimate” of how many more iterations a release or project will require. Labor-hour velocity has a more limited, but equally important, application. As detailed in this section, developers employ this velocity measure only to set the capacity number for the next sprint, which in turn helps determine which stories they will commit to for the next iteration.
A team’s current velocity is defined as the rate of delivery the developers achieved during the previous iteration. A team’s capacity, however, is a forward-looking notion of what the team believes it could deliver during the next sprint. Velocity is based on history. Capacity is an educated guess, typically made at the top of the Scrum cycle, and heavily influenced by the developers’ recent experiences on the project.
Capacity can be set in terms of story points, as heard when teammates share statements such as the following at a retrospective: “We tried to deliver 30 story points last iteration. We worked night and day and only delivered 25 story points at the user demo. That is still too many story points to commit to. We can’t keep working at this pace, so during the next story conference, we should only commit to 20 story points worth of stories.”
Capacity can also be set in terms of labor hours, as illustrated by the following statements from the same hypothetical sprint retrospective: “Those stories that we said totaled 30 story points had tasks that added up to 600 labor hours. We completed tasks totaling 500 hours, and again, that was too much work. So, during the next task planning session, we should only commit to 450 hours worth of task cards.”
Teams want to have these two separately derived notions of their capacity so that they can check their commitments based on story points against those made based on labor hours. If they do not agree, the developers’ two estimates are inconsistent, indicating that at least one of them needs to be reformulated.
With the developers’ labor-hour velocity so central to their task planning for every iteration, they will need to show clearly how they derived that measure. Figure 3.5 shows a simple graphical means of identifying the team’s delivery velocity in labor hours using the final burndown chart from iteration. In this example, the project is using 3-week iterations. The team committed to 414 hours of work during the iteration planning session, as indicated by the chart’s first burndown bar, but finished the sprint with 80 hours of work still undelivered. The team velocity, then, is simply the 414 hours of originally estimated work less the 80 hours of tasks left undone. The resulting figure of 334 hours is the team’s velocity for that sprint.
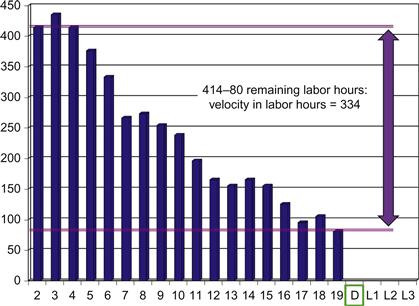
Figure 3.5 Calculating labor-hour velocity using a burndown chart.
In deciding what amount of labor this team should commit to for the next iteration, agile practitioners would encourage them to first try the notion of “yesterday’s weather.” People always want to know what today’s weather will be, but if there’s no meteorological information available, the best prediction they can possibly make is that today’s weather will be about like yesterday’s. Agile teams are in the same situation with forecasting how much they will be able to deliver during its next sprint—absent any other information, they should assume they will deliver about what they did during the last iteration, both in story points and in labor hours for tasks.
However, at the top of any sprint, a team may vary its chosen capacity from its historical velocity for many reasons. Most commonly, upcoming vacations or training sessions for some of the team members will cause the developers to lower their target capacity to account for the amount of resource hours they are going to lose during the next sprint. Similarly, it is sometimes clear that the next iteration will be subject to greater distractions from other projects the developers are participating in or, due to a fresh crisis in operations, will sap their time for “production support.” Finally, as the aforementioned discussion suggested, a team should adjust its capacity below its velocity if they have been working overtime. In that case, the developers need to set their capacity to reflect what they sense is their sustainable pace.
Common variations on burndown charts
Over the long run, the burndown chart is key to fostering a high-performance team of agile developers. Its presence at the daily stand-up meeting places a healthy amount of pressure on them to keep deliveries very close to the expectations depicted by the perfect line. By creating this direct connection between the developers’ labor estimates and the amount of stress they experience during the iteration, the burndown chart provides a daily motivation for teammates to become better forecasters, work effectively together, and keep their promises to the product owner firmly in mind. There are a few situations in which these objectives become challenged and require some variation in the way the burndown chart is employed—situations involving early deliveries, leftover work, and miditeration scope creep from the product owner. This section considers how to adapt one’s use of the burndown chart for each one of these challenges in turn.
Setting capacity when the team delivers early
Sometimes teams exceed their own expectations and deliver far more quickly than planned. Although this surprise is a good problem to have, it muddies the notion of velocity, thereby complicating selecting a capacity number to use during the next sprint planning.
It should be stated at the outset that this situation is better avoided if at all possible. Many Scrum projects can maintain an inventory of user stories on the release backlog that are ready to develop. When a team with such a backlog starts to run ahead of schedule, it can simply pull a few more stories into the ongoing sprint and keep working until the conclusion of the current time box. This option is the best choice because it leaves the developers a full iteration’s work to base their velocity and next capacity upon. The developers then calculate their velocity as they always do: total story points for stories accepted and total labor hours belonging to tasks that were completed.
In those situations where stories waiting on the backlog are not ready to move into development, the team will be forced to end the iteration early. This can happen on data integration projects because the data architect and systems analyst often work one iteration ahead of their teams (this is the practice of “pipelining,” discussed in a later chapter). These teammates may not be finished with the data models and transform rules needed by the next set of stories when their programmers finish the current iteration ahead of schedule, so the developers will have no choice but to end the iteration early. In this situation, the team will have an observed velocity based on a shortened time box. Unfortunately, the team will need a capacity number based on a full-length iteration for the coming sprint planning sessions.
One solution is to simple inflate the velocity numbers measured during that sprint for the number of days that were trimmed from the last iteration. Say a team committed to 24 story points and 240 labor hours for a 15-day sprint that they completed in 12 days. These developers could decide that since 15 is 25% greater than 12, they should aim for 30 story points and 300 labor hours in the next iteration.
This simplistic approach can lead them into trouble, however. Above all, they would be committing to an amount of work based on a calculation, not an observation. They would have to look hard at the root cause behind the past iteration’s early delivery. Perhaps the product owner dropped many requirements for a particular user story or perhaps a developer found a reusable module in another data mart that eliminated some of the planned coding on one of his major tasks. Before committing to an inflated capacity, the team needs to be sure that factors leading to a faster delivery during the last sprint will continue to exist.
The safer approach would be to commit again to the same capacity as the previous iteration, but ensure that some extra stories are ready to work on this time. This choice will allow the developers to pull additional stories into the sprint if need be, thereby working a full time box. They can safely adjust their capacity number upward because it is based on a measured velocity of a full iteration.
Managing tech debt
As described in the previous chapter, technical debt comprises the many little aspects of deliverables from previous iterations that were not exactly right or did not quite get “done” by the developers. The product owner accepted the user story despite the unfinished work, but only because the developers promised to attend to those open details immediately at the beginning of the next sprint. Thus it is called “debt” because the developers “owe” that cleanup work to their business partner.
Typically, tech debt is treated like just another set of tasks during the planning of the next iteration. The developers will create task cards for them and estimate the labor hours they will require to resolve. The time to work these tasks will be taken from the team’s architectural reserve, as described in the previous chapter. Being the keeper of the work process, the scrum master is responsible for ensuring that her teammates pay off their tech debt right away during the next iteration. This objective may prove tricky to achieve, however, because the next iteration frequently revolves around new, exciting features the business strongly desires, so developers sometime conveniently forget about the lingering tech debt. After all, it usually represents something akin to unpleasant chores for them. Unfortunately, the tech debt can cause serious complications later in the iteration or project if left unaddressed, especially if it involves quality defects, because other developers’ modules might start to fail due to this unfinished work.
The burndown chart can be adapted to provide a strong incentive to get the tech debt paid off quickly. As illustrated by Figure 3.6, the scrum master can draw each day’s remaining labor hour with the tech debt portrayed on the top of the standard burndown bar in a distinctly different color. With this small change, the burndown chart clearly reveals whether the team is doing its chores before starting in on the fun stuff. If the burndown chart shows tech debt lingering much past the first third of the sprint, the scrum master would be wise to call for a special team meeting after the next stand-up to discuss the problem in detail.
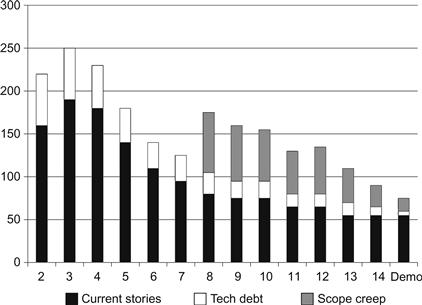
Figure 3.6 Burndown chart showing tech debt and scope creep.
Managing miditeration scope creep
Although the iterative nature of agile keeps the team responsive to changing requirements, the five-step structure to each sprint actually puts some limits on this flexibility. In theory, developers welcome changing requirements as long as the product owner introduces them during the top of cycle, when they can be managed using the standard process, beginning with the story conferences. Should the product owner start pushing new requirements on the developers during miditeration, it would undermine the plan they had drawn up for the sprint, which they are following so diligently, as reflected on their task board. Unfortunately, sometimes the product owner will not be able to wait for the next top of cycle to drop a big new requirement on his team. Typically, this situation happens when an executive suddenly thinks of an essential service the company must get from its business intelligence (BI) system. The executive-level request makes the story more important than any other item on the iteration backlog. If the project is in its final sprint before a release, the new story will have to be addressed during the current sprint so that the executive will see his request fulfilled in production right away. The new story becomes scope creep for the current iteration.
If the developers have one or more stories in their iteration backlog that they have not yet started, and the story points on these items approximately match the estimated points for the scope creep, then the easiest solution will be to have the product owner swap out those stories to make room for the scope creep. Unfortunately, because data integration projects tend to have only a few stories on the backlog for each sprint, often there are too few unstarted stories to swap with. In this situation, the team needs a way to take on the scope creep but avoid looking bad when they cannot deliver all of the other stories they had committed to.
Luckily, agile burndown charts have an answer to this tricky situation. The new demand should be converted into a story, like all other product owner requests. Task cards should be defined and, together with the new story card, should be added at the top of the task board, assuming that this emergency request is considered “priority number one.” The developers should then proceed to work the task board as normal, pursuing the highest priority task cards first. To prevent anyone from overlooking the serious impact that the urgent midsprint scope creep will have on the iteration, the burndown chart should be adapted as shown in Figure 3.6. Here, in addition to the tech debt, the scope creep is depicted on top of the remaining labor bars using a third color.
As shown in Figure 3.6, the scope creep appears midsprint and was dutifully burned down along with the tech debt during the remaining workdays. However, progress clearly stalled on the regularly scheduled work that is drawn as the base of each burndown bar. Come demo day, this adapted burndown chart will reveal to everyone that the team worked its highest priorities as expected and that the new requirement pushed on them in midcycle was the reason some of the other stories were not completed. This adapted burndown chart enables the team to be superresponsive to its business stakeholders and still well defended with evidence should its business partners forget why the regularly scheduled stories were not delivered.
In many organizations, urgent events disrupting an agile team’s sprints are not so much scope creep but outages in the online applications that demand the developers divert their energies to production support. This same technique can be leveraged to make clear the impact of production support on a team’s performance just as well as it can show the affect of midcycle scope creep.
This approach to depicting scope creep or production support work does make it a bit more difficult to determine the team’s labor-hour velocity from the burndown chart. To calculate velocity at the end of the iteration graphically, the scrum master must place the segment of scope creep first appearing on the burndown chart on top of the first burndown bar, as shown in Figure 3.7, so that the starting point of the calculation incorporates the labor estimates for all the original stories and tech debt, as well as the additional hours injected onto the backlog during midsprint.
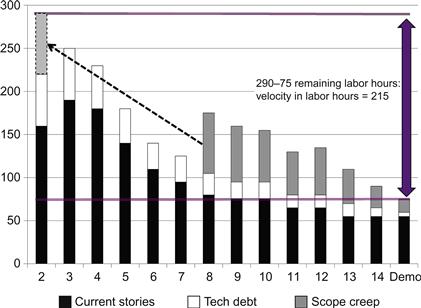
Figure 3.7 Calculating labor-hour velocity for sprints with scope creep.
Diagnosing problems with burndown chart patterns
Although Scrum is in structure a simple process, it can be a difficult process for many teams to master. With developers working at their highest sustainable pace, the team’s effectiveness is highly vulnerable to misconceptions and counterproductive attitudes among any of its members. Luckily, such issues affect the burndown chart in such a way that a savvy scrum master who is watching for such patterns can detect quickly. Early detection of such troubles is important because it enables the team to take effective corrective action. This section introduces some patterns to look for, both good and bad: early hills, shallow glides, and persistent inflation.
An early hill to climb
In many of the sample burndown charts referenced previously, one should note that the bar for the first day or two went up, not down as the team would have wanted. This is the “early hill to climb” pattern. It is very common; although it should catch the attention of all teammates, it is not a cause for panic. An early hill typically occurs when the team discovers some additional tasks that they did not anticipate during the task planning session on the first day of the sprint. When additional tasks are discovered during an iteration, the developers should create task cards for them, estimate the hours they will require, and add these cards to the task board. If these are sizable tasks, additional hours on the new task cards will make the next day’s burndown bar move up.
When an early hill does appear, the scrum master should allow it to worry his teammates. If uncorrected, the growing total for the iteration’s remaining work would definitely become a problem. When an iteration’s first couple of burndown bars immediately begin to hover above the perfect line, the team should become concerned enough to get their work for the iteration fully defined and under control so that they can reverse this trend. Not surprisingly, early hills are much more prominent during the first few sprints on a new project, when unknowns concerning function and design are the most numerous. As the project progresses, the team’s vision and their application designs should get steadily sharper, leading these early hills to become progressively shorter, if not disappearing altogether.
Shallow glide paths
The “shallow glide” pattern describes burndown charts in which the remaining labor estimates remain steadily above the perfect line, as shown in Figure 3.8. Here the team is steadily burning off the committed work of the sprint, but not at the rate needed to finish all the tasks by demo day. This is not a particularly pernicious pattern if it happens in isolation. For a new team, it usually reflects that the developers have not realized how hard delivering applications using an iterative and incremental delivery can be. They have overestimated their ability to deliver truly shippable modules.
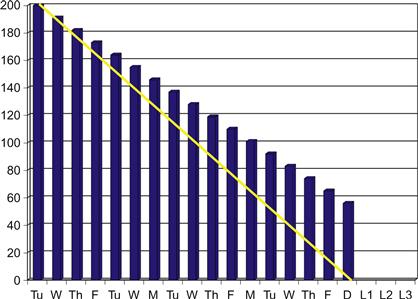
Figure 3.8 Common burndown patterns: The shallow glide.
In one sense, the team need not address this situation because it will rectify itself. When the scrum master employs his regular end-of-sprint calculation of velocity, he will provide the team with the hours for the tasks completed. If the team uses this velocity as the basis for their capacity during the next sprint planning session, they will naturally adjust their commitments lower until they start delivering as planned. From another perspective, however, when a team frequently overestimates how much work it can deliver per sprint, the developers need to revisit their estimating. Something may have changed that could cause estimates to be off not consistently, but only when this hidden event occurs. If the team seriously overestimates more than a couple of iterations, they should perform a root cause to identify the culprit and then sharpen their estimating tools accordingly. They can recalibrate their story points for a particular type of backlog items if this set has turned out to be categorically more work than anticipated. They can update the steps listed on their basis of estimate cards for common module types if large work items have been omitted. They can also revise the hours on the BOE cards so that they remember to estimate certain types of tasks as taking longer than before.
When this pattern appears suddenly in midproject with established teams, it can signal more than just poor estimating. It can reflect that the developers may have advanced their definition of “done” significantly, adding, for example, a difficult step, such as reconciliation results back to source documents. The tougher definition of done will affect many stories, and if the new work step has not yet been incorporated into the team’s estimation for those story types, all of them will be set upon a shallow glide path that will show up in the burndown chart.
Alternatively, the work might now involve an additional tool that the developers are not as proficient in, such as a data quality utility. Another possibility is that they have worked through many easy stories and are now taking on a harder class of modules. Data integration projects that pull data from well-designed sources sometimes find the modules for staging data much easier to build than those that integrate the information later. Consequently, these teams can experience shallow glides on their burndown charts when they begin struggling with the integration layer of their application. Another common cause of this underdelivery pattern to suddenly appear is “organizational friction,” where the team members encounter push-back from some of the other IT teams with whom they must coordinate, such as database administrators or quality assurance. The root cause could also be a change in team bandwidth, most commonly due to resource contention. For example, one or more of the team members may have been pulled aside to perform maintenance programming on another system, unbeknownst to their teammates. All these possibilities will suddenly slow the delivery rate of the team. When the burndown bars stop tracking the perfect line closely, the scrum master should explore, with the developers, possible explanations such as the ones just listed.
Persistent inflation
When burndown charts display “persistent inflation,” its remaining labor bars drift steadily higher above the perfect line, as shown in Figure 3.9. Here bars keep rising well beyond the point where they should have turned downward if the iteration was experiencing only an early hill to climb. Persistent inflation signals that instead of reducing their remaining labor estimates on the task cards as they work them, the developers are finding steadily more work to do with each hour of work they put in.
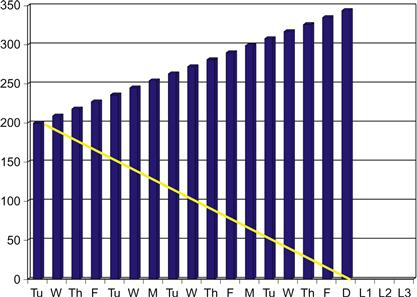
Figure 3.9 Worrisome burndown chart pattern: Persistent inflation.
For new teams, this pattern is usually an indication that the work is not arriving to the developers with enough definition. True, agile is based on defining user stories and the implicit technical tasks as needed during each iteration planning day, but one can go too far with this “just-in-time” notion. Most agile teams ask their product owners and scrum masters to groom the project backlog a few days before the start of each sprint. Grooming entails wording the who, what, and why of each user story accurately so that there are no contradictions or confusing overlaps with other story cards. Poorly thought-out stories lead to inaccurate requirements that later change during development. Such requirements can force the remaining labor estimates upward to reflect all the rework it causes. On data warehousing projects, persistent inflation can also indicate that the detailed guidance roles upstream from the developer are not being completed sufficiently. The systems analyst and data architect may be cutting corners on their source-to-target mappings or the attribute definitions of the target schema. The developers find the programming very slow in the face of these insufficient artifacts, and their estimates for finishing the module begin to rise.
Solving this problem may require the scrum master to cancel the current iteration when it is clear that the work has spun completely out of control. The team may well need an extra long sprint retrospective to clearly iron out the roles and responsibilities for the teammates producing the inputs the developers rely upon. Many teams wrestling with this situation decide to draft a definition of done for each of the artifacts from the upstream roles similar to the definitions the programmers employ to ensure that their own work is complete.
Should you extend a sprint if running late?
While introducing the burndown chart earlier in this chapter, we demonstrated how a trend line can reveal to developers whether they are on pace to deliver all of the stories on the iteration backlog by the time demo day arrives. Teams running on schedule would see this trend line intersect the X axis at demo day. Teams running behind would see it intersect to the right of demo day. Many of the sample burndown charts given earlier, in fact, have 3 days on that axis occurring after demo day—“Late 1” through “Late 3”—which naturally begs an important question. If a team is running a few days behind, should a scrum master extend the sprint so they can finish delivering all of the iteration backlog? If so, what limit should we draw on the number of days for such an extension?
Extending iterations is generally a bad idea
In general, extending an iteration to finish up the promised work is a bad idea, tempting though it is. A scrum master would serve his developers far better by guiding them to accept that they failed the current iteration to a small degree. They should simply finish off the sprint and demonstrate to the product owner whatever components they were able to complete. There are two compelling reasons to keeping sprints durations constant: it supports better estimating and avoids undermining team velocity.
Considering estimating first, if the scrum master extends the sprint by, say, 3 days, what would he measure as the team’s velocity? The team needs this figure in order to properly set their capacity for planning the next sprint. One idea would be to take the delivered story points and labor hour comprising the stories accepted during the iteration and adjusting them linearly by the number of extra days added. It is not clear how accurate that adjustment would be. During the early days of a sprint, the team struggles with the greatest uncertainty, and their coding rate is the lowest. At the end of a sprint, the developers are coding intensively, given that most of the crucial questions have been answered. With this a natural acceleration in actual coding speed, 3 days at the end of an iteration may be the time band in which over half the demonstrable results of an iteration emerge. In truth, there is no way to accurately “back out” the contribution of the coding accomplished during the few days a scrum master tacks on when extending a sprint. The team’s true velocity will remain hidden, and their ability to estimate accurately what they should commit to during the next sprint will be seriously compromised. Without accurate estimating, the team cannot keep from committing to too much work again, requiring another extension. When extensions become the rule, the team has essentially adopted a longer time box. They would be better off just planning on one sprint length and figuring out how much to promise to deliver within that constraint.
Considering team velocity second, if the scrum master frequently changes the length of the team’s sprints as needed, she will undermine the team’s velocity. Keep in mind that Scrum, as taught in the classroom, is not a method but instead a collaboration framework. The true method that every agile team ends up using develops incrementally from the conversations its developers have during the sprint retrospectives. Although it requires a few iterations to get right, the members of a new team eventually negotiate with each other a complex series of deadlines and handoffs that allow the work to get done completely by the end of the given time box. The complex work pattern they arrive at will be memorized through practice by the developers rather than written down, and it will be based on the precise size of the team’s time box. When the scrum master changes the length of the sprint, many of the sequences and timings the developers have internalized will no longer be accurate. They will adapt their cadences to the longer time box only to find themselves out of sync on the next iteration when the time box shrinks back to normal. The resulting confusion and mistakes will consume developer time to resolve, forcing the team’s velocity down. Moreover, changing velocities causes uncertainty in the estimation process, which sets off all the disadvantages just mentioned.
In summary, if the scrum master is constantly changing the size of the iteration’s time box, developers will never truly know what they can accomplish in a fixed number of days and will not be able to optimize their team work patterns. They will never achieve the long-term advantages of the agile approach, which include product owner trust, stable funding, and minimal interference from program managers. For these reasons, scrum masters need to be implacable and keep the iteration lengths uniform, even when a few days might make the team look good in the short term.
Two instances where a changing time box might help
At least, such consistency is generally preferable. There are two exceptions that may well cause a good scrum master to adjust the time box a little: release boundaries and looming holidays. The former situation occurs when the team is working within the last iteration before the product will be pushed into the release-to-production process. Extending the sprint by a few days in order to get a couple of key features into the next version may well be worth risking all the confusion a changing time box can cause.
In a similar light, the current iteration might be scheduled to conclude only a few days before a major holiday. The scrum master may well realize that starting up a new iteration and working only a couple of days before the team disbands for an extended period will only serve to waste the time spent on sprint planning. In this case, extending the iteration a few days may allow the team to get a little more accomplished before the break. They can make a solid start on the next iteration when everyone returns from holiday instead of trying to remember how to resume a partially completed sprint.
This latter situation is nowhere as demanding as the production release case just considered. If the right open items exist for the project, it might actually be a far better idea to let the iteration run its normal length and use the last few days before the break as a spike dedicated to knocking off some unfinished documentation or clearing out the tech debt list.
In any case, scrum masters will have to choose carefully whenever tempted to extend a sprint; all told, changing the team’s time box should be an exceedingly rare event.
Should teams track actual hours during a sprint?
Some scrum masters, especially those with traditional project management training, are strongly attracted to the idea of tracking actual hours spent on tasks. They claim this information will allow the team to estimate labor hours more accurately during task planning sessions. They also desire to compare actual hours against estimates so that they can assist their developers in becoming better at forecasting the labor required for an entire project. Unfortunately, tracking actual hours spent on the individual tasks is ineffective, aims at the wrong objectives, and drowns the developers in detail while undermining agile’s pillar of self-organization that is so crucial to a team’s velocity. Tracking actuals should be strongly discouraged.
Several considerations undermine the notion that teams will be able to provide better estimates if they had a collections of actual labor hours for past tasks to reflect upon. Scrum masters who begin to fall prey to this hope should be gently reminded of the findings concerning time overruns documented by the Standish Group’s Chaos Reports, where 84% of the development projects that were either challenged or canceled had an average time overrun of 222%. [Standish Group 1995] If documenting actual labor invested could lead to accurate estimating, the waterfall projects included in the Chaos Reports would have demonstrated a far better track record.
Collecting actual labor spent on tasks appears nowhere within the definition of Scrum, and the method performs well for hundreds of teams that do not sink time into this practice. Moreover, statistical inference requires many dozens of data points before one reaches a dependable predictive power. [Cohen 1988] Projects, such as data integration efforts, that deliver only a handful of stories every iteration will not provide enough data points to derive statistically significant averages for task durations, especially when the modest number of collected numbers is divided across dozens of task types.
More importantly, estimating statistics cannot be used without destroying their accuracy. The parameters generated by averaging past events cannot be followed blindly because context is always changing. A developer will have to judge whether a given parameter can be applied to the new task he is estimating, and his mind will be working at the fuzzy aggregate level that we human are inherently limited to. When we mix an incredibly precise number with a rough guess, the result is only another rough guess. All the data gathering and calculation that went into generating that precise estimating parameter are wasted, so we should be very judicious about how much effort we invest in deriving that precise number to begin with.
Beyond the fact that finding a silver bullet for estimating parameters is improbable, we must understand that estimating labor hours with extreme accuracy is the wrong objective. Labor-hour estimates only address estimating tasks. We only define tasks for the iteration immediately ahead of us. We limit our task-level thinking to this near-planning horizon because it is very demanding. On average, software developers only have the mental energy to carefully perform task-level decomposition for a single iteration’s worth of work. Beyond that they unconsciously resort back to wild guesses about the actions that will be needed and the time labor will require. This dynamic is exactly why the agile community invented story point estimating—a forecasting technique that operates at a high enough level that our developers can persist with it long enough to forecast effort for an entire release or project. If we were to somehow derive a set of absolutely perfect, labor-hour estimating parameters for tasks, developers would still be able to apply them to only to a handful of stories—a few weeks of work at best. It would hardly be worth the effort required to derive those numbers in the first place.
If the impossibility of deriving and utilizing precise estimating parameters for development tasks were not enough to dissuade us from tracking actuals, we should also consider the destructive impact it will have on the motivations and culture within our agile teams. Agile’s entire focus is to deliver production-quality software that provides business benefits within a time frame project sponsors can value. Directing our developers to gather actual hours spent on tasks will swamp them with endless bookkeeping activity. It will divert their efforts away from what truly matters, building working code with such high quality that it can be demonstrated in a few short weeks and then put it into production.
Moreover, as most seasoned scrum masters will attest to, just getting developers to update their remaining labor hours each day on the one or two task cards they have been working is hard enough. Gathering actual hours spent on tasks would require another order of magnitude of cajoling and admonishment to achieve. A more successful approach is to let the developers decide for themselves how long and how carefully they wish to track their actuals. If ignoring actuals causes their estimates to diverge greatly from reality, they will suffer the consequence of their own bad forecasts. They will then have all the motivation they need to get better at estimating by whatever means works for them. The proper recourse may depend on gathering actuals or may hinge on another technique altogether. Developers who devise and pursue their own solution to labor forecasting will become far better at estimating than the scrum master could ever force them to be.
In summary, gathering actuals focuses on numbers that are difficult to gather, impossible to use as intended, and requires busy work that lowers the velocity of an agile team. Scrum masters will do better to stick with agile’s simple and effective reliance on story points to perform project planning. This topic is discussed in far more detail in later chapters, where we discuss story point techniques for regularly deriving current estimates for project stakeholders.
Eliminating hour estimation altogether
Indeed, many agile project teams eliminate hour estimating for tasks altogether, seeing the effort as a waste of planning time. They rely instead solely on story point estimates of the user stories to identify a doable amount of work for each iteration. The tasks are still identified during the planning day, but they are defined to be such small amounts of work that there is no point in forecasting them. Ken Collier, the author of Agile Analytics [Collier 2011], summed up the attitude embodied by this approach: “All the tasks in a sprint have to be completed, so why spend any effort predicting how much the time they will take? Just get them done instead.”
Teams that skip task-level labor estimation also keep their iterations very short so that the total number of tasks do not get out of hand. Consequently, these teams frequently need only a couple of hours to get a sprint planned rather than the full day suggested by the generic agile approach. The hours saved, multiplied by the number of developers on the team, often amount to one or two extra programmer days that go into building more shippable code, completely in line with agile’s strategy of maximizing the work not done. That said, other teams are working with stories that will not fit comfortably into short iterations. With bigger stories and tasks to manage, these teams do quite well with the double estimation approach where they use hour forecasts for tasks to confirm their story point estimates, thus ensuring they have not taken on too much work for a given sprint. The right approach for a given team seems to pivot on the type of work a project entails. Projects with mostly dashboarding work typically work well with short iterations and might do well skipping task card estimation. Teams with serious data integration work tend to prefer longer iterations and larger stories, so for them task card estimates are still worth the effort.
Managing geographically distributed teams
Agile methods prefer colocated teammates, as evidenced by 1 of the 12 principles published with the Agile Manifesto: “The most efficient and effective method of conveying information to and within a development team is face-to-face conversation.” However, we live in an age of telecommunications and outsourcing. Remote teammates and “virtual” teams that are entirely distributed across the globe are often a reality project planners cannot escape. Luckily, remote teammates do not rule out an agile development method. They require extra effort, as they do in a waterfall programs, but over the years agile practitioners have found ways to make “far location” work successfully. These adaptive strategies and techniques can be combined into a suggested solution path for adapting agile to remote teammates:
1. Consider whether fully capable subteams are possible.
2. Visualize the problem in terms of communication.
3. Choose geographical divisions to minimize communication challenges.
4. Invest in a single colocated sprint to establish the team’s esprit de corps.
5. Provide repeated booster shots of colocation for individuals.
These steps are presented in more detail in a moment, but an honest discussion about distributing a team’s developers should start by stating the obvious: even with all possible mitigating measures in place, remote teammates will probably reduce a team’s velocity and overall chances of success by a noticeable amount. The same is undoubtedly true for nonagile projects, but at least the agile community has some statistics regarding the impact of separating a team’s developers. The baseline is for colocated teams, and they achieve an 80% success rate according to a well-respected survey. [Ambler 2008] In comparison, when we allow some “near location” (where teammates can move easily to a shared workspace as needed), the success rate dips six percentage points, as shown in Figure 3.10. In contrast, when one or more teammates cannot join the group in person without travel, the success rate drops to 60%.
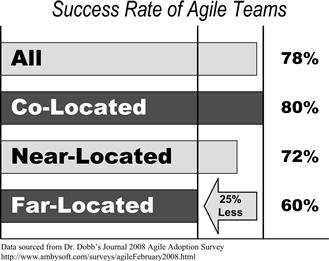
Figure 3.10 Impact of distributing teammates is measurable.
To phrase these findings most starkly, when teams dispersed their resources geographically, they effectively doubled their risk of failure, from 20 to 40%. This figure deserves some interpretation, however. First, the 60% success rate still exceeds that measured for waterfall methods operating under their best of circumstances [Standish 1995, 1999], so there is no reason that this increased risk should automatically force teams back into plan-driven methods. Despite the hit to success rates, we would not want to give up the speed to market, higher quality, and improved customer satisfaction that incremental delivery methods provide. Second, experienced scrum masters regularly find ways to make agile work with far location by understanding that it takes extra coordination efforts and requires the adaptations such as described here.
Properly managing remote developers benefits from realizing why colocation helps in the first place. Agile derives much of its advantages over waterfall methods by relying on fluid, informal communication instead of time-consuming formal documentation. Impromptu communication for geographically remote teammates typically pivots upon speaker phones and Internet-based collaborative software. Even when a company invests in the very best of these tools, they prove to be poor substitutes to actually having a co-worker in the same room. Effective communication is comprised not just of the words employed, but also the tone of voice, eye contact and facial expressions, and body language. Speaker phones filter out all of these components, turning a teammate’s voice into a tonally flat dribble, often with enough noise in the background that many of his words are impossible to discern.
Likewise, remote collaborative applications are still very awkward when it comes to sharing a quick sketch—nowhere near the efficacy of two people using a whiteboard. Email exchanges on difficult design points often involve so much back and forth that the parties involved must eventually resort to a phone call to clear up the issues. So, of course, substituting these clunky tools for in-person collaboration is going to hurt communication and productivity, no matter what methodology the team employs. For these reasons, organizations should be realistic and colocate team members whenever possible. When far location is unavoidable, then project planners should follow the steps offered in this section. Readers looking for even further thoughts on working with remote teammates should refer to material found in A Practical Guide to Distributed Teams, published by IBM Press. [Woodward, Surdek, & Ganis 2010]
Consider whether fully capable subteams are possible
The best recourse to distributed developers is to colocate subsets of developers into smaller groups that are fully capable for some particular category of work. The project planners can then send each subgroup the user stories they are best equipped to work on. This solution can be hard to achieve and maintain, however, when a project has internationally distributed worksites. For the past decade or so, geographical boundaries often place entire categories of skill sets on opposite shores. It is not uncommon to find all of a project’s business analysts in Europe and all its programmers in India. In this context, fully capable subgroups are often impossible to arrange. Moreover, keeping all the specialized subteams busy would require a steady flow of stories in each category. In practice, project planners have little ability to balance the technical skills required by stories on a backlog, given that its business requirements determine what appears there. As a consequence, the demand for subteams can be spotty, which will force most of them to find other projects to work on simultaneously. Thus striving for fully capable subteams can lead to specialized squads that are multitasking between projects. Workable, but hardly the solution one would hope for.
Visualize the problem in terms of communication
When fully capable subteams are impossible to arrange, the complementary roles of the team will be separated from one another. A major approach to minimizing the impact of this separation requires one to understand which roles need to communicate the most so that at least they can be colocated. Figure 3.11 portrays the communication needs of members of a typical BI team. The thickness of the lines connecting each pair of individuals depicts the extent of communication this team expects to occur between those two parties. With such a drawing, one can better plan which teammates most need to discuss matters spontaneously.
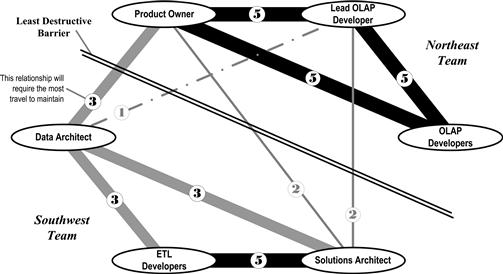
Figure 3.11 Geographical distribution’s impact on team communications.
Choose geographical divisions to minimize the challenge
Figure 3.11, which visualizes a team’s interactions, also shows a dividing line that represents a geographical separation between two subteams. In this case, it is a single line, so the diagram obviously pertains to a project where the developers are split between two office sites. When planning for three and four sites, the diagram naturally becomes that much more complex to draw. Drawing each candidate separation line on one of these communication diagrams reveals which parties will need to travel frequently in order to maintain team cohesion. It may also demonstrate where a formal specification document needs to be reintroduced into the method, despite the impact it will have on some individual’s work pace. Modeling separations on the communication diagrams can give team members the advanced warning that they will need to adapt their work habits properly, especially important if their main communication partners are in very different time zones. The divisions on such a diagram can also bolster the business case for implementing the conferencing systems and groupware applications the team is going to need once its members are separated.
Invest in a solid esprit de corp
Even with the best of planning, many agile projects will still find themselves having to proceed with a single team spread across many remote sites. As common sense will dictate, these projects will need to allocate some significant funds for building a team identity—an esprit de corps—to ensure that the agile method works.
First, the project planners will need to invest some travel money in order to assemble the entire team in a single work room for at least one complete iteration. Granted, this could add up to a sizable expense, but it gives everyone a chance to learn about each other as individuals. That knowledge will be invaluable once the team returns to their distant work sites, for their teammates will remain as real individuals during conference calls rather than just another scratchy voice on a speaker phone. Agile revolves constantly around team consensus. It is nearly impossible to forge a true consensus with several unfamiliar voices over a telephone line. The familiarity gained through a shared iteration will build trust, allow patience when iterations get tense, and make it easier for them to apologize to each other and move on. Having first-hand knowledge of their teammates passions, pet peeves, strengths, and foibles will allow project members to fill in the vital background needed to properly interpret what is being said—and not said—during the telecomm meetings. Knowing what someone meant to say will allow his teammates to avoid misinterpretation and mistakes that can burn a tremendous amount of time and energy. Brief colocation also leads to more effective training sessions and allows far more questions to be asked during the first iteration than would occur over the phone. In all these ways, the familiarity of just one iteration in a single shared space will improve a team’s long-term velocity significantly. Given the typical length of many data warehousing projects, in particular, the benefits of increased velocity will often far outweigh the expense of a kick-off colocation sprint.
Provide repeated booster shots of colocation for individuals
The end result of a kick-off colocation sprint iteration will be a more cohesive team sharing the same approach to iterative development, able to communicate quickly and accurately. Unfortunately, this valuable team identity will evaporate once folks return to their remote sites and the iterations wear on. For that reason, team leads should plan on a regular “booster shot” of colocation every few sprints. These repeat visits can be distributed, however, spreading out the cost by bringing back only one or two teammates at a time.
Invest in high-quality telepresence equipment
Perhaps the single greatest challenge to working with geographically remote teammates is not being able to see and hear them adequately. The ubiquitous conference phone in most work places simply does not provide a sufficiently faithful reproduction of a normal conversation to base an entire collaborative project on. Considering the high cost of labor and the disasters that can befall a project budget when a team makes a serious mistake, the expense of high-quality telepresence equipment will seem like a good investment. Of course, because it requires time and money to select and install the right equipment, switching to good communication products takes effort and foresight to make it available in time to help the team.
A particularly important part of planning a remote presence system is knowing what features to look for to support an agile team. At the top of the list is cameras. Images of one’s teammates are not a luxury. Voices can be ignored easily, whereas images turn the interaction into a conversation. The images of 6 to 10 teammates have to be managed, however, so an important feature of the telecomm package will be a “Hollywood Squares”-matrixed display of all members’ video feeds, as depicted in the upper left of Figure 3.12.
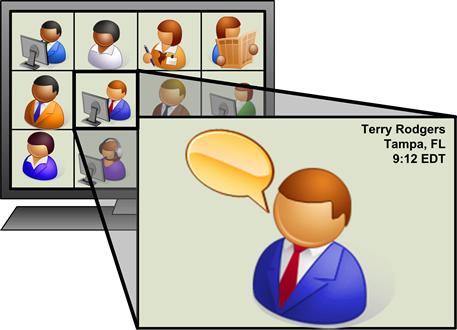
Figure 3.12 Good remote-presence tools help distributed teams.
To properly enable effective stand-up meetings, for example, the software must give the scrum master an additional measure of control. As each person takes a turn checking in, the scrum master must be able to mute all other mikes and cause the speaker’s image to expand on everyone else’s console, as demonstrated in Figure 3.12. Naturally, this causes the remote teammates to focus on the speaker just long enough to truly hear the answers to the three check-in questions employed by the agile stand-up meetings. Because missing a check-in detail can waste an entire programmer day, the scrum master’s console needs to remain in the matrixed display so that he can scan the team continuously to spot developers who have stopped listening to their teammates, such as the individual shown reading the newspaper in Figure 3.12.
A further crucial feature for the telepresence solution will be that it is always on. This will require a solid and secure Internet connection, plus software and server units to manage the continuous sessions, but the extra investment will yield a system that can be fully utilized by the team. Ordinary conferencing equipment, which can take 20 minutes to establish a connection between parties who need to meet for only 15 minutes, is simply not a solution to the team’s collaboration needs.
Provide agile team groupware
The final component required to enable geographically distributed agile teams will be the right set of Web-based tools the team will need to work cohesively. Project planners should consider whether the current versions of their software engineering tools will support a distributed team. If a team of warehousing developers is widely distributed, there can be little verbal coordination among them as they make changes to the project’s requirements, designs, data structures, and testing documents, as well as ETL code. The software engineering tools they work with will need to be repository rather than file based, so developers can work simultaneously on small pieces of the project without blocking each other with file locks. These tools will also have to support checking objects out and in to avoid inadvertent object overwrites between teammates. They will also have to provide version control and rollback so when the team fails to coordinate effectively, the last working version of an artifact can be restored.
Beyond the engineering tools, a distributed team will need an agile project-tracking package that can make an electronic version of the task board and burndown chart available to everyone on demand. Picking such a package can be a little tricky. Given that there are a dozen different agile approaches available, and that even Scrum has many flavors, the project planners may not find a package that supports the exact flavor of agile they wish to follow. Every package seems to have some crazy limitation, such as constraining story points to 1 through 3 or not having any support for tech debt and scope creep on the burndown chart.
Luckily there is a wide variety of packages on the market today. Several of them support plug-ins, which address the limitations of the base package greatly. A good number of them are also offered in a “software as a service” format, making implementation very fast. With this much to choose from, most Scrum teams seem to be able to find a solution that will support their distributed teammates.
Summary
Scrum provides a streamlined approach to managing a project within the team room. It relies on two simple, yet powerful, tools for keeping an agile team on track during each iteration: the task board and the burndown chart. The task board provides a series of key status columns that the iteration’s task cards should progress steadily across as developers work them toward completion. The task board allows developers to find the next set of work on their own and makes project status very easy for all stakeholders to visually surmise for themselves. The burndown chart depicts an iteration’s remaining labor hours by day, showing the team whether they are likely to have completed all the tasks in time for the user demo. The burndown chart also allows teams to measure graphically their velocity at the end of each iteration and makes adverse events that threaten that velocity in midsprint very easy to detect. Given the streamlined style of project room management Scrum establishes, there are some best practices identifiable for questions such as whether teams should lengthen an iteration if they are running slow and whether they should track actual labor on tasks in order to improve their ability to estimate. Finally, remote teammates run counter to agile’s preference for colocated developers, but there are several techniques for adapting the method to distributed team structures, including an investment in remote presence systems and electronic agile project support applications.