Chapter 5
Deriving Initial Project Backlogs
How can information technology (IT) help product owners create an initial list of user stories for a data integration project?
What does a predevelopment project backlog look like?
What data integration topics do epics and themes typically link to?
The first part of this book presented a generic style of Scrum as taught and practiced by many organizations for the construction of general computer software applications or—as data warehousing professionals know them—“online transaction processing” (OLTP) systems. For the world of “online analytical processing” (OLAP) applications, “plain-vanilla” Scrum serves as a fine collaboration model for teams building the front-end dashboarding portion of an OLAP system. Teams developing the data integration back ends of those applications, however, will need to adapt Scrum to better fit the unique type of work that they do. As described in the opening chapter, the many hidden architectural layers involved in most data integration applications make delivering value with every iteration of Scrum tantamount to building four or five miniapplications in only a couple of weeks. Most teams find that impossible to achieve consistently. Instead, data integration teams need to adapt Scrum’s notion of both the user story and the way it feeds work into the iterative development process in order to make agile collaboration realistic.
The second part of this book focuses on the first of those adaptations: modifying user stories to better support data integration projects. This chapter considers a process for generating the initial project backlog for a data integration project in a data integration context. The next chapter describes how to convert the resulting user stories on the project backlog into “developer stories,” small, architecturally specific units of functionality that a data integration team can better manage with its Scrum-based delivery process. Finally, the third chapter discusses techniques for assembling those developer stories together into both a sequence of releases that will deliver increments of value to their business customers and a whole project estimate of an application’s likely development cost and duration. In large organizations, this whole project estimate is an important objective for a project because it is typically required to secure the funding needed to begin development.
The presentation of these three steps is example based so that readers will gain a concrete notion of how a data integration project can be defined and planned for incremental delivery using agile techniques. The example we employ takes a request for a “Revenue Trends Data Mart” from the inception phase of corporate IT release cycle and elaborates upon it until development iterations can begin. This chapter details the work of a project architect who joins the effort before it is even a project. The business sponsor and an enterprise architect have made only a first look at a desired data warehousing/business intelligence (DWBI) solution in order to appraise its feasibility. Enterprise architecture can provide the project architect little more than a sketch of the solution and some high-level constraints. Given that almost superficial starting point, Paula, our project architect, has to interview the project’s imbedded business partner and prepare an initial project backlog. As part of the same effort, she will also identify the information members the development team will need to begin an agile elaboration of the project’s target data model, source profiles, and transformation rules.
Value of the initial backlog
For Scrum, an initial project backlog is the list of user stories that provides enough definition that teams can start development sprints. It provides an excellent notion of project scope and allows developers to contemplate the technical objectives and labor it will require. The creators of Scrum did not specify where such a backlog comes from, suggesting instead that it is simply originates during the project’s first story conference. [Schwaber 2004] In practice, Scrum teams start gathering an initial project backlog as part of the preparatory work performed during “Iteration 0.” Many data warehousing projects can start even earlier. Given that warehouse projects are typically large projects, the program management office (PMO) of most companies wraps them in a release cycle. The typical release cycle described in Chapter 2 has two phases before system construction begins: inception plus discovery and elaboration. These phases provide Scrum teams the opportunity to assemble an initial backlog of user stories and perform enough data and process architecture work to support the first development iterations.
Some agile purists might interpret the initial project backlog of user stories as somehow returning to the pattern of big specifications utilized up front by waterfall methods. To the contrary, as shown in the sample project, the project architect will keep the initial set of project artifacts limited to a list of user stories and a few diagrams. The aim is to provide a lightweight rather than a detailed depiction of the project.
The initial product backlog is very much like writing an outline for the author of a book. It takes a short amount of time to build, but saves the author even more time as the next phase of writing progresses and it greatly helps make the resulting book seem focused and linear. The outline itself is not restrictive because the writer is of course free to update it as new ideas occur. Yet it does express a central intent to the work that serves as a soft boundary for keeping wildly irrelevant notions from sneaking into the project. In the agile development context, software developers need the product owner to have such a “guiding outline” for the project. Even with iterative, self-organized teams, coding is still very expensive. Coding without a direction or constraints on scope can be ruinously ineffective. The initial backlog allows the team to perform some necessary architectural work for both data and process so that when the programmers join the effort they do not start programming in circles.
Paula, the project architect in our example, takes the time to derive an initial backlog with the product owner because it provides multiple benefits, including
• The initial backlog allows product owners to arrive at the first story conferences prepared to state which stories should be started, having thought them out well enough to clearly describe what is needed
• It gets the product owner thinking so that she can stay ahead of future sprints as the project moves forward
• It scopes the application so that the coherence of future stories can be considered carefully
• It provides the developers a glimpse of the whole project so that they can do some high and midlevel design based on knowledge gained from generating the list of user stories
• It provides the team’s software engineers a first opportunity to include features that address necessary but nonfunctional requirements such as data volumes, processing time, and programming patterns
• It allows the team to make an initial estimate of project cost and duration
• It allows the project to begin coordinating milestones with other projects and programs
It is hoped that the process of deriving the initial backlog defines for everyone the “spirit of the application” so that as the product owner drafts further user stories, all team members can ensure they are consistent and aligned with the project’s driving requirements.
Sketch of the sample project
This chapter employs a hypothetical data mart project to illustrate how a team can derive a starter set of user stories for a warehousing project that involves substantial data integration requirements. The sample project used is a distillation of the actual project discussed in the first chapter, which the sponsors ran side by side with a comparable waterfall project and which delivered its application with one-third the programming hours and one-half the cost per data transform module. We use this sample project in the next two chapters also, where we first describe how to translate user stories into programmable “developer stories” and then show how to estimate an initial backlog for project sizing.
Our sample project was commissioned by a large U.S. telecommunications firm, which we can call “PaBell.” This company had grown over many decades through mergers and acquisitions from a regional phone company to a conglomerate offering a diverse set of voice and data products throughout much of the continental United States. The author has simplified and “sanitized” our description of the project sufficiently so that the following illustration focuses on the generic challenges faced by any complex firm that must plan and guard its revenues based on a capital-intensive infrastructure.
In our example, the company provides a wide selection of service products to both the consumer marketplace and business customers. Services range from “legacy products,” such as phone and data communications based on copper-wire circuits, to more “strategic offerings,” such as cell phone service with large data plans. The project considered here came about because PaBell was losing so many subscribers within certain areas of its cell phone business that quarterly revenues were declining noticeably.
The executives asked the corporate strategy team to research the root cause of this “revenue erosion” and to propose ways of mitigating the forces driving subscribers away. Corporate strategy was a small department, staffed with some very clever “data cowboys” who could perform just about any statistical analysis ever invented—as long as they had clean and complete data to work with. Seeing that they needed a steady feed of quality information to run into their data mining applications, corporate strategy approached the business intelligence group of the corporate IT department to build a revenue data mart. The DWBI group had recently adopted an agile methodology based on Scrum and XP, and therefore asked corporate strategy to assign a product owner to work with a data integration team. To help defray the expense of the data mart’s development, corporate strategy invited the financial analysis department of the controller’s office to participate as a secondary sponsor. In turn, the controller’s office provided a subject matter expert with extensive knowledge of finance’s requirements and the company’s many revenue systems from which data would be sourced. Finance’s involvement was considered crucial because the financial analysts regularly groom the revenue and product usage figures that corporate strategy used as the starting point for their analytics.
Fitting initial backlog work into a release cycle
In our sample project, the Scrum team working in sprints will have to fulfill the objectives of the program management office’s release cycle. This combination creates an interesting overlap between release cycle phases and Scrum iterations at the beginning of a project. Figure 5.1 presents the overlap employed during the sample project. It maps the Scrum team’s iterations onto the release cycle defined by the company’s program management office. For waterfall projects, the PMO wants a list of major use cases and a project cost estimate at the conclusion of the inception process. Paula, the sample project’s project architect, has negotiated to employ an initial backlog of prioritized user stories as a substitute for the major use cases. She will gather them based on interviews conducted with the product owner before the project officially begins with Iteration 0. She calls that preproject time “Iteration −1.” Using the initial backlog from Iteration −1, Paula plans to work with the project’s data architect and systems analyst during Iteration 0 to produce several artifacts that will satisfy the PMO’s requirements for the inception phase:
• a groomed project backlog of user stories
• a whole project sketch of the logical models for both data and processing
• Iteration 1’s physical data model and source-to-target mapping
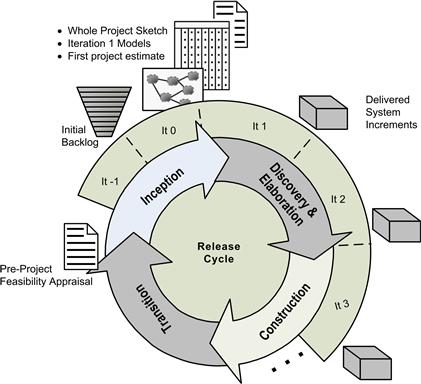
Figure 5.1 Fitting early iterations into a typical PMO release cycle.
With those artifacts complete, the team can begin Scrum’s development iterations. The PMO wants each project to undertake a discovery and elaboration phase where the developers should prove the architectural soundness of their application before beginning the construction phase of the release cycle. Paula plans to use the first couple of Scrum iterations to meet that requirement because she knows that she will have to work with her product owner to either elevate the riskiest user stories to the top of the backlog or start the project with an architectural sprint. Because Paula’s company has a well-defined systems architecture for data warehousing projects and a stable set of DWBI tools, she believes her team will be able to demonstrate a sound project architecture in a couple of iterations or less. Once that demonstration has been made, the team will continue with their development iterations, but Paula will label them as part of the construction phase when she speaks with the PMO.
The handoff between enterprise and project architects
Paula was assigned to the “Revenue Trends” data mart effort when its inception phase was half complete. Eddie, the enterprise architect who performed the initial feasibility assessment, had collected information for that assessment from conversations with executives and directors concerning the business purpose of the data mart they requested. He took a quick look at data and platforms available in the corporation and judged the project to be technically feasible. He also produced a rough order of magnitude estimate for the effort. Based on his understanding of the data sources available, their volumes, and how they will need to integrate into the requested analytics, Eddied drew upon his experience with other warehousing projects and estimated our sample project’s “tee-shirt” size as a “large.” It seemed smaller than the XL projects the company already had underway, but it is definitely bigger than the M-sized data marts the company has built to date. At this point he is ready to hand off the rest of the discovery work to Paula, who he asked to call him when she was ready to start.
Paula, the project architect: Hi, Eddie. This is Paula. We scheduled this time for me to get the handoff of the Revenue Trends Data Mart project from you.
Eddie in enterprise architecture: Oh hi, Paula. Glad you decided to rejoin our happy little telco.
P: Yeah, had to work elsewhere for 2 years to get some agile data warehousing experience, but I’m happy to be back. The crazy maze of source applications isn’t any better than I remembered though.
E: Nope, afraid not. By the way, I attended the Agile Warehousing 101 class you gave last month. So now I’m familiar with epics, themes, and stories. It’ll be interesting to watch this Revenue Trends Data Mart project you’re going to do. We’ve changed the project role names a little since you were here. Let me give you a quick rundown:
• We now call your position a “project architect.” People in that role are still responsible for a solution-level description of the application. They’re expected to frame a project’s data, processes, and quality assurance plan and then delegate to specialists on their team the work of filling out the details. For warehousing, they also select the upstream systems their project will pull data. You should confirm those choices with me in case I happen to know of a better source, such as a master data application or another warehouse dimension some other project is working on.
• The project’s data architect is still called a “data architect.” He’ll start with your solution-level data model, finish it with detailed logical modeling, and then provide all the physical modeling. He’s supposed to coordinate data architecture with my group so we get notions such as master data elements and reusability across data mart projects right from the start. We want you guys to build stuff that further our corporate business intelligence roadmap as much as possible.
• Tech lead is now “systems analyst.” He’s supposed to validate your choice of sources with some data profiling, research the details to the business transformation rules you get from the business experts, and sketch the logical design for the extract, transform, and load application your team will have to build.
So, as project architect you’re going to take the lead on defining the solution—both data and process. You were a data architect when you were last here. Did you get a chance to do any ETL while you were away?
P: Yep. 18 months with InformataStage. It was good to see the details on the process side of a project for a change.
E: Well, as you can see from the short packet I sent you on this Revenue Trends Data Mart, I got discovery started with a couple of interviews, just enough to get a few things established, namely:
• I established that they want all company revenues, so you’ll have to integrate data from the subsidiaries for some of the dimensions such as product
• I figured out some reusable portions—some we already have and those you’ll have to build
• I selected some likely data sources
• I wrote up a “tee-shirt” size estimate of project cost and then put the project on the IT roadmap
Think you’re ready to finish off this discovery work for us now?
P: No problem. Of course, coming from an agile perspective, “discovery” means pushing ahead our understanding of data and process through the first 80% of a definition. We need to do just enough to know we haven’t made any big mistakes and to get the first chunk of user stories defined so we can get the project started.
E: You’ll still have to do the “elaboration” half of the phase, where you prove out your architecture and mitigate as much of the project risk as possible.
P: True. We’ll do that by working with the business to identify the user stories that link up with the high-risk aspects of the application. Then we’ll get those placed as high in the backlog as we can while still delivering some stuff that has value to the customer. It’s always a balancing act when you take an agile approach.
E: Right. I remember you saying that in class. You want to start delivering value to the customer and getting their feedback on your design as soon as possible. You said that’s more important than knowing you’ve got every last design detail right before you start. That’s probably right.
P: “Fail fast and fix quickly.”
E: Like I said, it’ll be interesting to watch. So, the business departments have picked a couple of subject matter experts to work with you. One’s the product owner.
P: I interview them for the first time tomorrow. The objective will be to derive an initial project backlog of user stories and then prepare a budgeting estimate that will let us get the project funded.
E: Those user stories…you made them sound very process or ETL oriented during your class.
P: That’s just shorthand. Loading a set of business entities loaded so the business can use data to answer a questions is where the “rubber meets the road,” so it’s good to define user stories at that level. It makes the whole team focus on delivering value rather than the intermediate, technical steps. But, rest assured, as soon as we’re funded I’ll start working with the data architect during Iteration 0 to define the logical target data model. We’ll also have the systems analysts start in on the source data profiling and business rules. We’ll figure the essentials of source and target well before we start designing process modules.
E: You’re going to figure out everything about the target model and business rules in just a few weeks?
P: We’ll shoot for the most important 80%. For the data model, that’s usually all the entity names, their keys and joins, plus a sketch of all the major business rules for the derived columns. We’ll leave the details of the rest of the columns until just before each table gets included in a construction sprint. The systems analyst will take his lead from the project architect and data architect regarding when to spell out each set of sources and business rules for the programmers.
E: But you’re going to just sketch the business rules for the major columns?
P: Sketching is the right level of definition for most of them if you’re going to get the project underway in a business-reasonable time frame. The discovery conversation may reveal some rules that are absolutely crucial. We’ll investigate those beyond a sketch. We’ll also schedule those as early in construction iterations as possible so that we can get them well validated before basing any other items on them.
E: Hmmm. I’m amazed you wouldn’t do all the business rules first.
P: That could delay the project start by 6 months or more. Remember, product owners can usually find value in many of the data mart components even when delivered in increments. For example, seeing “revenue by customer” is worth something to them, even if “revenue by customer and product” would be better. Because we’re going to deliver in pieces, we need only have the work immediately in front of us defined in detail. Get the coders working on Iteration 1 and that will buy time for our team’s data architect and systems analyst to spell out the details for Iteration 2.
E: So getting back to these discovery interviews you’re going to do, the objective for that work is….what?
P: (a) Define a list of user stories that more or less define the application so we understand our project objectives and cost and (b) polish the first iteration’s user stories so that they’re independent, valuable, estimable, small, and testable.
E: And still negotiable. Right, the INVEST test. Well, I did the interviews for the tee-shirt estimation. I can give you enterprise architecture’s version of the business target model and some high-level constraints.
E: What we used to call the “solutions model.” If you’re speaking carefully, it’s called the “business dimensional model of the warehouse’s target data store,” but we usually just say “business target model.” It’s the model of business entities showing facts and dimensions the customer will need for his data mart. (See Figure 5.4 for this chapter’s example.)
P: Got it. Tell me what you’ve got on that model so far.
E: Well, they’ll need a revenue fact entity of course, and dimensions for customer, product, and geography. As far as recommended sourcing, the company put shared account and customer dimensions into production a year ago. It’s in third normal form using a typical “party” model. [Silverston 2001] Data quality for that topic area is real good so each data mart project only has to transform the records they need from that schema into a customer dimension of their own.
P: Cool. You’re making our life easy. Do you have a product and geography dimension for us too?
E: Nothing so far on product, which is too bad because we’ve got six different product catalogs in this company and no two of them use the same product number for more than 25% of the items they have in common. So your project’s going to have a challenge there. For customer information, we’ve got postal billing addresses for past and present accounts as part of building out the customer party model.
P: Nothing for the location of customer equipment on our network?
E: Nope. The network management department is working on a repository of network service addresses, and I’d love to get your business partners to delay their data mart project until that data is ready, but…
P: Revenues are falling and everyone wants to figure out why.
E: That’s right. So, have your data architect coordinate through us in enterprise architecture if and when he models out IP addresses and equipment numbers for end-user services because that will all be part of the network service address topic area we hope to make an enterprise dimension. You’ll want to get the grain right so that you don’t have to reengineer your data structures when you switch over to shared dimension data.
P: Will do. So here’s the business target model that I’ve been drawing while you spoke. (She emails the simple electronic diagram shown in Figure 5.2.) I’ll confirm all those dimensions when I interview my subject matter experts (SMEs).
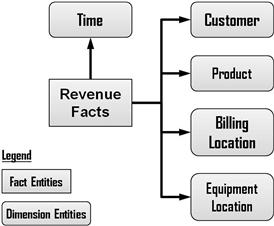
Figure 5.2 Starter business target model for sample project.
E: Yep, that’s about all I have now. I’m sure it will become a lot more detailed as you folks start working with the product owner. Be sure you and your team send us versions of all your high-level artifacts as you get clarity on them.
P: Sure thing. Let me confirm with you the process I’m going to follow to close out the discovery work you started. My goal is to interview the SMEs to get our starter set of user stories, but I’m also going to… (Here she walks him down Table 5.1, pointing out in particular the places where her objective is to confirm the enterprise architecture work and where she will extend or add to it.)
Table 5.1 Major Discovery Steps Showing Collaboration Between Enterprise and Project Architectsa
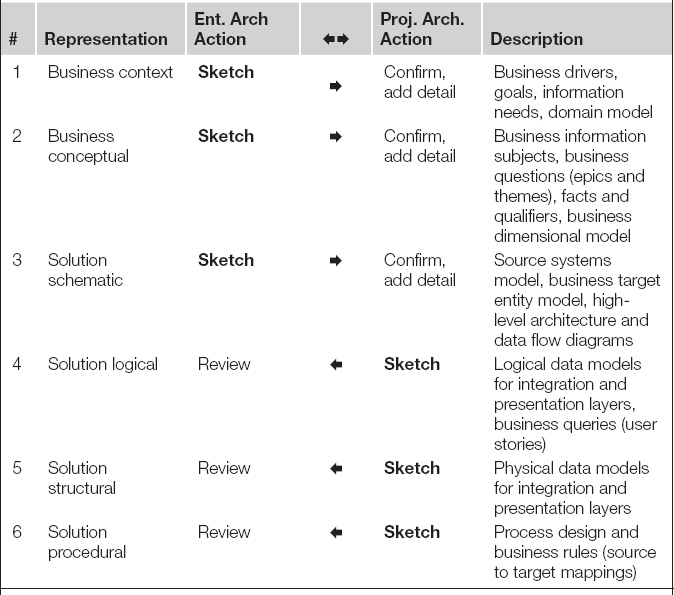
aAdapted from [TDWI 2001]
E: That fits with our standard process. I’m a little surprised. I thought agile was “let’s just throw coders at every business problem we can find.” I would have thought you guys would do without most of the discipline. That’s why I was worried that agile data warehousing would lead to a lot of data disparity between applications.
P: We still use sound system and data engineering principles. The real difference is agile warehousing teams acknowledge that a design doesn’t have to be perfect before you start coding and getting feedback. We pick out the key integration points within an application and between systems and get those right. The remaining definition work is mostly issues concerning columns and data quality, which can be addressed through increments of code. During our iterations our data architects and analysts stay one iteration ahead of the programmers and provide them the detail guidance they need as they start programming each increment.
Key observations
The conversation between the Scrum team’s project architect and the company’s enterprise architect touched upon a few key points that deserve highlighting.
Agile warehousing is collaborative even outside the project team. Enterprise architecture typically starts a project, places some definition and constraints upon it, and then hands off to a project team. The project team does not start with a blank slate or proceed without support.
As the application is built, the project supports the enterprise architecture’s roadmap for the company’s warehousing applications. In turn, enterprise architecture supports the project with knowledge of existing data assets, such as reusable dimensions, data modeling patterns, and other architectural standards. The enterprise group also reviews project design decisions to ensure that the data mart will integrate into the data warehousing environment.
With this collaboration in place, the individual warehousing teams rarely have to reinvent the wheel. Enterprise architecture provides them a good starting notion of the project, including how much data integration it will entail, the target data architecture needed, and the major source systems to draw data from.
Architects from both enterprise and project levels understand there will be some rework involved in the project. For example, a perfect, enterprise-reusable dimension is not always available when a project needs to provide those services to its customers. Some of the project’s components will be built to answer an immediate need and then swapped out later when the enterprise version goes online.
Some rework is unavoidable, but a major goal for the collaboration between enterprise and project architecture is to minimize it. They must continue to communicate as the agile team learns more about the problem space of the project so that together they can devise the best evolutionary path for the project’s data model to take.
User role modeling results
Like many data marts, Paula’s project will have multiple stakeholders. Before starting to gather an initial project backlog, she spends a short time performing some initial user role modeling, as outlined in the prior chapter. She makes this effort so that she can better guide the product owner in considering the entire user community during the initial backlog interview. For this initial user modeling, she worked by phone conversations with those who are familiar with the project concept, such as the product owner, the secondary sponsors, and the enterprise architect. She understands that it may have to be repeated in the future as the project progresses. However, by performing this modeling at an early stage, she identifies what the overriding interests of the key users are and where those interest overlap or collide. If she asks those she interviews what systems and user groups they exchange information with, the effort lessens the chance of overlooking a major stakeholder constituency from the start. Even for agile teams, few surprises can muddy the water and derail delivery dates more than discovering a major stakeholder in midproject. For that reason it is worth investing a small amount of effort in user role modeling up front to be reasonably sure that the initial project backlog has not omitted a crucial set of epics and themes.
As shown in the last chapter, we pursue user role modeling by
1. brainstorming the types of users an application will have
2. listing some typical user stories for each
3. grouping similar users and stories together
4. summarizing a list of who is after what in terms of major functions and benefits
Figure 5.3 depicts the outcome of Paula’s user modeling as it appeared at the end of the third step. In addition to users from corporate strategy and finance, her interviews revealed formal and informal data exchanges with the regional BI teams, their executives, and the company’s product managers at regional and corporate levels. Figure 5.3 includes a representative user story for each type of user. It also depicts these roles grouped together under user superroles such as product analysts and regional analysts. Figure 5.3 also groups these groups clustered between the interests of the two major user representatives involved in the project: corporate strategy and financial analysis. Having a cluster for finance on the user model soon proved important as the sample project proceeded. As product owner of the application, it was easy for the corporate strategy representative to forget stories pertaining to financial analysis. The user model allowed the project architect to continually include the secondary stakeholders in her conversations with the product owner.
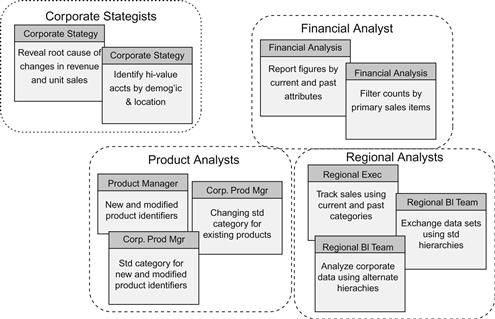
Figure 5.3 User role models for the sample data mart project.
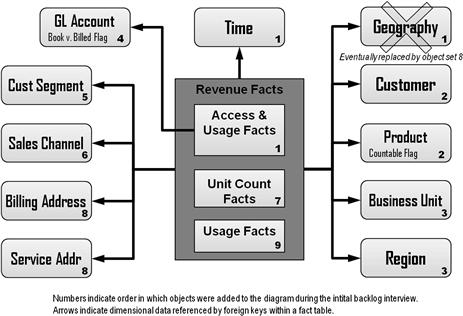
Figure 5.4 Business target model at end of sample project’s initial backlog interview.
Key persona definitions
In our PaBell project, the user role modeling process identified two clusters of user stories that aligned with the two major stakeholders of the project. To safeguard both side’s interests, the project analyst realized that two primary personas were required: one for corporate strategy and another for financial analysis. Once defined, these personas allowed participants in the initial backlog interview and later user story sessions to easily imagine the key the services stakeholders would need from the requested application. This section presents the resulting persona descriptions. Each description follows the template listed in the prior chapter and links their various interests to the notions of “summary goals” and “user goals” also presented there.
Carla in corp strategy
Carla serves as the manager of corporate strategy, reporting to the director of product management and guiding the work of three product analysts with specialties in legacy products, strategic products, and promotional campaign planning. Officially, her group should provide action plans for strengthening the company’s product mix through bundling and pricing. Unofficially, she advises network planners and advertising managers on how to make the company’s products more attractive.
Her annual review typically pivots upon questions concerning the products her group’s guidance made measurably more successful and what competitive situations the four of them helped the company overcome.
Focus of Carla’s Annual Review (Summary Goal)
The corporate strategy upstream data partner is mostly finance, which provides usable figures for billings and sales, but her group also receives crucial feeds from network management, fulfillment, customer care, and third-party customer demographic information vendors. Their downstream business partners are product managers, marketing, and senior VPs of two major business units called consumer marketing and business marketing. The downstream parties in particular may turn out to be important stakeholder groups worthy of user modeling later.
Carla has often said that the biggest waste of time in her job is all the hunting and gathering of reference data essential for understanding the many codes involved in finance’s information on revenue, costs, call centers activity, and Web site traffic. These codes identify crucial business entities such as products, sales agents, pricing plans, and organizational structures. “It’s not so much that there’s several hundred codes needed,” she often complains, “but that they are changing all the time.”
She often cites as well the challenge her teammates have with information timeliness and accuracy. Overlapping customers and product catalogs from the imperfect divisions between company regions and business units force them to sink countless hours in deduplicating the basic reference information before the transactions can be tagged and aggregated.
Typical Business Questions (User Goals)
• Who is buying what products?
• How good is their experience with those products?
• How much do they spend on those products, and how could the company entice them to spend more?
Franklin in finance
Franklin is the company’s manager of financial analysis, answering to the director of finance, and responsible for the work of 15 financial analysts with specialties by business unit, product families, and chart of account categories.
His official role is to ensure that all numbers reported to external parties, including the Securities and Exchange Commission (SEC), are complete and correct. This focus reflects the summary goal of the controller’s office to provide complete and accurate accounting of the company’s financial operations. Much of this work involves managing accrual rules for revenue recognition and expense rules for allocating capital costs. He also manages multiple “realignments” of categorization schemes for product, customer segment, and sales channels throughout the year.
Unofficially, he spends considerable time helping the business units design and implement custom recategorizations of financial figures so their execs can roll up sales and revenue as they prefer to see it.
His annual review typically focuses on the three largest restatements issued by finance during the prior year, and how his team helped detect and mitigate the root cause.
Focus of Franklin’s Annual Review (Summary Goal)
• Describe the causes for the major financial restatements our company made this past year and how your team knows they will occur again.
Given his team’s role in controlling financial reporting, his upstream business partners are primarily owners of the line-of-business systems, a revenue journaling application, and a set of reconciliation and cost allocation engines. Downstream we find corporate strategy, business unit analysts, and particularly vice presidents, as their compensation is determined directly by the figures Franklin’s team adjusts.
Franklin finds himself constantly comparing numbers before and after reference code updates for his downstream business partners. The reference code that gives him the greatest challenge is the “countable” flag. Finance only includes products designated countable when it reports on changes in unit sales. These designations are controlled by business unit product managers who change them steadily as products age and new products take their place. Providing accurate unit counts given the changing categorization consumes much of his work day, so that he often works nights and weekends in order to finish reconciling ledger balances. “Those reconciliations cause me tremendous inconvenience,” he laments, “as the raw figures get categorized from the encoding of local business systems to the standard coding for corporate reporting, especially for product catalogs, customer segments, and sales channel.”
Data timeliness is always an issue for him because the deadline for monthly reconciliations is the seventh business day of each month, but runs for the revenue journaling and cost allocation engines sometimes do not complete until the fifth day.
Typical Business Questions (User Goals)
• What revenue reconciliation errors did the latest code updates for customer segment and sales channel create?
• What do last period’s financial numbers look like when reported through each business unit’s alternative product categorization scheme?
• How have the sales unit counts changed given the flagging for issues around countable and uncountable products?
An example of an initial backlog interview
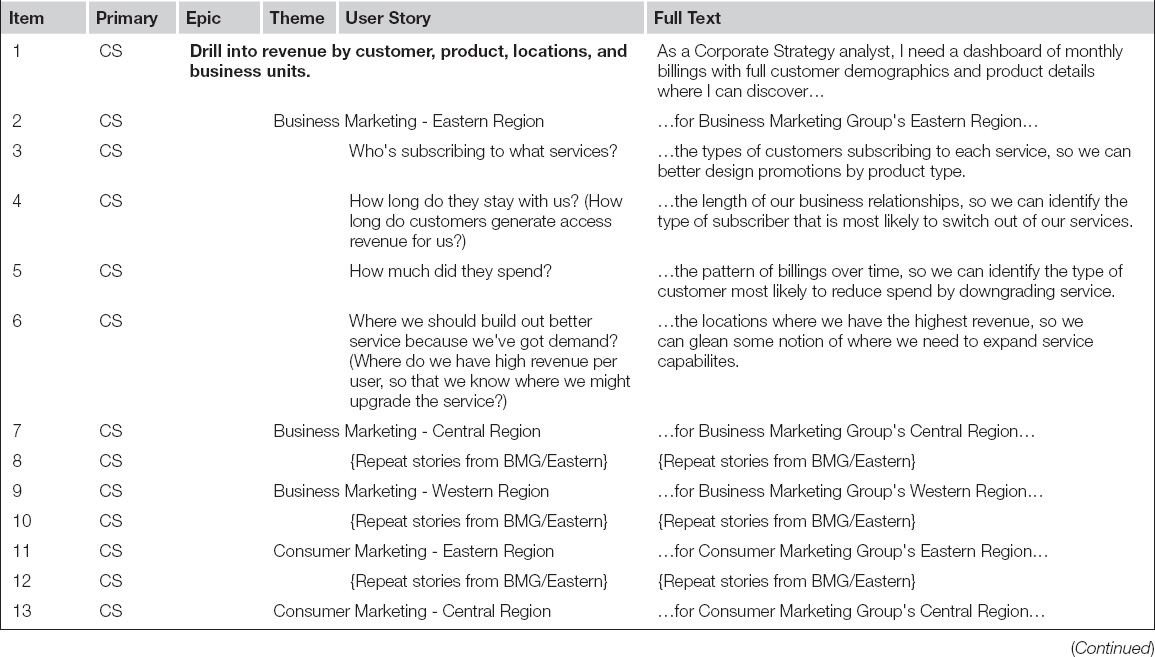
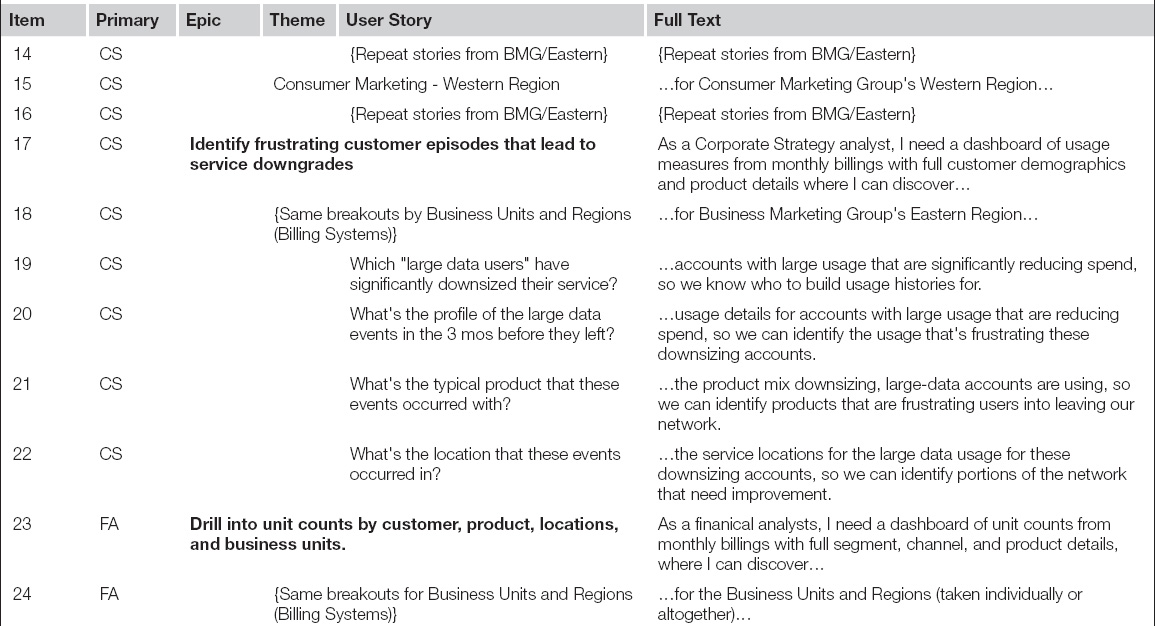
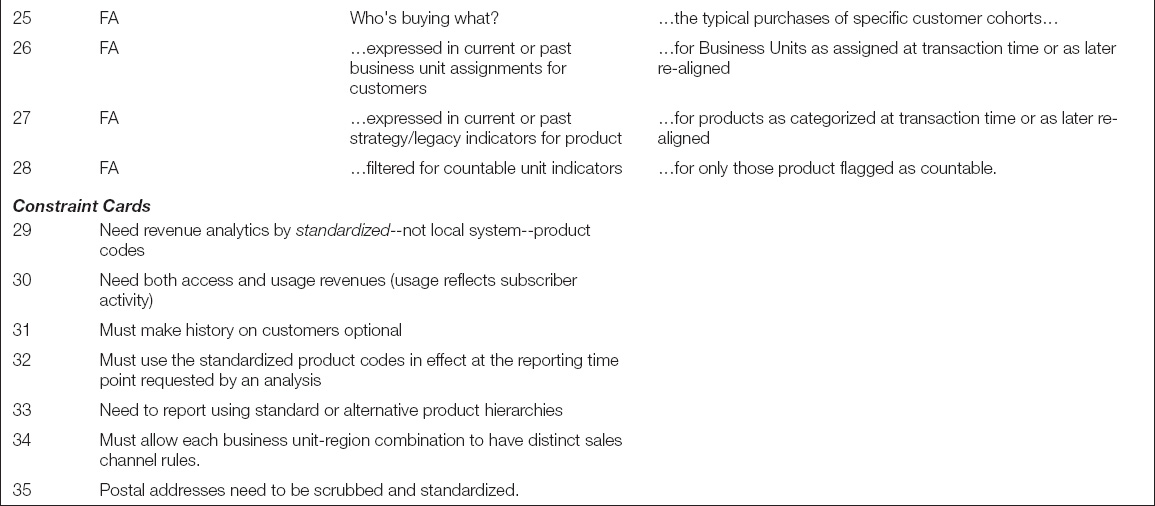
Based on her user role modeling, Paula decided to hold the initial backlog interview with not just the project owner from corporate strategy but also the subject matter expert from finance. This section provides a transcript from that interview, with Paula’s counterparts in the business named from their personas, namely Carla from corporate strategy and Franklin from financial analysis. During the interview Paula guides these two stakeholders through the process of enumerating the central business problems of the project, stepping them through a series of epics and themes to arrive at solid user stories. Each time Paula believes they have articulated any of these three types of statements successfully, she records it on the initial project backlog. Sometimes this backlog is a set of story cards as originally envisioned by the creators of Scrum, but more often it is an electronic spreadsheet. Table 5.2 portrays the backlog that resulted from this interview session as it appeared at the end of the conversation.
Table 5.2 Initial Project Backlog for the Sample Project
As a business intelligence architect, Paula is also listening for major metrics and qualifiers; when she hears one, she places it on a business target model that will be translated eventually into a star schema by her team’s data architect. The business target model was started by the enterprise architect and shows just the business entities that the users will need in their dimensional analysis model and how they join together. Figure 5.4 represents Paula’s star schema as it appeared at the end of the interview. Once fully elaborated, this business target data model will express to business and IT alike the interconnected nature of the required facts and dimensions with an economy that even user stories cannot match. For data warehousing projects, both a story backlog and a business target model are absolutely necessary to move on to the next step in project definition.
To keep the process at the right level of detail and moving forward, Paula captures important information that does not fit within the user story format on “constraint” cards, as introduced in the prior chapter. These may well be simply additional lines on the initial backlog. Paula’s constraint cards from this interview are displayed at the bottom of Table 5.2.
The following transcript provides readers that are new to data warehousing a good glimpse of how complicated user stories for data integration projects can be. Note that when the discussion does not identify epics, themes, and stories, it is still a valuable source for design constraints, priorities, or benefits the users are hoping to gain from their stories. This section provides some other aspects on the process, apparent in this conversation, immediately following the transcript.
Framing the project
Corporate strategy (Carrie): We’re experiencing serious revenue declines in some major markets. Corporate strategy has done some initial analysis using two consolidated snapshots from the billing systems that span the last 6 months. We think it has something to do with tablet computers and large-volume data users’ who get frustrated with our 3 G network’s data rates. But that’s just what my team of three could deduce from working with the data for a few weeks. We need a dashboard with clean, daily information to find out for sure. That dashboard would let us design some product bundling and network enhancements to improve customer satisfaction. If we can zero in on the right problem, we can arrest or even reverse whatever is driving away our subscribers.
Project architect (Paula): Why do you want to partner with us folks in information technology to work on this problem? Your staff knows SAS pretty well.
CS: We need IT’s help because the data cleansing and integration required are beyond what the four of us in corporate strategy can handle. We did a very imperfect job at it during our little prototype. Plus, once we get a way to see what’s going wrong by locations, we’ll need to follow the trends to see if our corrective actions have had the impact we intended. The four of us don’t have time enough to repeat all that data crunching regularly.
PA: You remember from our agile class that product owners have different levels of user stories, right? What you just expressed sounds to me like an “epic”: Drill into revenue over time by geographic regions. I’ll start a list of user stories and build it out as we talk. (Item 1 in Table 5.2.) I can also draw a business target model of the information your users will need for performing this analysis. I’ve already placed revenue, geographies, and time on it. (Objects labeled with a “1” in Figure 5.4.) Arrows show which type of information points to another as a reference.
CS: I understand the drawing, and I can see already that we’ll need to add product and customer demographics for breaking down the revenue numbers.
PA: Let me note that on both the story list and the target model. (She updates user story line 1 and adds business target model object set 2.) Which of our two business units do you need this capability for? Consumer or business marketing group?
CS: We have erosion in both, although I think it’s for different reasons. In consumer accounts, I think people are getting frustrated trying to watch movies via the cellular connection on their tablets. They upgrade their home Wi-Fi networks and then cancel the data plan on the tablet. For business, it’s probably tablet users with big email attachments that are changing their daily habits. They wait until they find a Wi-Fi hotspot before trying to do email. Of course, when they switch to Wi-Fi, we lose out on data transport revenues.
PA: Of the two, which business unit would be most important for you to understand first?
CS: Probably business marketing because that’s fewer customers to contact. We can change pricing and bundling by just sending out a memo to the sales force. We have to link changes in consumer marketing to advertising campaigns and regulatory notices.
PA: Okay, business marketing comes before the consumer market group. I’ll maintain that ordering as we fill out the backlog of user stories. How about the three regions? Each has a separate billing system and thus a different pile of uniquely formatted data we need to bring over to you. We won’t be able to put them all online at once. What order do you want to understand them in?
CS: I’d go in the order of greatest revenue, so eastern, central, and western.
PA: Often when we’re trying to organize user stories for a project, we talk about the “minimally marketable features”—divisions within a backlog of functions the business wants that can be justified separately. These often define a series of major releases that will make up the overall project. Do the notions of business units and the separate billing systems combine in any way to suggest minimally marketable features to you?
CS: Let me think. What if the data mart allowed us to see what kind of customers downsized or disconnected by spend brackets and geographies for just the business marketing group in the eastern region? Yeah, that’d be worth paying for all on its own. We’ve got major slippage in that market. If we could slow revenue erosion there just by 20 or 30%, it’d probably pay for 50 of these projects.
PA: Super. Let’s try using the combination of business unit and billing system to define themes underneath this epic then. I’ve used the combination of business unit and region to define some themes on the backlog. (Table 5.2, items 2, 7, 9, 11, 13, and 15.) To reflect your priorities, I’ve placed all the themes for business marketing first and then consumer marketing. With each of those, I’ve ordered the themes by eastern, then central, and finally western regions. I’ll also add both those components to the business target model. (Object set 3.) What do you think? Do these two artifacts cover what you need?
CS: That’s going to work as far as this particular crisis goes. But there’s a ton of stuff we can learn once we have all the company’s revenue from the various billing systems in one place, prepped for analysis. We’ve got an old data mart now, the Corporate Management Reporting application, but it has only aggregated data. It only goes down to product group, not to the standardized product codes. And it has no customer information at all so we can never answer basic questions about who’s subscribing to what services, how long they stay with us, how much they spend, and where we should build out better service because we’ve got demand. Without answers to those questions, we can’t figure out what’s happening to revenue in any region.
PA: Those sound like good user stories. Let me add them to the stories on our backlog, underneath each theme (Items 3–6). Also you said standardized product codes. I maintain a set of “constraint cards” that help the team remember details. Let me create one here for that notion (Item 29). Now what about the fact that there’s two kinds of spend—monthly access fees versus per-unit charges for usage?
CS: We need them both. In general, falling monthly access reflects subscribers who disconnect a service as a whole. Falling per-unit usage charges reflect a decline for a customer using services they maintain an access subscription for.
PA: Let me note both access and usage charges on another constraint card (Item 30). I’ll also note that in the revenue box on the business target model. We’ll have to handle those two sets of metrics differently because one of them needs to link to activities.
Finance is upstream
PA: When we did our user role modeling session by phone last week, you mentioned we’d have some requirements from finance. What’s going to be the priority between corporate strategy’s needs and those of finance?
CS: Priority’s not the issue. Finance is upstream from us. They groom the revenue numbers and control the definition of products. They help the business units clean up their customer hierarchies. You folks in IT need to get those editing rules from finance if you’re going to get the fundamental data right. Otherwise corporate strategy will get some muddy results that won’t reconcile when we slice and dice the revenue numbers.
PA: Okay. I’m hearing that the project primary goals come from corporate strategy, but we’ve got to fulfill some objectives for finance first.
CS: Yeah, but you’ve got to get the corporate strategy analysts some info right away because the company is hemorrhaging subscribers and revenue.
PA: So, I’m hearing corporate strategy wants revenue by all customers, products, and locations with really clean data taken from all six billing systems put online in a hurry.
CS: Yes. We want it all, we want perfect, and we want it now.
CS: Because I’m serious. We can’t wait very long for these answers. We’re losing 10% of our subscribers per quarter in some major urban areas.
PA: Will you accept some compromises in order to get approximate answers sooner rather than later?
CS: It depends on the tradeoffs, I suppose.
PA: That’s what project architects like me are supposed to do—explain the choices and work with the business to identify a way to get to your end goal one a step at a time.
Finance categorizes source data
PA: Let’s find out from finance how his team contributes to the numbers you’re getting now. Franklin, your group is corporate strategy’s upstream data provider. They say IT needs to understand the manual adjustments you folks make for them so that we can duplicate that logic in the transformation code we’ll build.
Financial analysis (Franklin): I think that’s right. We add general ledger accounting to revenue data before it goes to corporate strategy. We spread quarterly charges out across months, which result in the difference between booked versus billed revenue. Also, probably most importantly for corporate strategy, we use reference tables to add several categorization schemes so that revenue from all the business units and regions can be consolidated into a single reporting set.
PA: I’m hearing you’ll need general ledger accounts on the business target model. They include the booked versus billed flags, don’t they? Let me add that (Object 4). What are the categorizations you just mentioned?
FA: There are three primary ones. We have reference tables for customer segmentation, product code standardization, and sales channel assignment. We manage all of them carefully because they control both of the major types of financial reporting we do. First, we report internally on the performance of business units and divisions. Executive compensation depends on those numbers, so everybody in management is watching every adjustment finance makes to the reference tables for these categories. The second is reporting to external parties, including the SEC, regulatory agencies, and Wall Street analysts. Erroneous changes to those reference tables will force us to later restate revenues and earnings, which leads to all kinds of dreaded audits and investigations.
Customer segmentation
PA: Sounds like our warehouse is going to have to provide an audit trail to every change made then.
FA: Yeah, but be careful—we don’t want all that history most of the time when it comes to customer segmentation. Segmentation categorizes “who” a customer is. It has labels such as “Young & Wireless,” “Suburban Spenders,” and “Mature Mid-Techs.” [Nielsen 2011] The segmentation reference table is populated by a special application we run against customer accounts. It uses several purchased data sets as inputs and considers each customer’s product mix and monthly spending patterns before assigning a result. The problem here is that the segment assigned to any given customer may change many times throughout the year as they alter their habits. We have over 150 million customer accounts, and when you multiply that by a resegmentation every month or two, the whole mess gets way too big to work with. For 99% of what we do with these data, we need either the current categorization or the one at the end of the prior accounting year. Everything else between those two points is just noise that slows down our analysis.
CS: But because corporate strategy will need those intermediate points for some of our research, please make it available for us as an option.
PA: I better write a constraint card for “Must make full history on customers optional” (Item 31). Also, because the customer segment sounds like it changes often, independent of other customer attributes, we should probably draw it as a separate notion from the customer dimensions on the business target model (Object 5).
Consolidated product hierarchies
FA: Product codes are different. We work with their history all the time. You probably know that we have a different product catalog for each billing system, with a lot of overlaps and contradictions between them. We consolidate these six product catalogs into a single reference table that represents the corporate rollup. We net out all the overlaps and add to the resulting product items an additional, standardized “product code.” We then categorize the product codes into a standard hierarchy with finance-created terms such as product class, group, and family. We also add a “countable unit” flag for the big-ticket items that should be included in unit counts for management performance reporting.
PA: Let me note that on the product bubble of the target model…“countable units.” (Part of object set 2.)
FA: Unfortunately for everyone, these products get realigned multiple times a year. The CEO and marketing decide some early adopter product families are now strategic products worth promoting like crazy or they declare some maturing products should be reclassified to be boring, old legacy products. Problem is, executives are tracking sales by product closely, and because every one of them picks a different reference point, finance needs to report numbers aligned to the product scheme that existed when they last took a reference snapshot, including the pattern of which products were strategic and which were legacy.
PA: I’m hearing that this warehouse must support more than just standardized product codes—it must provide data using the standardized coding scheme as of any arbitrary point in time. Let me add another constraint card for that (Item 32).
FA: Don’t forget that we need to send performance figures to the business units organized by their particular “alternative hierarchies” each one of them prefers.
PA: That sounds like it still pertains to products, which we have on the target model, but let me add another constraint card for “alternative hierarchies” (Item 33).
Sales channel
FA: Then there’s the reference table for sales channel. The channel tells you which part of our organization is responsible for the relationship with the customer. It determines which sales rep, regional director, and vice president gets dinged if revenue falls below a particular amount. We used to track the channel on customer records, but because the right channel assignment was getting changed with every regional reorganization, now we treat it as a notion independent of the customer identity. Plus, channel assignments for the business marketing group are determined by some really complicated rules that involve how big a customer company is, how they ordered their last product, and the mix of technology they’re using, plus the level of spend between products. For example, a U.S. company spending mostly on bulk minute plans will move to a particular channel if they start spending more on data, but a completely different channel if they merge with a multinational.
PA: Are the business rules consistent between the regions?
FA: Hardly. Because channel traces back to the organization, each business unit and region maintain their own rollup scheme, and of course those schemes change all the time, just to make life interesting for those of us in finance.
PA: Then I’ll write a constraint card for “Allow each business unit–region to have distinct channel rules” (Item 34). Because the channel sounds like it changes on a different schedule than either segment or customer attributes, we’ll include it as another separate item on the business target model (Object 6).
Unit reporting
PA: I noticed a minute ago you two mentioned performance reporting based on “countable units.” Units would be a new metric. Carla, why have you and I only been discussing revenue?
CS: We need countable-unit categorizations only to validate our data, like when we reconcile back to finance’s numbers or link our recommendations back to what the VPs are tracking. Unit counts themselves don’t correlate well enough with what customers spend to show us consumer behavior patterns, so we have to run our analysis upon revenue.
PA: Then it’s finance and execs that need to look at unit counts in addition to revenue. Units seem to be a distinct set of metrics and suggest a whole set of user stories that will parallel the stories for revenue. So, let’s create a new epic to serve as an umbrella for those stories (Item 23). Let me add “unit counts” to the target data model (Object 7). It will link up to the countable flag on product. If I look at the existing stories, “Who’s buying what?” seems like it could make sense for unit counts as well, so I’ll duplicate it under our new epic (Item 25). Franklin, finance is the party interested primarily in unit counts?
FA: That’s right. And that’s where we’ll need to flip back and forth between different time points: current or past business unit assignments for customers, plus current or past strategy/legacy indicators for product. We’ll also need to filter counts for countable unit indicators.
PA: Let me add user stories for those notions now (Items 26 through 28). Carla, what about the notion of “How long do subscribers stay with us?” Would you want to answer that using revenue or sale unit counts?
CS: I think that question would be better phrased in terms of billings, as in “How long do customers generate access revenue for us?” We will have to decide each time we do the analysis whether we should use min, max, or average length of service.
PA: And what about “Where we should build out better service because we’ve got demand?”
CS: That would be better worded as “Where do we have high revenue per user so that we know where we might need to upgrade the service?”
PA: Hmmm. I’ll have to reword a couple of the revenue stories (Items 4 and 6).
Geographies
PA: Franklin, what about geographies? Does finance modify or categorize reference tables for locations?
FA: No, but keep in mind the difference between billing address and service location. Consumer marketing analysts tend to speak in term of billing address, that is, people’s homes, because 95% or more of consumer cell phone usage is in their home markets. For business marketing, however, everything is tracked by service address, which is recorded in the revenue transactions as the location of the tower a call is originated upon. Billing address wouldn’t work for a lot of businesses because the data services for, say, 300 delivery vans west of the Mississippi might be all billed to their holding company in Virginia, telling us nothing about which portions of our network folks are using.
CS: And service location is not a postal address like a billing location. It’s a network location, which is defined by the equipment and circuits used to bring a signal to a particular termination point. It’s way more specific than the area code or the first three digits of a phone number would indicate.
FA: Postal addresses are handled fairly well by the revenue system, although there’s some duplicates due to slight variation in formatting such as “Str” or “St” for “street.” The service locations come from a feed from the network management group, and they’re kept very clean.
PA: Ooh, data quality. Sounds like I should write a constraint card reminding us that those postal addresses need to be scrubbed and standardized (Item 35). And now, we have two kinds of reference information for locations: service and billing. Because service location is structured differently than billing address, I’ll include them as separate dimensions on the business target model (Object set 8). I’ll have to replace that simple-mined geography object I put on there a while ago. Carla, is service location important for revenue analysis?
CS: Definitely. For the questions we have about falling revenue on big data events, we’ll need service location to show us where customers are getting frustrated with their service.
Product usage
PA: I’m hearing another epic at work in what you just said. Up until now we’ve been talking about identifying who has disconnected or downsized. You’ve envisioned identifying these folks by drilling into the counts of services and the amount customers spend. But when you talk about where big data events occur, I hear you wanting to analyze data volumes and durations, not unit counts and spend.
CS: That’s right. The overall objective for my part of the project is to figure out what’s frustrating our customers so that we can change our product bundling and pricing, and even adjust areas of our network capacity. For that latter topic, we’ll have to focus on the activity of “big data users,” where usage is measured in minutes of use and/or megabytes of data transferred. All of it is available from revenue data because we detail the usage they were charged for on every bill we send them.
PA: Then I would suggest a new epic revolving around measures of usage. Could you take a stab at putting it into a user story format for me?
CS: Oh, how about “As corporate strategy, we need to identify frustrating customer episodes that lead to service downgrades so that we can better design our offerings and networks in order to reverse the revenue loss we’re experiencing.”
PA: That’s definitely sounds big, like an epic. Let me add that to our story list (Item 17). Now envision that IT has enabled you to do exactly that. You’ve sat down in front of the dashboard we’ve provided. What are the questions you’re going to try to answer?
CS: We’ve already been working on them: Which “large data users” have downsized their service significantly? What’s the profile of the large data events they undertook in the 3 months before they downsized? What’s the typical product and location that these events occurred in?
PA: Those sound like user stories. Let me add them now—feel free to correct the way I word the “so that” motivations I’m recording (Items 19 through 22). Now is the information available for each business unit and billing system different enough that you think we should work on each combination separately, like in the revenue epics?
PA: That gives us some “themes” to place in between the epic and user stories you just articulated. Let me update our story list (Item 18). Also, the epic for usage measures is lower in priority than those for revenue, but higher than the unit counts that finance is waiting for?
PA: I should add usage measures to our business target model too (Object 9). With all that, do you think we’ve covered all the major information that your two departments will need to explore using this dashboard?
CS: I’m sure there’s hundreds more user stories possible because revenue and usage information is central to so many of the questions we get asked every month. But you’ve captured all the basic building blocks that we need to work with. If there’s something we’ve overlooked, it will be minor.
FA: Yes, if finance could access a dashboard matching the business target model you’ve drawn we’ll cut in half the time we hassle with reconciliations every month.
PA: Well, then we’ve got our initial backlog. We can move on to the next step in project planning.
Observations regarding initial backlog sessions
Knowing when an initial backlog is “complete enough” will be a judgment call requiring consensus between both the architect and stakeholders. As long as it covers the major measures of interest and fully enumerates the qualifiers the business partners want to analyze them by, the early project team can be reasonably assured that no earth-shaking requirements have been overlooked. Moreover, if a major user need has been overlooked, the product owner and stakeholders will be more likely to think of it by working with the team and reviewing application increments than reviewing paper listings of requirements.
Sessions such as the one in the aforementioned transcript generate exactly the sizable list of functional requirements that IT needs to begin high-level design, including logical models for the target data structures. As the project progresses, the team leads, including the project architect, will meet with the product owner on many occasions. Because those sessions will occur after the project has officially started, the team’s systems analyst and data architect will also attend. Their presence will allow further discussions of requirements to occur iteratively with elements of architecture and design included.
The project architect conducts an initial backlog interview just to get the project defined well enough to secure funding and engage a fuller team. The next step toward that end will be to convert some or all of the initial backlog into actionable “developers stories.” Developer stories result when agile warehousing teams decompose user stories one step further to address the major components of their data architecture. The next chapter examines that decomposition process. To close this chapter, we should take a moment to identify the major lessons for agile warehousing practitioners detectable in this transcript initial backlog interview.
Sometimes a lengthy process
These conversations can be long, sometimes requiring many days, depending on the breadth of the business problem and the number of subject matter experts who must participate.
Note that the project architect is critical to this process and that she is up against a stiff challenge. Much of her facilitation is spent trying to find the right balance between detail and speed. She must elicit enough detail to define, constrain, and scope the project. Some discussion of details will be necessary to achieve that purpose, but these sessions can easily get mired in discussions of business process details, such as information life cycles and data transformation rules. If the project architect allowed the initial backlog interview to indulge in excessive detail, the process would steer back to a waterfall-style requirements-gathering process, the project would have a delayed start, and the business value of the application would be diminished greatly by the time users received its services.
To keep the interview short, it works best to keep the conversation in business language as much as possible, replacing talk of fact and dimension tables with the notions of measures and qualifiers that will be used to analyze them. In our example, the project architect refrained from identifying measures as slowly changing Type 1, 2, or 3 because those are design details rather than requirements. The project architect does have a powerful tool, however, to bring an unfruitful discussion to an end: She can ask “Do the details we’re discussing now help define an epic, theme, user story, or another element to place on the business target model?” If not, the team should record the topic on a constraint card and move on. The team can return to that topic when it comes time to build out a story that is affected by the constraint.
Yet the process cannot be overly abbreviated if the project is going to have a cohesive backlog at its center. The project architect will have to use her judgment as to when the backlog is sufficiently complete. She may have to insist that the conversation continue, bucking pressure to “wrap it up” coming from both the business and IT management side.
The initial interview may well require more than the project’s product owner. In our example, corporate strategy did not understand all the ways that finance preprocessed the information and was dismissive of the requirements that pertained only to that other department. Sufficient representation of all key stakeholders will be essential. Here too, the project architect must use judgment to simultaneously include all relevant parties participating in the conversation, yet keep the group as small as possible so that the process does not take too long.
One challenge to keeping these interviews moving can be discussions of the source system. Subject matter experts can have a tremendous amount of detail to share about the business systems they’ve worked with over the years, especially older mainframe applications. Discussions of source details are necessary, but the architect can abbreviate them somewhat by focusing the conversation on whether a particular application’s data has value or not. Value here is best defined as contributing to a metric or dimension on the business target model. If a source has value, but is complicated, a constraint card stating that the source must be researched further will suffice. This alternative is especially handy during initial backlog interviews when the systems analyst who can profile data has not yet joined the team.
Sources are often difficult to understand. Thus when the usability of certain data sets cannot be answered immediately, the team may have to adjourn so research can be done. Perhaps the developers will need to declare a Scrum “spike” and take a week to learn about a data source in depth. Staffing projects with a project architect who knows the company’s data sources, however, will give the team a resource that will keep the need for such research adjournments to a minimum.
Detecting backlog components
As can be seen from the sample interview, subject matter experts can generate a tremendous amount of detail. The project architect has to listen carefully during these interviews because new stories, objects, and business target model components can get lost in the flood of concepts when SMEs talk intently about solving their business problems. Recordings and transcriptions of these interviews help tremendously because too much goes by too fast to capture it all by hand the first time. The architect must be able to review the discussion again later because subtle choices of wording can suggest whole new facts, dimensions, and stakeholders.
Given the flood of information, the project architect will need some good criteria in order to categorize user requests as epics, themes, or stories. Figure 5.5 presents some notions that might help. It includes a reference to the developer stories presented in the next chapter. Epics tend to be linked to categories of metrics. Placing analytics for these metrics online usually takes one or more releases. In our sample project, the epics were metrics that revolved about very different concepts: revenue versus unit counts versus “frustrated customers.”
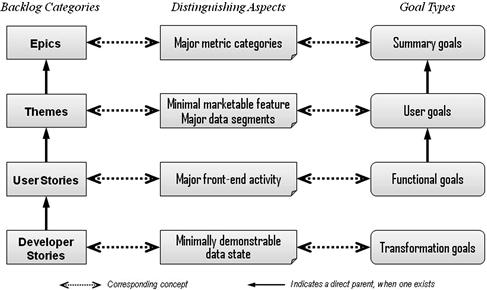
Figure 5.5 General functions of backlog items in data integration projects.
Themes tend to describe a “minimally marketable feature”—something that may not be a total set of metrics or a business solution on its own, but still a feature that has enough value to warrant a product release. These minimal marketable features can often be found where envision target data will differentiate most readily. With data integration projects, the key question to ask product owners for identifying themes is often: “If we put a given set of information online, what business value could it have all on its own? Can it represent a complete and independently appreciable step toward the larger goal?”
In our example, the consumer and business marketing groups had widely different types of commerce, and within the groups, each regional billing system represented a separate set of accounting books. These source-based divisions made the metrics within each intersection of business group and region separately understandable. In fact, the business had a compelling reason to regularly examine at each such division in isolation from the rest. Such data isolation boundaries frequently make good boundaries between themes.
Finally, user stories for data integration projects are often detectable when stakeholders begin discussing what they will do with a dashboard once the data set for a given theme is in place online. Note that the user stories produced during these interviews do not have to be perfect because the team will get at least three other chances to consider each story. The first will occur immediately after the initial backlog interview when the data architect joins the early team in order to convert user stories into developer stories and developer stories into a data model. The second chance will be when the team leads and product owner groom the top of the backlog before each story conference. The third will be the story conference with the full team at the start of each construction sprint.
Knowing that the stories will be revisited substantially as the project proceeds, the project architect can be a bit more comfortable limiting excessively detailed discussion during the initial product backlog interviews. Again, the goal of the initial backlog session is only to verbalize epics, themes, and stories with enough detail to generally define, constrain, and scope the project.
Managing user story components on the backlog
The full, three-part format of a user story can be sometimes awkward to manage when working with many stories at once. When authoring user stories, business partners can focus on a given business problem and a given user role for a considerable time while they envision how that person will solve his problem. This mind-set places the focus on the “what” of the stories and leaves the “who” and “why” fairly static for long portions of the conversation. Business users can forget that those two components belong in every story, so the architect will have to occasionally probe for whether the product owner has moved on to a different role or business problem without mentioning it.
Because “who” and “why” can be static for long stretches on the backlog, the project architect will need a shorthand for writing user stories on a spreadsheet or other listing that can highlight the “what” that is changing. The backlog listing from our sample project has such elements. It sets up the “who” at the epic level and uses ellipses to connect it to the “what” portion of the user stories below. Similarly, ellipses on the “whats” can connect them to a “why” clause at the end of a section for an epic or theme. Establishing some system of shorthand for user stories before the initial backlog interview will be important to keeping the resulting listing uncluttered.
Prioritizing stories
A major responsibility of the project architect is to not only decompose this monolithic request into separately appreciable deliverables, but must also get the product owner to express a preference for their ordering. Many customers will insist that they want all data from the source systems, perfectly integrated, in a few short weeks. Such an attitude can be very hard to reverse and, if left uncorrected, will paralyze the development sprints. Accordingly, project architects must get product owners to start thinking about breaking the project into small pieces and prioritizing them, even as early as the initial backlog sessions.
The easiest technique for getting product owners to begin prioritizing is to uncover dependencies between the data components. The project architect can ask, for example, what reference codes and category adjustments occur upstream of usable information. This helps the product owner become more realistic because no one can argue that dependencies do not trump preferences. If the project does involve source-based divisions within the metrics, as discussed earlier, identifying the themes with those divisions will position them as another readily understandable place to segment the project for prioritization.
Prioritizing at epic and theme levels is usually sufficient to get the project framed properly. Many stories often stay contained within themes, and these can be prioritized in small batches as the development work for a given theme approaches. In this way, the product owner needs only to worry about general ordering down to the theme level and detailed ordering for only the theme at the top of the backlog.
Those situations where the product owner insists that two or more epics are equally crucial often signify that the project is bigger than one Scrum team can manage and that there may be a business case for acquiring more development resources.
Unfortunately, all notions of how difficult the individual epics and themes will be to deliver cannot be removed entirely from the initial backlog conversation. Product owners will be confronted with prioritizing between some themes that will be fast to deliver but not as valuable as other items that will take longer to build. The project architect role in these dilemmas will be to provide a notion of fast or slow to complement the product owner’s notion of valuable or not. She must also be persistent on getting a priority decision from the product owner in these situations because one team will find it impossible to deliver two big themes at once.
Summary
An initial project backlog of user stories is essential to getting an agile warehousing project started. The stories on this list should come from the product owner and sometimes a couple of other key user groups. Because the backlog allows project estimation, and estimation in turn supports project funding, these stories often have to be gathered before Iteration 0 of the sprint and before the full team is assigned. A project architect is a good choice for leading this preproject effort. He should declare an Iteration −1 to create the time to gather the initial project backlog. In addition to that backlog, the architect will also want to derive from the initial interviews a business target model of the fact and dimensional entities needed to solve the product owner’s analytical problem. This model will later support the work of the data architect and systems analyst during the project’s Iteration 0. The business target model and the initial project backlog will evolve as the initial conversation with the product owner progresses. In order to keep the initial backlog interviews to a reasonable length, the project architect will need to employ several techniques for recording information quickly and deferring debate over nonessential details, which can be resolved later during the development iterations.