
Chapter 6
Developer Stories for Data Integration
Why are user stories too coarse for planning data integration projects?
What techniques can we use to discover our project’s “developer stories?”
How can we tell if we have a good developer story?
After amassing an initial project backlog of user stories, as presented in the prior chapter, data warehousing teams with a significant amount of data integration work will still not have a list of work items that fit nicely into the small time-boxed development iterations of Scrum. One further level of decomposition between Scrum’s user story and development tasks is necessary. Calling this intermediate requirements device a “developer story” indicates its conceptual position halfway between a user story and a developer’s work unit. Data integration teams that create developer stories by intersecting each user story with the data warehouse’s high-level architecture will transform their user story backlogs into project backlogs that the product owner can still understand and that the developers can also schedule and delivery iteratively.
Data integration teams that employ developers stories will need to evolve their standard story evaluation approach to one that incorporates the data warehouse’s data architecture. This evolution will transform the INVEST test for user stories into demonstrable, independent, layered, business valuable, estimatable, refinable, testable, and small—a combination known as DILBERT’S test—for data integration developer stories. For any candidate developer story that proves to be too large, there are several secondary techniques for decomposing them one step further. At the conclusion of this decomposition process, the team will have a project backlog of developer stories they can estimate and then assemble into an agile project plan, a process that is described in the next chapter. The techniques employed for defining the initial project backlog of developer stories can also be employed during the development iterations to transform any new or altered user stories from the product owner into actionable work items for the developers.
Why developer stories are needed
As defined in earlier chapters, user stories identify small pieces of the business requirements that, among other attributes, can be delivered within one iteration. Data warehousing projects that focus on building end-user dashboards find it easy to define user stories because (a) today’s business intelligence (BI) tools allow developers to make big changes to a dashboard’s functionality with relatively small effort and (b) even small changes on the dashboard change the way the business can see its operational circumstance, so delivering business value is a straightforward process.
Teams working data integration projects do not find delivering business-appreciable value so easy, however. Figure 6.1 suggests the fundamental challenge they face. The main user story depicted in this example was simple to express, as shown in the sidebar. An abbreviated logical model of the star schema required to fulfill this user story is shown at the bottom of the diagram. Major deliverables needed to populate or to provide end-user access to the data elements in that logical model are shown above as a series of work units leading to the delivery of each logical data component. Shaded deliverables can be thought of “load modules,” which include not only a component of transformation code, but also the target data structures and—if the tables are already loaded—the data they contain. In this example, the load modules associated with each logical table (a) extract data from various sources into a staging area, (b) integrate data from multiple sources into a normalized set of tables holding a coherent notion of each business entity, and (c) denormalize data into a dimensional model. Each data target, especially the central revenue fact table, will also require some dashboarding to allow users to analyze the information it contains.
Sample User Story Employed for This Chapter
“As an analyst in finance, I want to decompose monthly revenue figures by customer and product so that I can identify the key drivers of our revenue changes.”
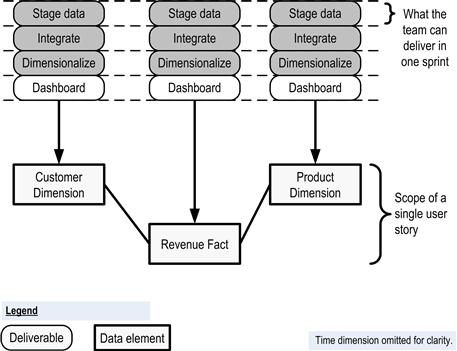
Figure 6.1 Most data integration stories cannot be delivered with only one sprint.
Dashed lines in the diagram indicate roughly the functionality that the development team can complete with each iteration. Whereas it will take 12 deliverables to provide the target data objects required by the user story, the team can complete only 3 such deliverables per iteration. If the user story listed previously represents the smallest notion of an acceptable end product for business users, this development team will be unable to deliver a business value for end users with every iteration of their project. The product owner will have no user story to review during the user demo until the end of the fourth sprint. Making the customer wait for four sprints for a deliverable does meet the agile principle of delivering working software frequently. The business will not perceive that it is constantly receiving value from the development team. Moreover, waiting so long for a review will deny the team the feedback it needs to stay aligned with the business needs it is supposed to fulfill.
Nor can a team simply switch to organizing its work in terms of the developer tasks that Scrum uses as the next level decomposition for user stories. Developer tasks are the small technical work items needed to deliver a user story. They represent small objectives, such as “update the physical data model,” “code an initial load module,” and “write supporting shell scripts.” If the developers tried to present developer tasks as deliverables during the sprint demos, the business-minded product owner would not be able to comprehend much of what he was reviewing or understand how it contributes to the analytical services requested for the end users.
Some data warehousing professionals believe the situation depicted in Figure 6.1 makes agile methods a poor choice for business intelligence products. Another camp, including the author of this book, believes that the situation requires only a small change in the way teams employ user stories and the product owner’s expectations. The small change needed regarding user stories is to decompose them one step further and to use the work units resulting from that breakdown for identifying and scheduling the labor to be bundled into development iterations. These new work units will be intermediate deliverables, not yet demonstrable to the project’s full community of stakeholders. The product owner, then, needs to modify slightly the acceptance criteria he follows during the sprint demos so that instead of looking for system enhancements that can each be placed directly into production, he will also accept deliverables that represent major steps toward finished components for end users. With those two small adjustments, data warehousing teams will be able to continue with an agile approach based on iterative delivery and high customer involvement. Both developers and the product owner of a team naturally want to keep the number of intermediate steps required to as small a number as possible—perhaps just a few per user story—so the right level of abstraction for this intermediate container would be something close to the deliverables identified in Figure 6.1.
Introducing the “developer story”
Given that users stories are too large for data integration teams to deliver in single sprints and that developer tasks are an unworkable substitute, agile data warehousing practitioners require an intermediary work container called a “developer story.” In data integration projects, a developer story is a unit of work that (a) can be accomplished in a single sprint, (b) represents a major step toward delivering a user story, and (c) is still understandable by the product owner.
Developer stories are called “stories” because each is linked closely to a user story and is also expressed in a single sentence that the product owner can comprehend. Unlike user stories, however, developer stories are authored by the developers, not the product owner. Most often, the developers write these developer stories to describe an important step that data of a warehouse or data mart take in its journey from operational source system to the end-user’s analytical dashboard. This orientation was visible in Figure 6.1, which, for each target data object, has information moving from source system to a staging area, then into an integration area, next into a dimensional model, and finally into a dashboard. By writing developer stories as steps in data’s journey to the end-user’s application, developers remain just barely understandable to the product owner. By providing a simple roadmap for that journey, such as shown in Figure 6.1, the team will enable the product owner to follow along as data move steadily forward. Of course, a small amount of orientation for the product owner covering the macro architecture of a data warehouse may be required at first to make such roadmaps meaningful.
At the conclusion of each iteration, the team can provide a window onto data as it is now stored at a given waypoint along that roadmap. Such a window allows the product owner to review the information and accept or reject the developer story based on the data quality the team has achieved. With both a graphic roadmap of data’s journey toward the dashboard and a view of the information at each step along the way, developer stories become largely intelligible to the product owner in a way that completely technical developer tasks are not. By representing progress toward an end-user goal, the completed developer story will then represent a tangible amount of business value to the product owner, allowing him to feel that he is constantly receiving value from the development team. The developer stories are still reviewed by the product owner at the end of each iteration so that the team continues to get the feedback it needs to stay aligned with the business. With the product owner still involved closely with the team and the team still delivering incrementally, developer stories allow data integration projects to be pursued with an agile approach.
Format of the developer story
As described in Chapter 2, the format for a user story is
As {a particular user role in the enterprise}…
…I want to be able to {perform this function with the application}…
Agile data integration teams should follow a similar template for developer stories in order to keep them consistent. A starting template for developer stories would be as shown in the following table. Teams with differing degrees and types of data integration work may well evolve the actual template they use.
| Developer Story Component | Approximate Clause in User Story Template |
| This {this particular data load module}, | “who” |
| will receive {this new set of features}, | “what” |
| so our product owner can validate data loaded into {this target table(s)}, which further completes {this particular user story}. | “why” |
The following list provides an example of a developer story from every level of data transform shown in Figure 6.1. These developer stories depict data flowing between the waypoints along the path laid out for product dimension data. Components from the template are set apart using braces. The user story for this sample developer story is abbreviated somewhat to save repetition.
“The {Stage Product Data} module will receive {the ability to detect and load only changed records} so our product owner can validate {that the warehouse is capturing the product records just added or changed in the operational system}, which further completes the {‘…decompose monthly revenue figures by customer and product…’ user story.}”
“The {Integrate Product Data} module will receive {the ability to include the western region’s product catalog for strategic products} so our product owner can validate the {company-consolidated view of all strategic products}, which further completes the {‘…decompose monthly revenue figures…’ user story.}”
“The {Dimensionalize Revenue Fact} module will receive {the ability link in products records} so our product owner can validate {revenue data by product in addition to customer}, which further completes the {‘…monthly revenue…’ user story.}”
“Our end-user application’s {Product Dimension Dashboard} components will receive {a new strategic/legacy product flag in its query definition screens} so our product owner can validate the {sales orders for the newly added strategic product catalogs}, which should complete our ‘…monthly revenue…’ user story.}”
Two aspects of this template make developer stories easier for the product owner to understand. First, each developer story links to a parent user story that the product owner himself authored for the developers. Second, he directly perceives some value for the business by reviewing the impact on data in a target data object. That value may only be one small step in a chain, but in each review data are meaningful as a component of a larger collection that the end users have requested.
Developer stories in the agile requirements management scheme
Developer stories add just one level more of detail below a user story so that when data integration is required, developers will have the requirements expressed in single sentences granular enough to encompass no more work than will fit within a sprint. When data integration is required and the team authors that work with developer stories, it is developer stories rather than user stories that get added to the project backlog and then enter into the development iterations. With the entire data integration work of a project expressed at that level, the team will have the atomic components needed to estimate the level of effort of a given user story properly and also to organize the project’s work into separate iterations and releases.
Figure 6.2 provides a good summary view of where developer stories fit into the full stack of project definition objects that agile data warehousing/business intelligence (DWBI) efforts involve. Working top down, lines 1 through 3, which break portfolios into programs and projects, represent concepts originating outside of Scrum, usually defined by the corporation’s program management office. Lines 4 through 6, which break epics into themes and user stories, are defined by Scrum, as is the development task in line 8. The developer story fits in between the user story and the development task and, for data warehousing, is only needed for the data integration work of a project.
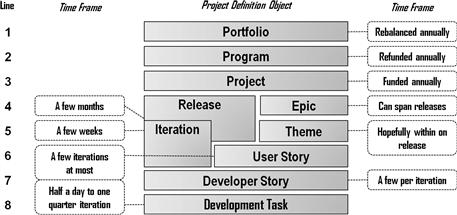
Figure 6.2 Hierarchy for agile project definition objects for data integration work.
Stacking depicted in the diagram is only a baseline, and not as absolute as Figure 6.2 might imply. For example, some teams allow themes to cross epics and releases, where other teams create repeated instances of a given theme so that each instance links only to one epic, as shown in this diagram. Note also that the developer story is now the object directly subordinate to iterations. Because it may take several iterations to deliver all the developer stories that make up a user story, user stories themselves are no longer required to fit within iterations. Most agile warehousing practitioners will still try to bundle complete user stories within a single release, however. For those portions of the project that do not require data integration, the developer story can be removed from this stack and user stories can once again be packaged within the iterations.
Agile purists do not like developer stories
Agile practitioners from the world of generic application development often look askance at the notion of developer stories. The major objection they have to the notion is that it provides intermediate results that only the product owner can appreciate. It fails to place new business value online with each iteration, choosing to make two or more small steps forward before any result can be examined in the end-users’ applications. The fact that a product owner can understand how several developer stories add up to a delivered user story is not sufficient because product owners cannot employ a developer story to solve real business challenges the way they can with the deliverables defined by user stories. Any feedback the product owner might provide will be theoretical and may well be missing important perspectives that only the wider user community can provide. These agile practitioners would instruct warehousing teams to simply divide up the work into smaller and smaller vertical slices until they identify slices so small that a warehouse team can go all the way from operational source to analytical dashboard in one iteration.
Whenever such a vertical slice of the warehouse can be defined, teams should certainly endeavor to deliver that slice because that path is completely faithful to the agile approach and will accrue all the benefits that incremental delivery to end users provides. This chapter will in fact describe some techniques for defining such small, vertical slices when we discuss secondary techniques for defining developer stories. However, as can be seen from Figure 6.1, there is a limit to how narrowly a team can define a vertical slice and still have it make sense. Say that revenue facts proved too hard to deliver in one iteration because they need a complex business rule for spreading annual payments from corporate customers across the accounting months. Also, assume that the product dimension required complex data integration of the company’s six product catalogs that it would take more than an iteration just to load a single series of surrogate keys for that dimension.
Following the generic agile advice to simply make stories smaller until they fit into a single iteration might lead the developers working this project to propose a user story that omits the product dimension altogether and only delivers counts of revenue transactions by customer. They do not offer revenue amounts or product identifiers because those will take longer than an iteration to deliver. In all likelihood, revenue transaction counts by a customer will not be a compelling user story for the product owner because it reflects how many billings a customer has received, an insight without any compelling business value. This type of situation is very common in data integration projects, making developers stories—as a halfway point between user stories and developer tasks—absolutely necessary.
Initial developer story workshops
The need for developer stories on projects involving data integration (assumed hereon in this chapter) creates two important differences for starting warehousing projects from how generic agile development projects begin: the project will need a developer story workshop and it must add a data architect and a systems analyst to the lead-off team.
With developer stories becoming the atomic requirements management vehicle for a Scrum team when data integration is required, they join nonintegration user stories in comprising the project backlog. Consequently, developer stories make up an important portion of the predevelopment work included in many company’s project release cycles. Referring back to Figure 5.1, the initial project backlog that the product architect and product owner compiled during Iteration −1 consists entirely of user stories, however. Authoring the full set of developer stories and then estimating the project based on that work will have to take place during an initial developer story workshop, which occurs in the latter portion of the inception phase of the release cycle, during Iteration 0.
Because developer stories link user stories to the major steps data take as it flows toward the end-user dashboards, the team will need to know the warehouse’s high-level data and processing architecture in order to translate the project backlog into actionable developer stories. The architectures will not be defined until the data architecture and systems analyst joins the team, so these teammates will be essential for the initial developer story workshop.
The role of the data architect is the easiest to understand. As can be inferred easily from the hypothetical project portrayed in Figure 6.1, teams will need to consider their project’s macro data architecture in order to convert user stories involving data integration into developer stories. The lead-off team working to define the project will need a data architect to join the effort because only he can state the exact layers of data schemas the warehouse will comprise.
The systems analyst, too, will be necessary for defining the initial set of developer stories. Interpreting user stories in terms of the project’s macro data architecture is often only a first step. The secondary techniques require knowledge of the business rules. Typically, understanding the details and specifying the transforms for a warehouse’s business rules are assigned to a role called the systems analysts. Accordingly, the project’s systems analyst will need to join the lead-off team during Iteration 0 as well so that the developer stories do not have to be redesignated later to account for business rules.
Figure 6.3 portrays the overall process of defining work units for an agile data warehousing project. The activity of the developer story workshops is shown in the middle. The product owner and project architect work to refine the collection of user stories coming out of the initial project backlog interviews. The data architect considers each story, using the project’s macro data architecture to generate a collection of candidate developer stories comparable to those shown feeding the target objects in Figure 6.1. At that point the systems analyst can inquire with the product owner and project architect regarding the business rules the user story will involve. If significant, he can suggest to the data architect where some of the candidate developer stories will probably have to be split into two or more developer stories. Each of these resulting developer stories will still be demonstrable using newly transformed data. They may just pertain to different sets of columns that each hold the results of a different set of business rules. Because the resulting data can be inspected, the business rule- specific developer stories will still provide some notion of business value for the product owner, as required by the developer story template.
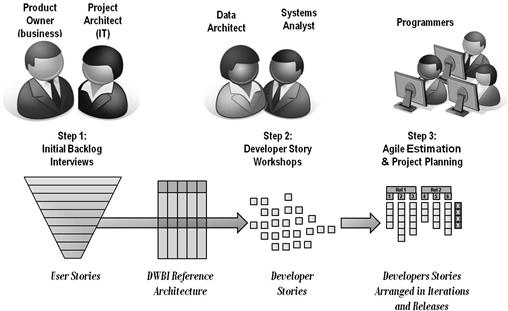
Figure 6.3 Defining work units for an agile data warehousing project.
Once the project has been decomposed into a large number of developer stories, the product owner and project architect can prioritize them. The project owner will use the business value for an initial priority order. The project architect will provide guidance on sequencing them according to dependencies, such as the need to build out dimension tables before fact tables can be populated. He will also recommend which developer stories to elevate in the schedule in order to address any major risks facing the project.
In order to provide an initial estimate of project cost and duration, the lead-off team can involve the likely developers for the project in estimating the developer stories using story points. By hazarding a guess at the developer’s velocity, the lead-off team can also assemble the developer stories into iteration-sized chunks, as shown on the right side of Figure 6.3. Such packaging will provide a count of iterations and thus a good notion of how many weeks and dollars are needed to complete the elaboration and construction phases of the release. If the velocity employed for this analysis is taken from the actual performance of an existing team, and hopefully from the team that will be assigned to the project being planned, then this labor forecast will be reasonably reliable. If a new team will be formed for the project, then the lead-off team needs to label this forecast as highly speculative. In either case, once development begins, the team should measure its velocity with each iteration and update the project estimate. Estimating the project will be examined in greater detail in the next chapter.
Developers workshop within software engineering cycles
Because developer stories begin linking data structures to the data transformation processes that populate them, senior IT professionals will want to understand where developer stories fit within the enterprise architecture planning processes software engineers like to employ. Table 6.1 presents such a process, one borrowed heavily from the Zachman framework but with elements from the domain of data warehousing clearly added as subrows for each architectural viewpoint. Standard enterprise architectural planning requires that developers analyze and plan in a particular sequence: business modeling, next data architectures, and then functional application architectures. It also stipulates that conceptual thinking precedes logical modeling, which in turn should come before physical modeling. [Spewak 1993] This ordering safeguards that the data designs of applications will support all relevant business entities within the corporation accurately and consistently. This ordering also ensures the many applications that will comprise the organization’s processing capabilities across the decades will all support a single concept of company’s data, avoiding any conflicts between the representation of information that could make a single, enterprise-wide interpretation of data impossible.
Table 6.1 Developer Story Process Derivation Set in a Zachman Frameworka
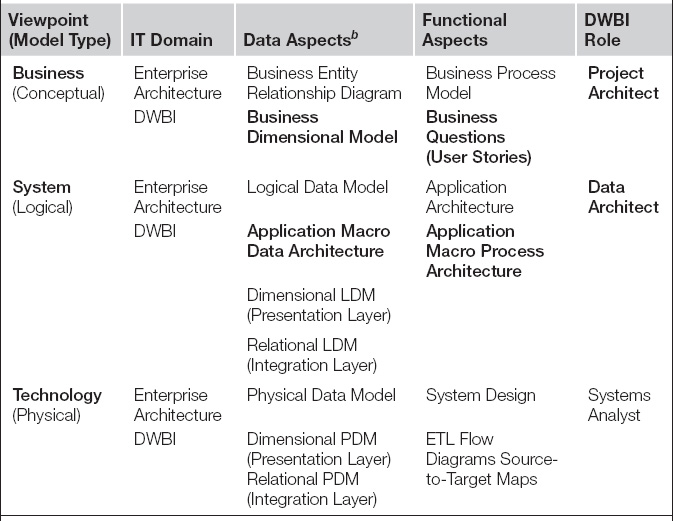
aAdapted for data warehousing from [Zachman 2011], versions 1992 and 1993.
bLDM, logical data model; PDM, physical data model.
The predevelopment collaboration described among the product owner, project architect, data architect, and systems analyst follows the recommended ordering of development steps. During the initial project backlog interviews, the project architect accumulated a list of user stories and a business dimensional model. These artifacts both belong to the business architectural point of view and represent the functional and data portions of this viewpoint, as highlighted by the shading in Table 6.1. The fact that the business dimensional model and user stories were derived iteratively during the same set of interviews is immaterial to the framework and is, in fact, optimal from a pragmatic point of view in that it saves time and allows each artifact to double-check the findings recorded in the other.
With the initial project backlog interviews accomplished, the project architect involves the data architect to translate the user stories into developer stories. Reflecting upon the user stories and the application’s likely source data, the data architect drafts the project’s macro data architecture. He may also at the same time begin sketching a logical data model of the application. This work falls clearly in the logical modeling viewpoint of the enterprise planning framework and occurs after conceptual considerations, as preferred. The lead-off team also includes the systems analyst, who is asked to reflect upon whether business rules processing require that a developer stories be decomposed further. That analysis still takes place within the logical viewpoint, but represents a functional portion of the system model so that processing architecture follows data architecture as the framework requires. The fact that, during the developer story workshop, the data architect and the systems analyst may iterate between themselves—or even with the project architect and product owner—as they interpret developer stories is again immaterial to the framework and advantageous as far as the quality of the results matter.
Data warehousing/business intelligence reference data architecture
Developer stories depend extensively on the macro data architecture that the data architect provides to the project. He may be the final word on the direction of this high-level design, but he does not start with a blank slate. Industry norms and even design standards set down by the enterprise architecture group within his company will provide 80% or more of the architecture he will recommend. Although the macro data architectures vary somewhat between companies, all of them are easily recognizable by DWBI professionals, so much so that data warehousing practitioners refer to the typical pattern they follow as a “data warehousing reference architecture.” Because reference architecture is required for the first step in defining developer stories, a presentation of a baseline DWBI reference data architecture will facilitate the remaining discussion of this chapter.
The left half of Table 6.2 shows a fairly basic DWBI reference architecture. Data typically progress from top to bottom through the architectural layers represented in this diagram. This reference architecture should not be interpreted as a full-fledged data architecture. A complete data architecture specified how enterprise data will be managed within a single, organization-wide approach. It includes design guidances such as a formal naming standard, comprehensive data definitions, reusable data schemas, and physical data structures, plus precise data integrity rules. In contract, a DWBI reference data architecture specifies only the “layers” that exist within the data warehouse.
Table 6.2 Typical DWBI Reference Data Architecture: Basic and Extended
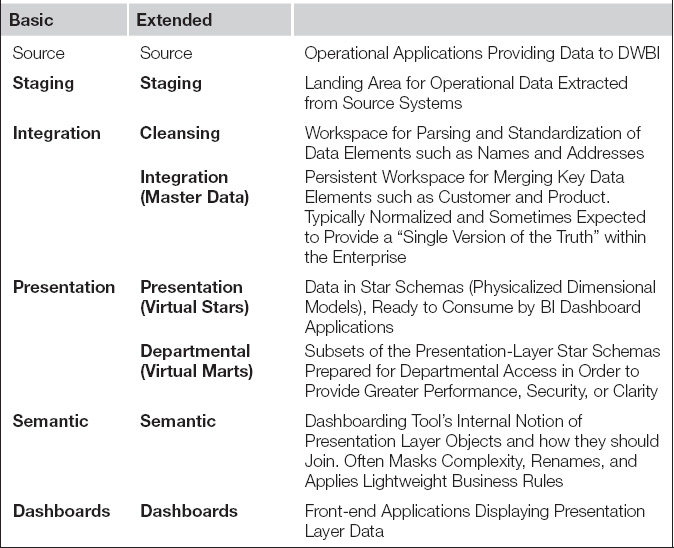
Each layer within the DWBI reference architecture represents physical data schemas that follow a logical and/or physical modeling paradigm specific to each layer. The staging layer’s intent is to make source application data available for transformation. Accordingly, the physical model of the staging layer schemas matches closely that of the source, operational systems, although some provision may exist for meta data as well as before and after images for source records (which would make the element of the reference architecture a persistent staging layer). The integration layer provides a persistent workspace for merging comparable data from many source systems. Data architects typically employ a highly normalized modeling paradigm for this layer because it ensures that data supposed to be unique cannot be duplicated. The presentation layer holds data consumable by the business intelligence applications and typically takes a dimensional logical model and a star schema in its physical design, which holds extensively denormalized data. The semantic layer is a collection of join definitions the dashboards require to pull data from the presentation layer. They take whatever form the maker of the BI tool devises, but they typically look like relational models to the designers. Finally, dashboards may contain data structures of their own in order to speed up end-user application performance; often these are memory-resident dimensional data stores that many people refer to as “data cubes.”
The right column of Table 6.1 depicts a few common variations on the DWBI reference architecture. The integration layer often includes tables populated with the company’s master data elements, such as customer, products, staff members, vendors, and locations. So that the data structures that end-user applications draw upon can be created and adapted quickly, the presentation layer may be comprised all or in part of run-time only “virtual star schemas” that have no persistent physical aspect. For performance, maintenance, and security reasons, presentation layers are also commonly subsetted into departmentally specific data sets that the BI applications of the end users selectively draw information from.
The layers of the reference architecture make it easy to explain exactly why it takes special adaptations such as developer stories to make agile methods work for data integration projects. To deliver even a single element from source to dashboard requires the data integration team to build not just the dashboard, but also data structures and transform components for the four to six layers of data that must exist behind the dashboard. Delivering a dashboard element is like trying to build four or more integrated applications at once. It is often too much to accomplish in a few short weeks without resorting to a subdeliverable such as developer stories.
Forming backlogs with developer stories
A baseline DWBI reference architecture empowers a data architect and the rest of the lead-off team to easily translate user stories into a starter set of developer stories. The initial developer workshop results in a high-level data flow diagram for the project. An example of such a diagram is provided by Figure 6.4, which shows results for the sample user story we opened the chapter with. These data flow diagrams are planning artifacts for the team, meant solely to enable the participants to identify developer stories. Therefore they are drawn schematically to communicate the probable organization of the team’s labor rather than in detail as they would be drawn if they were truly design diagrams. When the data architect drafts such a diagram, he is typically working at an aggregate, logical level of abstraction, where each box may represent one or several closely related data objects. He will decide in later design work whether each data object on this diagram translates into one or more physical tables. Fortunately, for an agile approach that prefers to operate with as much just-in-time requirements and design as possible, these schematic data flow diagrams often provide enough guidance that detailed design does not need to take place until the iteration in which each of the objects shown in this diagram will be constructed.

Figure 6.4 Developer stories derived from the sample user story.
The sample in Figure 6.4 shows three separate threads, one each for customer, product, and revenue transactions. Each thread shows the progression of data across a set of swim lanes that correspond to the layers in the company’s DWBI reference architecture. In the sample work presented in the last chapter, the enterprise architect informed the project architect that their company already has a repository of cleansed, integrated customer records, so, in Figure 6.4, the diagram’s customer data thread starts in the integration layer with an existing data object. For product and revenue, the team will have to acquire its own data, so those threads start with “new” data objects drawn in the staging area. With these threads, the data architect reveals his plan to first integrate product and revenue records from the two source systems and then dimensionalize it. The semantic layer in the dashboard tool will link the resulting dimensions and facts to make it look like a single data object for the user’s front-end applications.
The systems analyst exerted some influence on how the diagram for this example was drawn. Having learned from the enterprise and project architect that many of the company’s customers actually pay for their services in quarterly installments, he realized that revenue data actually take two forms—what was billed to the customer every 3 months and the monthly break out of those quarterly payments. The data architect had suggested only a data object called revenue fact for the presentation layer. Realizing that the team would need to apply some complex business rules for allocating quarterly billings to monthly revenue bookings, the systems analysts asked that billed and booked revenue be represented as two separate data objects so that the team would treat them as separate developer stories. When the revenue data structures are later fully realized, each of these developer stories may pertain only to a distinct set of columns within a single physical table or may become a separate physical table each. Given that the developer workshop’s data flow diagram serves as a work-planning rather than a design artifact, the data architect was happy to draw two data objects, understanding that he would be later free to realize the objects differently in the application’s design if need be.
Once this schematic data flow diagram was complete, the team could see that viewing the single user story of our example through the lens of the DWBI reference architecture resulted in 11 developer stories. In practice, a multiplier of 10 to 1 or even higher is not uncommon for data integration projects. There is a further multiplier for translating developer stories into development tasks, as demonstrated earlier by Table 2.2, which listed the typical steps to building a common dimension object for a data warehouse. The combined effect of these two multipliers reveals why many teams that try to utilize generic Scrum can find data integration projects overwhelming. Working with only user stories, they may plan to deliver three or four stories per iteration, only to see the work explode by a factor of 200 or more tasks per story—far more than can be handled easily on a task board by a self-organized team of a half-dozen developers. Introducing the developer story and conducting development planning there bring the objectives of each iteration down to a reasonable number with no hidden multiplier involved, making the work far more manageable.
The aforementioned discussion focused on identifying developer stories during the initial stages of a project in order to scope the whole project and to provide an initial project estimate, as required by the inception phase of the release cycle. The team will repeat developer story workshops as necessary through remaining phases of the release cycle, often as part of the backlog grooming process that precedes each story conference. Typically the product owner will meet with the project architect a week or two before a story conference to groom the backlog of user stories. These two will then support the data architect and systems analyst as they convert the new and modified user stories at the top of the list into developer stories so that the team can conduct the next story conference with well-defined developer stories and form a reasonable commitment for the iteration. For those stories that the team will most likely work during the next sprint, the data architect and systems analyst also need to provide data and process designs at an 80/20 level of completion so that the programmers can move to coding without delay. These specifications do arise instantaneously; we will discuss in Chapter 8 how to create the time the data architect and systems analyst will need for this work.
Evaluating good developer stories: DILBERT’S test
Whether at the start of a release cycle or at any point during construction, the team will need a repeatable means to judge whether each developer story is defined sufficiently. For user stories, Scrum provides the INVEST test to give a team a quick notion of whether the user story is workable. Because developer stories are decompositions of user stories, much of the INVEST test will still apply, but we will need to add a component to acknowledge the crucial role the layers of the DWBI reference architecture play in their definition. After adding a couple of new components and renaming a couple of others, the test for a good developer story becomes a checklist that includes demonstrable, independent, layered, business valued, estimable, refinable, testable, and small. With those modifications, INVEST criteria for user stories become “DILBERT’S” test for developer stories, as detailed in Figure 6.5.
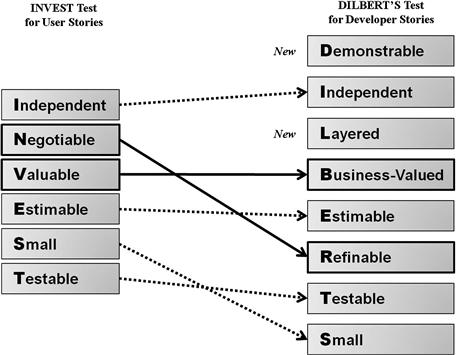
Figure 6.5 Deriving DILBERT’S test from the user story INVEST test.
With this second guideline in place, a team will continue to use INVEST for testing its user stories, dropping down to DILBERT’S test whenever it comes time to draft developer stories by stretching the user story across the DWBI reference data architecture. A quick description of each component of DILBERT’S test is found next.
Demonstrable
“Demonstrable” indicates that the deliverables for each developer story should result in something that can be demonstrated to the product owner during a sprint’s user demo. Therefore, each developer story can be accepted or rejected at the conclusion of the iteration.
The greatest challenge to delivering data integration services incrementally is that it can take two or more iterations to move all the necessary data elements from the operational source systems to the dashboard where they can be reviewed by the product owner. Using the DWBI reference data architecture to segment a user story is a great technique for making data transformation steps manageable for the developers. The danger with that approach, however, is that teams become largely occupied developing pieces for the invisible layers behind each end-user dashboard and neglect to review them with the product owner.
Waterfall methods incur tremendous risk when their teams stop communicating with the end-user community for months at a time while programmers construct the application. Agile warehousing teams want to avoid this practice and instead keep the users involved tightly with the project as the application takes shape. As they standardize, deduplicate, and merge operational data, adding history and derived columns, they need stakeholder feedback every few weeks to tell them where they have misunderstood the requirements or failed to apply a transformation rule properly. Without this regular feedback, they cannot hope to “fail fast and fix quickly.”
Luckily, the remedy requires only a small amount of effort. Every developer story must be defined so that it is demonstrable. Simply pushing data from one layer to the next is not enough. The team must also conclude every developer story with a display of results that the product owner can review. As shown in Figure 6.4, developers need to provide a simple dashboard for each layer of the reference architecture so that the product owner can examine the results of the developer story for himself. At the conclusion of each iteration, the developers should update these “product-owner portals” so that their business partner can review whatever new transforms have been added, no matter how small, and provide feedback.
Whereas on first thought it would seem that business users would have little interest in these intermediate steps data take, in practice the normally hidden data layers can prove very useful to the product owner. For example, by looking simply only at staged data, he can detect problems with source data quality the team had overlooked. He might run a simple reconciliation back to source to determine if the acquired data are complete and correct from a business perspective. He can validate the output of data cleansing transforms in the data quality layer of the DWBI reference architecture and help identify those areas of source data that have been too mangled by the data entry operators for a programmed routine to repair. A dashboard connected to staging and cleansing layers will allow him to try out different ways of joining the company’s data on business keys and discover business rules and other insights buried within corporate information that no one ever suspected was there. These product-owner portals to the intermediate data layers do not need to be elaborate, production-ready dashboards. Only the product owner and his chosen few from the business departments will evaluate the iteration results using these front ends. Often displaying only one or two table’s of data at a time will support the necessary evaluations. Building these simple front ends so the product owner can fully participate in validation during each sprint is a small price to pay for the user-based feedback they generate.
Independent
For developer stories, independent means teams need to define and sequence developer stories so that each can be coded when it arrives at the top of the project backlog. A story that fails this test cannot be worked on when scheduled because it depends on one or more other stories that have not been completed yet.
The independence of developer stories can be enhanced greatly by the way the data architect and systems analysts define them. In the sample data flow diagram presented in Figure 6.4, the team may find itself delayed in starting on the revenue trends universe because it depends on the booked revenue fact table, which involves some complex business rules. To make sure that the developer story is independent, the team leads could split it into two developer stories—a universe each for billed and booked revenue—allowing a good portion of the project to be developed before the allocation business rules were finished.
Layered
The “layered” criterion indicates that a single developer story shows development in only one layer of the DWBI reference data architecture. Focusing on one layer will also help considerably to make each story independent, especially if all its inputs and outputs connect to data objects located outside the layer in question. If developer stories scoped to either the integration or the presentation layer still do not feel “right sized,” the team can extend the layered concept and try restricting the story to a single rank of a tiered data model, as discussed in the next chapter.
Business valued
“Business valued” reminds the developers that they must define and communicate every developer story so that the product owner appreciates it as a significant step toward delivering the overall application. This criterion will probably be the one that requires the most effort and creativity from the technical members of the team. Many DWBI professionals believe this objective cannot be achieved. In their vision, business partners want to perform their analysis using fully dimensionalized data and could care less about what each dimension looks like individually. This interpretation is true only in a minority of projects and can be reduced even further if the team manages its rapport with the product owner properly.
Far more common are product owners who have struggled with one or more IT projects in the past, maybe even a data warehousing effort. They hated the fact that developers disappeared for months on end, only to return with an application that tragically failed to meet key business requirements. These project veterans comprehend all too well the tremendous risk a large data integration project represents, both in terms of expense and opportunity costs. Instead of being dismissive of the incremental steps involved in delivering data, the product owners will be thrilled at the chance to see and manipulate warehouse data at each step in the reference architecture, for such demonstrations assure them progress is being made and the risk they run by associating their name with the project is being reduced steadily.
True, the team may have to educate its product owner some regarding the reference architecture that defines the waypoint along which data added must reach as it moves through the warehouse. Most business partners these days have worked with data applications so they will understand readily the fact that data must be staged before it can be scrubbed and integrated before it can be arranged nicely for analysis. If the data warehousing terminology interferes with understanding, dimensions and facts can be reexpressed in business terms such as metrics and qualifiers to make them business meaningful.
Once the product owner is oriented properly, the team should keep the schematic data flow diagram for each user story on the project board. With such a graphic, the team can check off each element as demonstrated to the product owner so that progress toward the final objective—the dashboard—can be visualized and tracked easily.
Furthermore, the project architect can take on the role of finding business-relevant queries that will communicate to the product owner the progress represented by each intermediate delivery. As the product owner test drives a dashboard connected to one of the data layers of the warehouse, the project architect could provide the following commentary in order to underscore the business value of the developer stories being reviewed:
• I remember you had your doubts whether any team could actually get usable data out of our new enterprise resource planning system. However, in this simple dashboard here, we can see staged data showing purchase orders and the line items linked to each. Why not take a moment during this demo and see if you can filter for the orders given to your most troublesome vendors during the month of December?
• I recall your concern about whether the service addresses in the western region’s call center system were usable. Let’s look at the dashboard we built for you showing customer account records that we just finished cleansing. You’ll see we can now aggregate 99% of the service locations by census block, based on standardized postal addresses. That puts us in a position to consider the special business rules needed for the remaining 1%, which would make a good developer story for the next sprint.
• I wrote in my notes that you were worried we would not be able to trace customer orders to shipping dock activity in order to get fulfillment cycle times. In this dashboard for the integration layer we just built for you, we can show that less than half a percent of sales cannot be traced to an outgoing tracking number. Does that seem like a big step to providing the traceability you’re looking for?
With a little creativity, the technical teammates will be able to fine-tune each developer story so that an interesting demonstration can be presented to the product owner. The small minority of stories that cannot be given a business-intelligible interpretation can be declared part of the 20% architectural reserve described in earlier chapters on generic agile project management.
Demonstration ideas are especially easy to come by if developers keep in mind that the product owner is being held accountable by company executives for the project’s enormous burn rate against budgeted funds. Like anyone in that situation, he will have a strong interest in seeing business-intelligible evidence that the team is making progress. It will not matter if that proof of progress comes through a hastily created BI portal connected to data on a system test server. As long as he can trace it to a waypoint on the high-level architecture diagram and perform some business-meaningful operation with it, he can make a compelling report to his management that the project is moving forward. We will explore how teams can even give their product owners an approximate percentage completion to report when we discuss project estimation techniques in the next chapter.
Estimable
This component of the test is borrowed directly from INVEST, where we stated that the story must describe work specifically enough for the team to be able to estimate the level of effort required to complete it. The next chapter discusses estimation at length.
Refinable
“Refinable” means that the wording of a developer story should be meaningful and well scoped, but the details are left to be filled in later. This component of the acronym is primarily a simple rewording of INVEST’s Not-Too-Specific criterion, but may actually be the more useful of the two notions. True, a team may waste valuable time by gathering too many specifics up front for a story, but, more importantly, the accuracy of one’s vision improves as the project progresses. Stating a story loosely at first and refining it close to the moment that its build-out begins positions teammates to discuss requirements and design at a time when their knowledge of both will be at their peak. Overall, product owner and developers will make the fewest mistakes if they organize the project with short statements of intent, planning to refine those statements into a fuller expression of requirements when they start transforming work upon a module.
One way to keep developer stories from descending into too much detail is to instruct teams to focus on only the “what” of a story, that is, what has to be accomplished, deferring the how for discussion within the development portion of the iteration in which the module will be built. For example, it will be enough to write a particular developer story stating that addresses will be cleansed, leaving out the details of how street and city names should be actually parsed into tokens and what lookup tables should provide the replacement strings need to standardize the components identified. The fact that the team includes a data architect and systems analyst who will be providing 80/20 specifications for the programmers when they begin to code a developer story ensures that the project will have a coherent data and processing architecture. Within that context, if a developer story provides just enough information that the team can determine if it fits comfortably within the time box of a sprint, all other details can be deferred until later.
Testable
This element is borrowed directly from the INVEST test, which stated a story should describe a unit of functionality that is small and distinct enough to be validated in a straightforward manner.
Luckily, developer stories are fairly close to the “units” that developers have in mind when they consider “unit testing” their code. This proximity makes validation of developer stories fairly easy for them to envision. We discuss testing for data integration projects in much greater detail in the enterprise volume of this two-book set.
Small
This criterion is also borrowed directly from the INVEST test, which suggests that every story should have such a limited scope that the work implied will consume only a fraction of the team resources available during a sprint. Fortunately, if the team applies the earlier criteria of layered, independent, and testable properly, “small” usually results. When this combination does not achieve that effect, there are secondary techniques for further decomposition, as discussed next.
Secondary techniques when developer stories are still too large
What happens if a developer story meets all the criteria of DILBERT’S test except for small? The story is perfectly layered, business valued, and demonstrable, yet the team does not believe developers can complete it within a single iteration. Letting developer stories exceed a single iteration will seriously undermine a team’s ability to manage its work. If all stories spread across three or four iterations regularly, problematic stories will no longer be detected quickly. The team also risks ending an iteration with unfinished stories and absolutely nothing to demonstrate to the product owner. Velocity will be impossible to measure and, without a metric for work accomplished, retrospective will become effete for process improvement. Clearly, if the developer stories created by pressing a user story through the sieve of our DWBI reference architecture yield stories that are still too big, the team will need another battery of tactics to achieve the granularity required for smooth, iterative development. Luckily, the data architect can take the lead on further decomposing the work into smaller developer stories by splitting their target data objects between separate sets or rows, columns, column types, or tables.
Decomposition by rows
Breaking out candidate developer stories by identifying separately loadable sets of rows is possible when each source added to the warehouse results in an additional, independent set of records in the target tables. As long as each new source does not require updates to the rows already loaded, the team will find further substories packed within the candidate developer story that can be pursued in different iterations.
This technique is particularly useful when rows resulting from each new source derive from very different sources or transformation rules. By decomposing the candidate story into these distinctly transformed set of rows, the team allows itself to focus on just one complex transformation at a time, with probable gains in module testability and data quality as well.
Figure 6.6 depicts this decomposition technique using the example from our initial backlog discussion of the sales channel in the last chapter. During that conversation, stakeholders warned the team that each region of the company used very different business rules to determine which part of their organization was responsible for maintaining the relationship with a customer. The “load sales channel dimension” developer story suddenly appeared to the team as a module that would take many iterations to load.
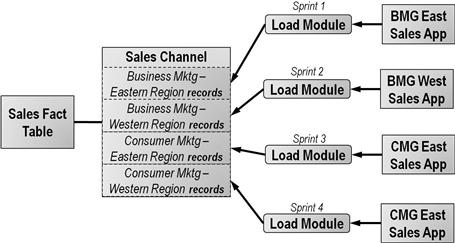
Figure 6.6 Developer stories by sets of rows.
Here the team drew upon the skills of the data architect. As part of the design process, data architects determine how dimensional data will be stored and how data will be joined to the records of the fact table. In this example, the data architect was able to assure the team that each region’s business rules will result in a new independent set of records in the sales channel dimension table. Furthermore, because there will be no snowflaking of the dimension involved, these records will link only to fact records sourced from the transaction systems of that region.
With those assurances, the system analysts could determine that each transaction source would simply layer another set of records into the sales channel dimension table without requiring modifications to previous load rows. That said, the “load sales channel” candidate story could then be subdivided into separate developer stories for loading the sales channel records from the unique source for each of the company’s sales regions. With the channels assigned according to the particular business rules of the region a sale belongs to, each of these developer stories dealt with only a single transformation pattern. Each developer story now appeared small enough that each of them would fit within a single iteration.
While performing this secondary decomposition, the team quickly revisited the other key points of DILBERT’S test besides small for each new developer story:
• Each story remained demonstrable because with a changeable filter on region code, the product owner could zero in on the new records loaded by each successive story.
• Each wave of source records resulted only in inserts upon the target table and no updates so the stories were independent.
• The secondary stories all pertained to the integration section of the reference architecture, even a stratum of records within the sales channel table, making them tightly layered.
• Each such demonstration would allow the product owner to report to his management that yet another region’s sales channel was now stored correctly in the warehouse and the scope of transactions his portal can analyze is expanding steadily, making the story business valued.
• By decoupling the complex transformation rules, the logic involved with each substory could be considered separately, making them all the more estimable.
• The conversation with the data architect touched only lightly on the transformation rules for each region’s segment records, leaving the details to be managed during the development work specific to each regional source, thus keeping the new stories refinable.
• Smaller independent modules based on a single business rule are always more testable than modules involving many transform patterns.
Secondary decomposition by row set works equally well for fact tables as it does for dimensions, as long as the load for each additional source results in an insert of new data without necessary updates to existing records. In our example, the data architect intends to design the fact table to hold revenue transactions. These are atomic, one-time events that pertain only to a particular region so that the record sets can be loaded independently. Therefore, should the “load revenue fact” developer story prove to be too large for a single iteration, it too can be decomposed into substories where each pertains to a specific data source. However, a story phrased as “load corporate sales channel order status fact table” would probably not be segmentable by regional row set because the fact records are now linking to dimension records that have been generalized to a level above region, and the status-oriented nature of the fact table implies that a previous fact record will have to be updated should a later transaction push it into another sales channel category.
Decomposition by column sets
The second of these techniques by which the data architect can further downsize developer stories is by splitting target data objects by the sets of column set to be loaded. This approach can be a bit trickier to think through, however. Load modules can be devastated by a change in the data structures. Because a large amount of code has to be updated, retested, and then promoted to production even if a single column name or its width changes, teams in general are very wary about changing the columns making up their target tables.
In some circumstances, however, the team can safely alter a table structure, allowing it to defer design decisions and constructively evolve a target schema as they work through a series of developer stories. In particular, as long as each new story requires that columns only be added, not changed, dropped, or renamed, then a series of developer stories based on distinct column sets can be pursued independently. Such stories will not entail reworking existing code, for any new column was not present when existing modules were developed, and therefore could not have been referenced by them.
A series of column-based developer stories can be envisioned using the example depicted in Figure 6.7. This example pertains to the product dimension table of the sample outlined in the previous chapter. Each new source system would provide product identifiers employing a unique set of native keys—keys that end users would want to reference in the dashboards. For this requirement, the data architect decided that each set of native keys would load into their own set of columns in the target table, exactly the design revealed in Figure 6.7. Over time the column sets will fill out moving left to right rather than top to bottom as occurred with the row sets of our previous technique.
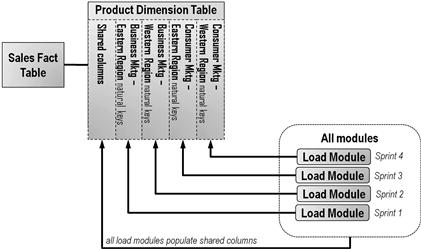
Figure 6.7 Decomposing developer stories by sets of columns.
There will be, of course, some shared columns pertaining to surrogate keys, a standardized identifier, and both warehouse and source meta data that will be populated no matter which data source is being processed. As long as the loading of shared columns remains consistent, no rework of existing code will be required. In fact, such consistency can be achieved easily by asking the developers to employ a reusable subprocess responsible for loading these shared columns.
As shown in Figure 6.7, the transforms populating the regional native keys can be decomposed into separate modules. Each of the modules will provide values for both its own specific target columns and the shared columns along the left edge of the table. The specific columns will hold the source system’s native keys for products, which will be convenient for the developers, as the source systems have wildly different formats for their product identifiers. The shared columns will receive the corporate product code that will allow rational consolidation of the separate product catalogs.
The decomposition by column set scheme allows developers to build separate load modules one at a time for each new source system rather than having to digest all the product identifier transformation rules in one iteration. The data architect can even defer specifying the attributes for each successive column set until the team is ready to build the transforms needed for a given source system, making even data design work incremental.
While decomposing the “load product dimension” story into developer stories for specific column sets, the team repeatedly applied DILBERT’S test to the new developer stories. Their analysis paralleled that of the row set approach given earlier, with exception of demonstrable. When working with a progressive set of rows, the team needed to provide only a changeable filter to allow the product owner to view the accomplishments of each story in turn. With column sets, however, the team will have to add new columns to the semantic layer of the product owner’s portal after every story so that the product owner can see data loaded into those new fields. Luckily, semantic layers are updated easily, especially when they provide single-table access as required here.
Decomposition by column type
The third means by which a data architect can further downsize developer stories is by splitting them across the different types of columns to be loaded. Large developer stories can also be decomposed along column sets that pertain to types of columns rather than individual sources. If the project architect can successfully educate the product owner about the differences between the column types included in most warehousing tables, then the team may well be able to define the developer stories to sequentially deliver data to different sets of column types as the iterations progress.
As portrayed by Figure 6.8, there is a natural division within warehouse tables between columns that receive simply replicated columns from source tables versus columns receiving derived values created by complex transformation rules. There are also columns for primary keys, foreign keys, and aggregates, as well as meta data from source or meta data generated by the warehouse itself.
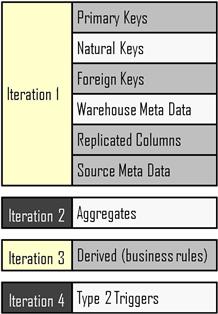
Figure 6.8 Different column types found in data warehousing tables.
Although a product owner instinctively wants all data made available immediately, project architects can share with them that there is a different business value provided by each type of column. Keys alone will enable counts to be calculated for the entities in the dimensional model. Counts are often the first business value stakeholders need to have when they begin working with newly loaded data. Textual replicated columns allow those counts to be filtered and combined selectively by values found in the source system. Numerical replicated columns can be summed and averaged. With such counts, sums, and simple filtering, the product owner can generate a first set of business insights to review. True, the capability is limited, but most product owners will agree that working with some information now is preferable to remaining blind to business operations until everything needed is in place.
By providing the column types needed for such simple analytics, developers will have bought themselves some time to work on delivering the derived columns that will need complex business rules coded. They can even consider dividing groups of business rules into distinct subwaves in order to make the remaining developer stories small enough to fit into sprints.
In the initial user story interview session described in the last chapter, finance had mentioned that postal addresses needed to be scrubbed before they would be reliable. In order to decompose the “deliver addresses” developer story, the team can consider segmenting the work between directly loadable columns versus columns needing scrubbing. In particular, postal address lines one and two (which typically hold street number, street name, and living unit identifier) will need standardization, but the city, state, and postal code attributes are well controlled by the source systems and can be loaded as is. Thus the work can be distributed across two iterations, the first delivering immediately replicable columns such as CISTAZIP, which will allow transactions to be analyzed down to the postal code level. In the second sprint, the team would finish up the scrubbed columns, allowing metric disaggregation down to the street and census block level.
In reaching small via this technique, the elements of DILBERT’S test largely track the pattern established in the previous two examples. For business valued in particular, however, the team needed to work a bit harder to explain for the product owner the new set of analyses made possible as each column type is populated in the target tables. Demonstrable required repeated updates to the product owner portal as new column sets became available. Separating transformation rules from other column types led to substories that make the developer stories independent. The tighter scopes of these new stories made the delivery increments more estimable and testable.
Decomposition by tables
The fourth technique by which the data architect can further downsize developer stories is by splitting the target tables they focus upon into special purpose objects. When faced with time-oriented entities such as a customer with so much history that queries began to run long, DWBI data architects realized long ago that they could separate these large tables into two versions: one table holding all history and a smaller one with only the last image for each native key. For many BI applications, because the vast majority of analyses focus on recent events or current status, these queries can be answered from current data only. Furthermore, queries reporting on trends are often based on only a few time points, such as the end of each month over the prior 3 years. Only rarely do the users truly mine the full life cycle of a topic and require information as of any arbitrary point in time. Given this natural division in usage, data architects can provide fast performance for the bulk of user queries by designating a “current history” table that holds data for only the most recent, frequently used time points. Such tables contain considerably less data to be processed by each query, allowing the system to return results far more quickly.
When a project involves a set of user stories requiring current data and others based on full history, the developer story for some of the larger dimensions can be split between “deliver current data” and “deliver full history.” This design pattern actually reflects what is commonly called a “type 4” dimension. [Kimball Group 2011] Developer stories for deliver current data typically require less complex logic than full history routines because old records for a native key can be simply replaced rather than marked inactive. Often the data volumes for current data sets are low enough that the developer story can require only a full refresh (“kill and fill”), making the load logic very straightforward.
Figure 6.9 depicts the decision to break a developer story for a large dimension into two. The data architect first adds a “current-only” version of the dimension entity to his data models. The team then defines a developer story for “deliver current customer data” and another for “deliver full history customer data.” Whereas the original developer story was considered so large it would take two sprints to complete, the new developer stories can each be delivered and demonstrated in a single iteration.
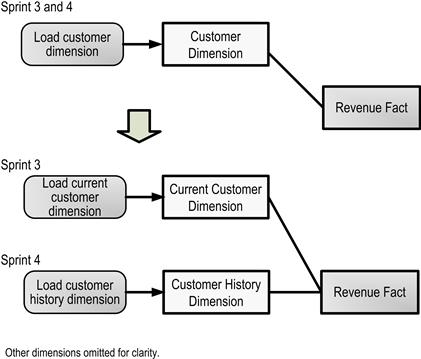
Figure 6.9 Decomposing developer stories by target tables.
As far as DILBERT’S test is concerned, delivering the current table is clearly demonstrable as long as the project architect actively scopes the product owner’s review to questions involving latest customer segments. The business value will be certainly apparent, as the first developer story will provide data that address nearly all of the questions users have in mind. Because the fact records have separate foreign key columns linking them to the two versions of the segment dimension, those foreign keys can be loaded in separate processing runs, making the stories independent. As with the other segmentation techniques, the tighter scope of the new developer stories makes them both more estimable and testable.
Theoretical advantages of “small”
With the techniques considered earlier, we now have a deep toolkit for decomposing user stories as much as necessary to prepare them for iterative delivery. Our overall process is progressive by nature:
• The methods of the last chapter let us move from big statements of user needs down to clearly scoped user stories, all sized properly for the product owner to track.
• The decomposition process documented in this chapter breaks those user stories into developer stories where the work is right-sized for software developers to pursue using a time-boxed, iterative development process.
• Once a development sprint begins, developers will further decompose the developer stories into tasks small enough for an individual to complete within a matter of a few days.
This process steadily reduces the scope or “size” of the request confronting the developers, yielding two important benefits. First, by reducing scope we steadily drive uncertainty out of each product owner request until the unknowns that remain can be managed successfully via the eye-to-eye collaboration that agile methods rely upon. By addressing detailed requirements and design through direct conversation, development teams can do without the large, up-front specifications that consume so much time and effort under waterfall methods.
The second benefit of steadily reducing the scope of a given developer story is that the size of the work units becomes increasingly homogeneous; this convergence allows the development process to proceed far more smoothly. Figure 6.10 depicts two projects, both being pursued iteratively, but taking very different approaches to the definition of their work packages. In both, the work bundles are trying to thread through a small aperture in a wall. This constraint represents each team’s finite capacity to turn requirements into working code during a single iteration.
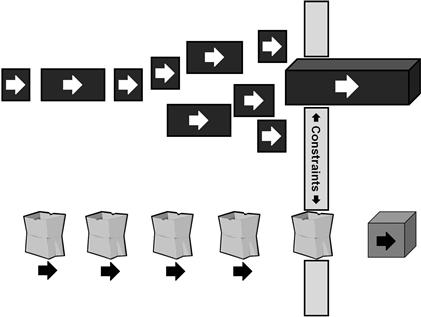
Figure 6.10 Consistent story size improves an agile team’s velocity.
In the first project, the developers have spent no time at all trying to break the work bundles down to a consistent size, especially one appropriate for the size of their aperture. As can be seen, such an approach is a prescription for delays and frustration when a particularly large work package plugs the opening for more than one iteration. These developers can expect to frequently appear at their user demo with nothing appreciable to show for the prior sprint. With sprints for a team of six coders costing somewhere between $75 K and $150 K per iteration (2010 dollars), such disappointments will increase the anxiety of the product owner and his sponsors quickly.
The second project, however, has taken a different approach. Its developers have taken the time and acquired the skills to decompose their work steadily until it sits in their backlog as a collection of more or less homogeneously sized work bundles. We will see in the next chapter how they can quantify module and work package size, but for now we can say that the developers acquire an intuitive sense of the complexities of their modules so that they can continue decomposing them until they all feel consistent and appropriate compared to their team capacity. As shown in the previous chapter, the team moves toward consistently sized user stories using the INVEST test and then to right-sized developer stories using DILBERT’S test.
The payoff is apparent in the bottom portion of Figure 6.10. By measuring their velocity each iteration, these developers have discovered their capacity to convert requirements into working code. They can think of their capacity as the aperture in the wall that is just right for a, say, 10-pound sack to fit through. Using the decomposition methods discussed in this chapter they have broken the work down into units of 10 pounds or less so that they can fill each sack with close to that exact amount of work. Once packaged in this way, they can move the sacks steadily through the aperture. By taking each request through the chain of epics, themes, and two kinds of stories, they know that there is no oversized request in any of the sacks that is going to clog up the gap in the wall. They will be able to steadily convert user needs into working code free of any complications due to work package size. Moreover, the team can optimize their work habits for the 10-pound sacks and acquire far more velocity than if they had to keep their work habits able to manage a wide range of work package sizes.
Readers should be careful not to interpret the story preparation described in the chapters of this part of the book as somehow returning to waterfall’s notion of “define everything down to the last detail” before a team begins system construction. Instead, the stack of project definition objects displayed in Figure 6.2 remains a single-sentence requirement identifier. The initial project backlog interviews and developer story workshops attempt to identify a whole project’s worth of work, but only for scoping, estimating, and scheduling purposes. The product owner and team expect the stories in the bottom half of the list to have considerably more precision than those at the top. Moreover, the data architect and systems analysts provide specifications only for developer stories that will be programmed in the next iterations, and those artifacts will be 80/20 specifications at that.
Of course, occasionally teams will underestimate a package. Agile accepts some surprises as the price to pay for faster project starts and higher delivery speeds. Agile’s iterative structure and sprint retrospectives give a team the chance to discuss the pain caused by such misestimation so that they can steadily improve their work-definition techniques. Yet, such misestimation will be the exceptional occurrence for agile warehousing teams that employ developer stories. By driving the work definition past the level of user stories, down to the developer’s notions of work units, these teams will uncover a good deal of the technical work hidden in a project’s user requirements. They will see this implicit technical work in enough detail that the risk of such nasty surprises becomes sufficiently small.
With developer stories and their decomposition techniques now illustrated, all that is left of our three-step project definition process is to estimate the size of the work packages so that a team can recombine them into the “10-pound sacks” described earlier. Techniques for such estimation and packaging are precisely the object of the next chapter.
Summary
A backlog of good user stories defines a project well, but data warehousing efforts involving significant portions of data integration need to develop those user stories one step further into developer stories in order to arrive at a list of work units that will fit easily into Scrum’s iteration time box. Developer stories are user stories decomposed using the macro data architecture that the project’s data architect specifies. Each developer story represents a work unit that developers can plan and deliver easily within an iteration, and it is a deliverable that will be valued by the project’s embedded business partner.
The primary means of identifying developer stories is to conceptually stretch a user story across the layers of a data warehouse’s high-level data architecture, often called the “DWBI reference data architecture” by data warehousing professionals. A typical DWBI reference architecture has layers for each major data modeling paradigm within the warehouse: staging, integration, presentation, semantics, and dashboards. Teams can generate a starter list of developer stories by inspecting the intersection between the layers of a company’s DWBI reference architecture with each user story in the project backlog. Agile warehousing practitioners can employ the “DILBERT’S test” to appraise whether each resulting developer story is sufficiently defined and actionable.
For any candidate story that is still too large, there are several secondary techniques for decomposing them one step further. These secondary techniques subdivide developer stories by considering the sets of rows, columns, column types, and tables required by the candidate story. At the conclusion of this decomposition process, the team will have a project backlog of developer stories they can estimate and then assemble into an agile project plan.